OpenResty Edge Error Logs: View Application, Global & Gateway Server Logs
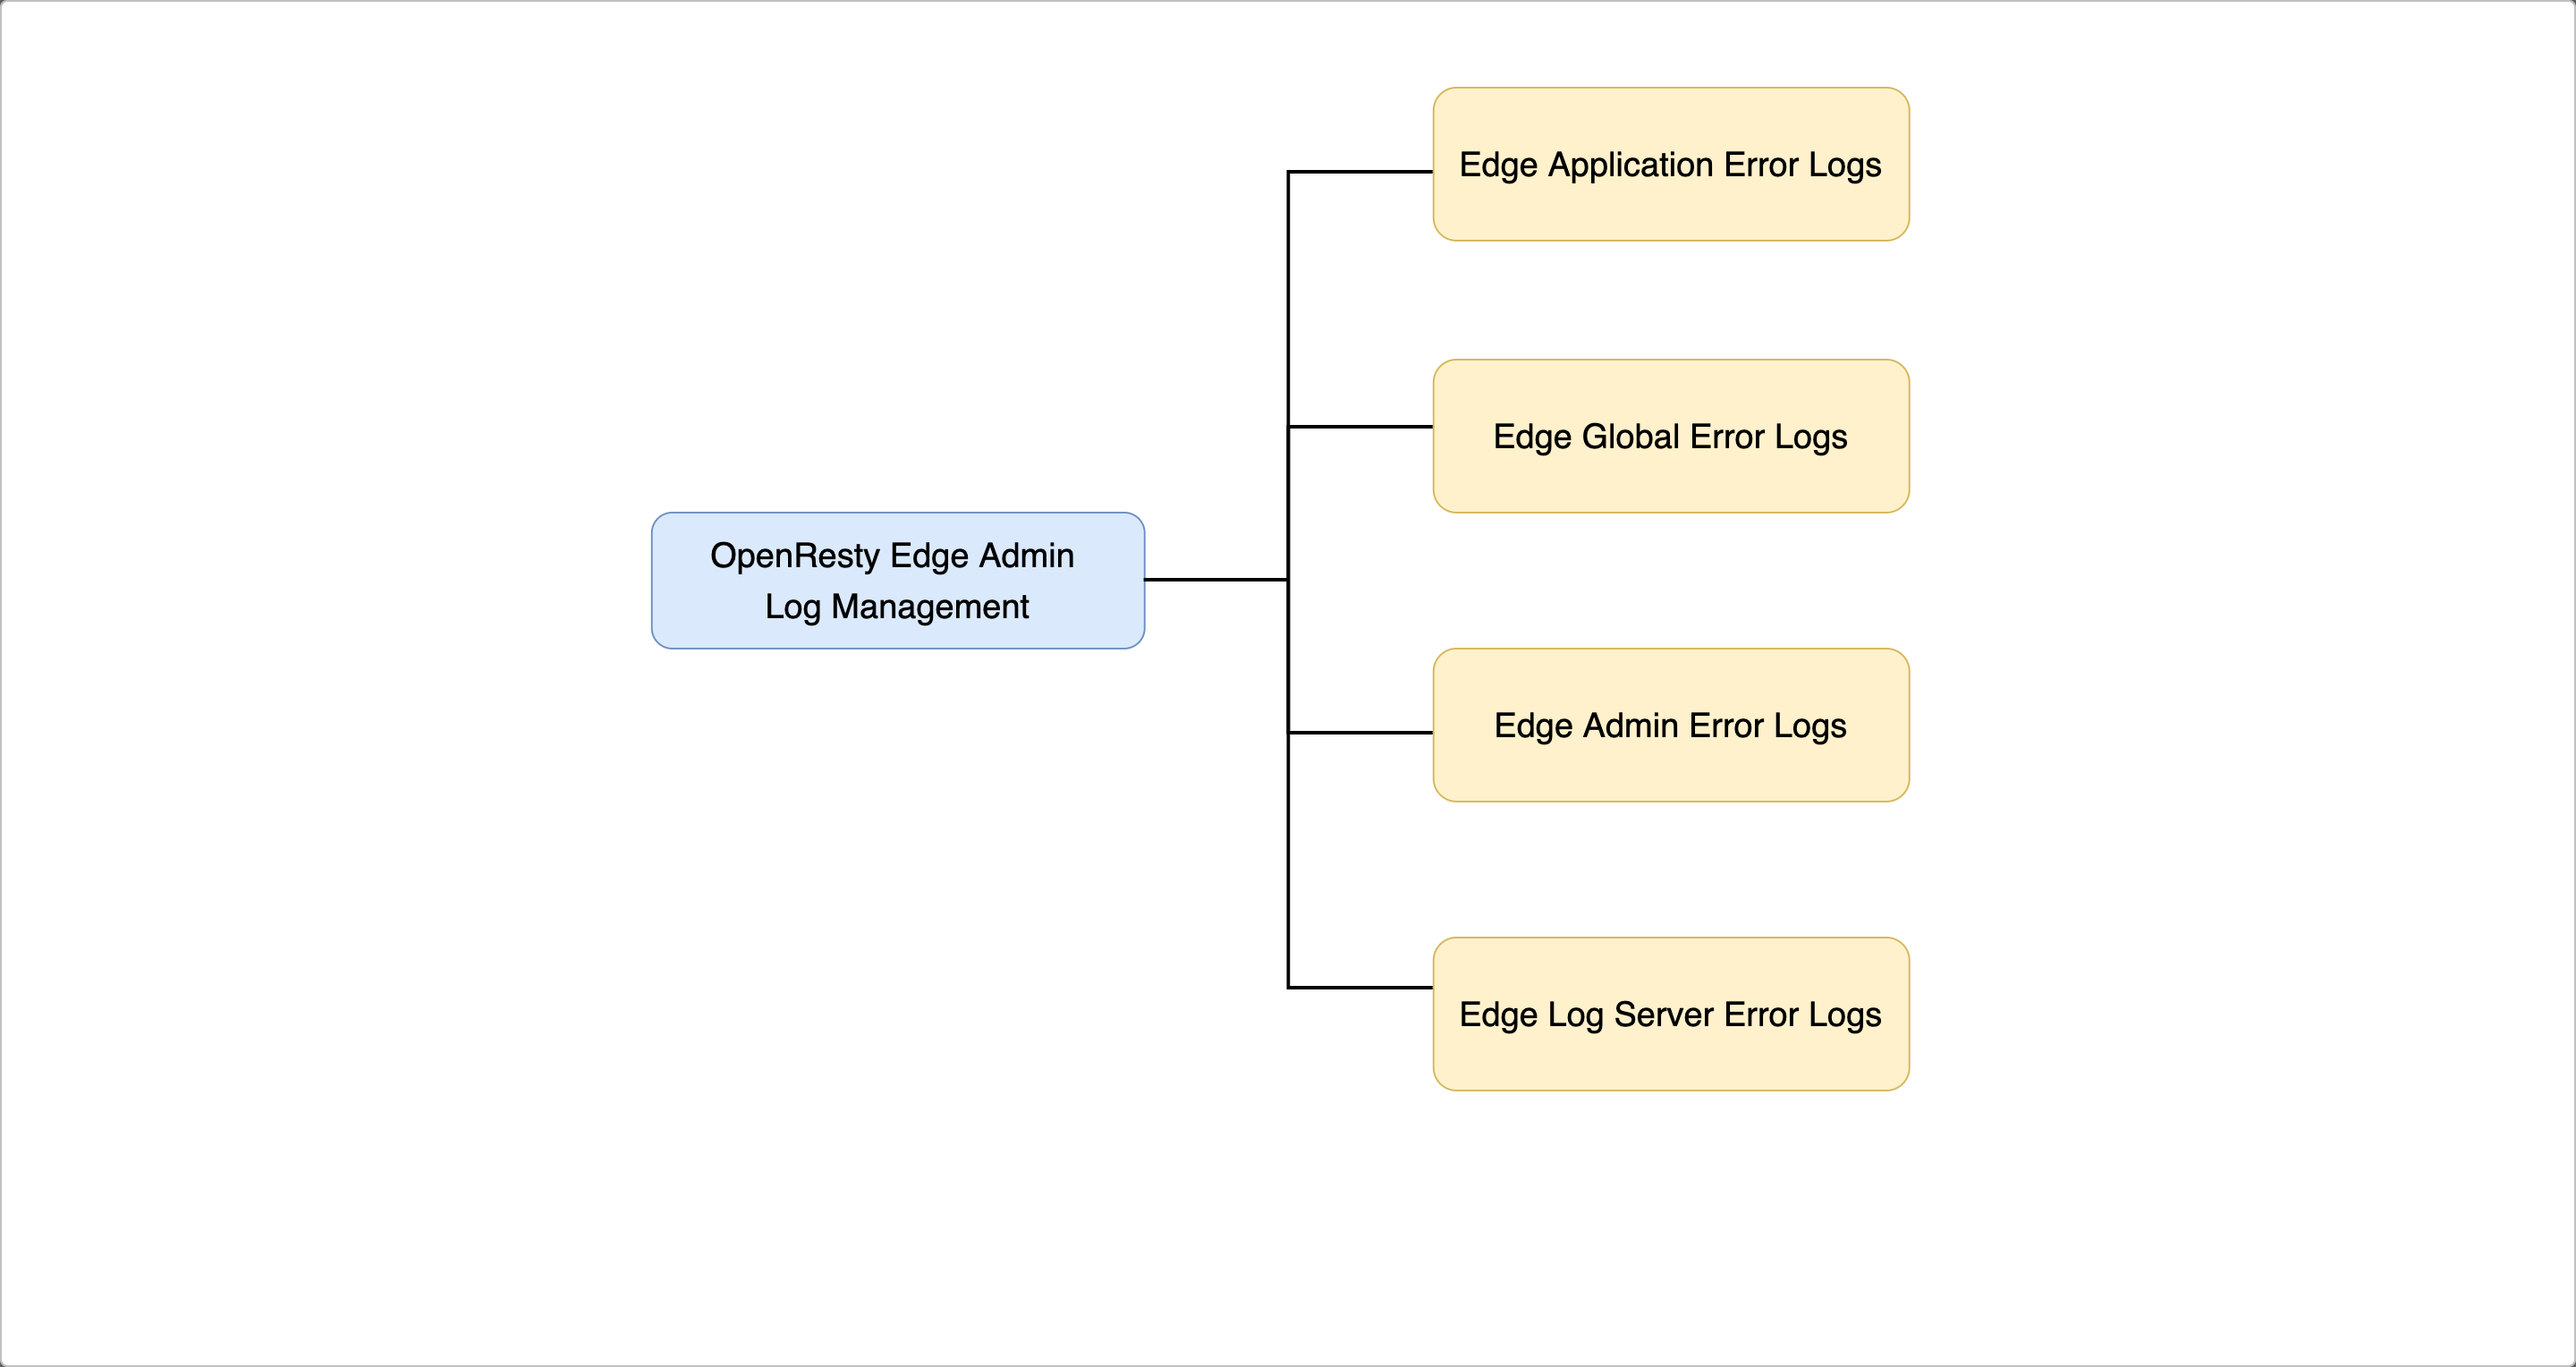
In OpenResty Edge, you check error logs in two places: each application has its own error logs page in the Admin console, and the dashboard shows the global error logs collected across all gateway servers. Both let you filter by Request ID, gateway, server, log level, and time interval, and you can always drill down to the raw error.log file on an individual gateway or Admin server. This tutorial walks through all of them, and how they relate to per-request tracing via the Request ID (Req-ID) and to access logs.
How to view application error logs in OpenResty Edge
As always, let’s go to the OpenResty Edge’s Admin web console. This is our sample deployment of the console. Every user has their local deployment.
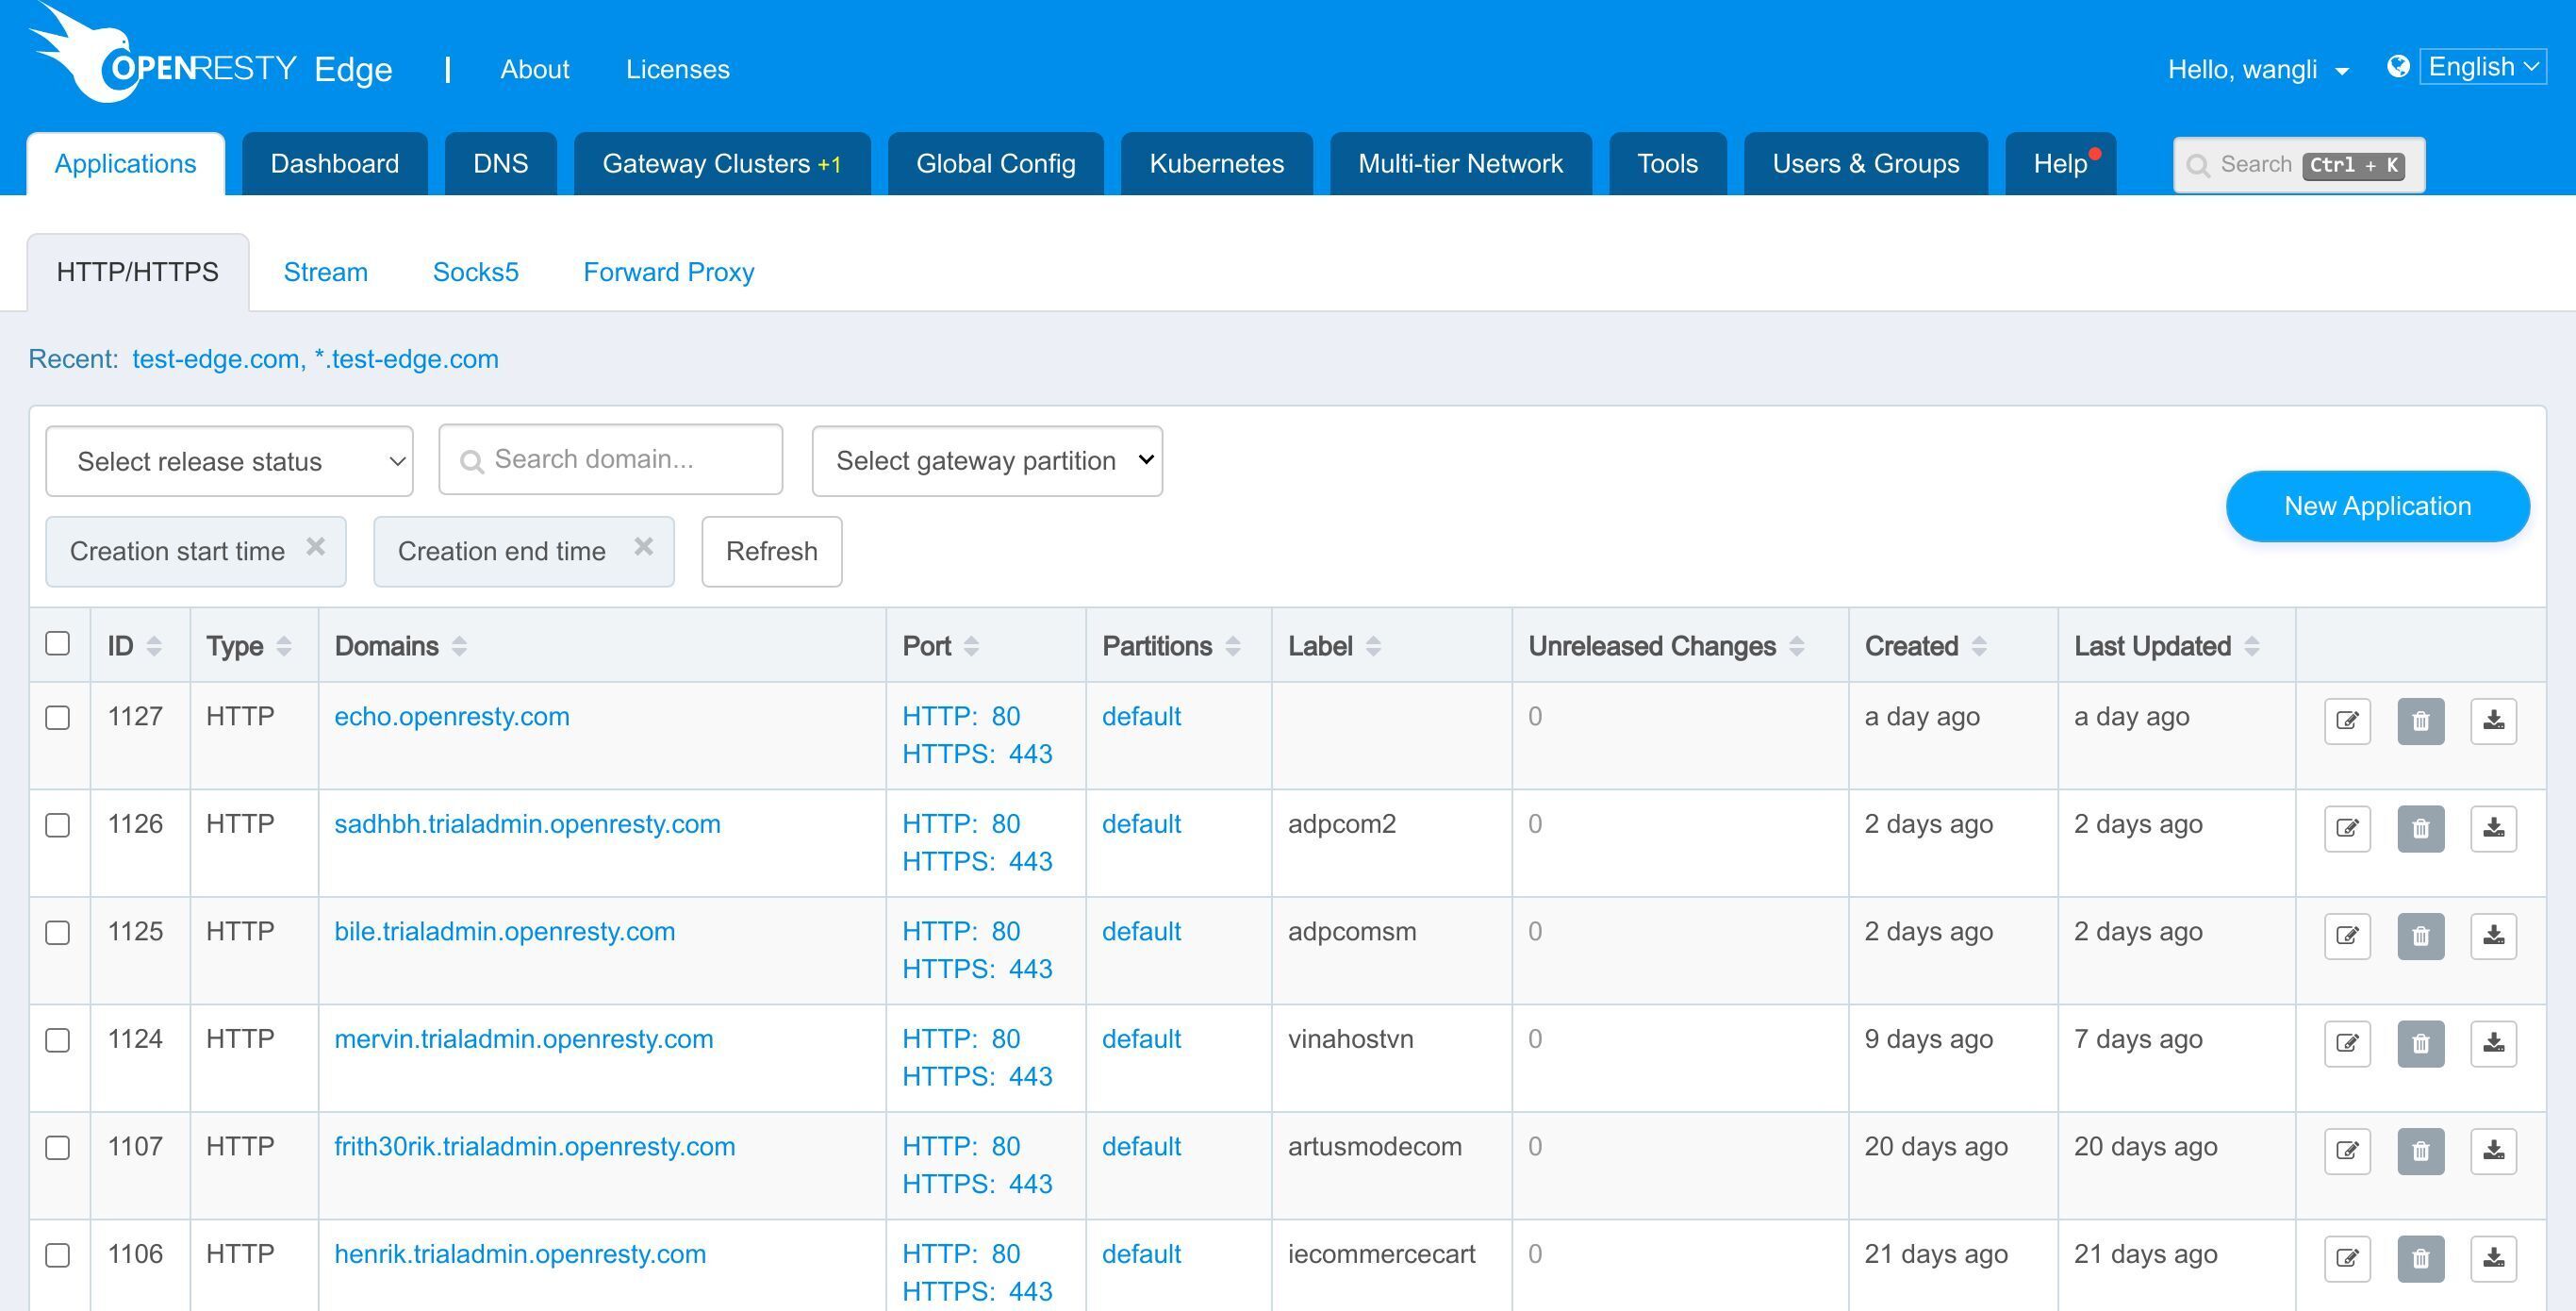
We can still use our continuing sample application, test-edge.com.
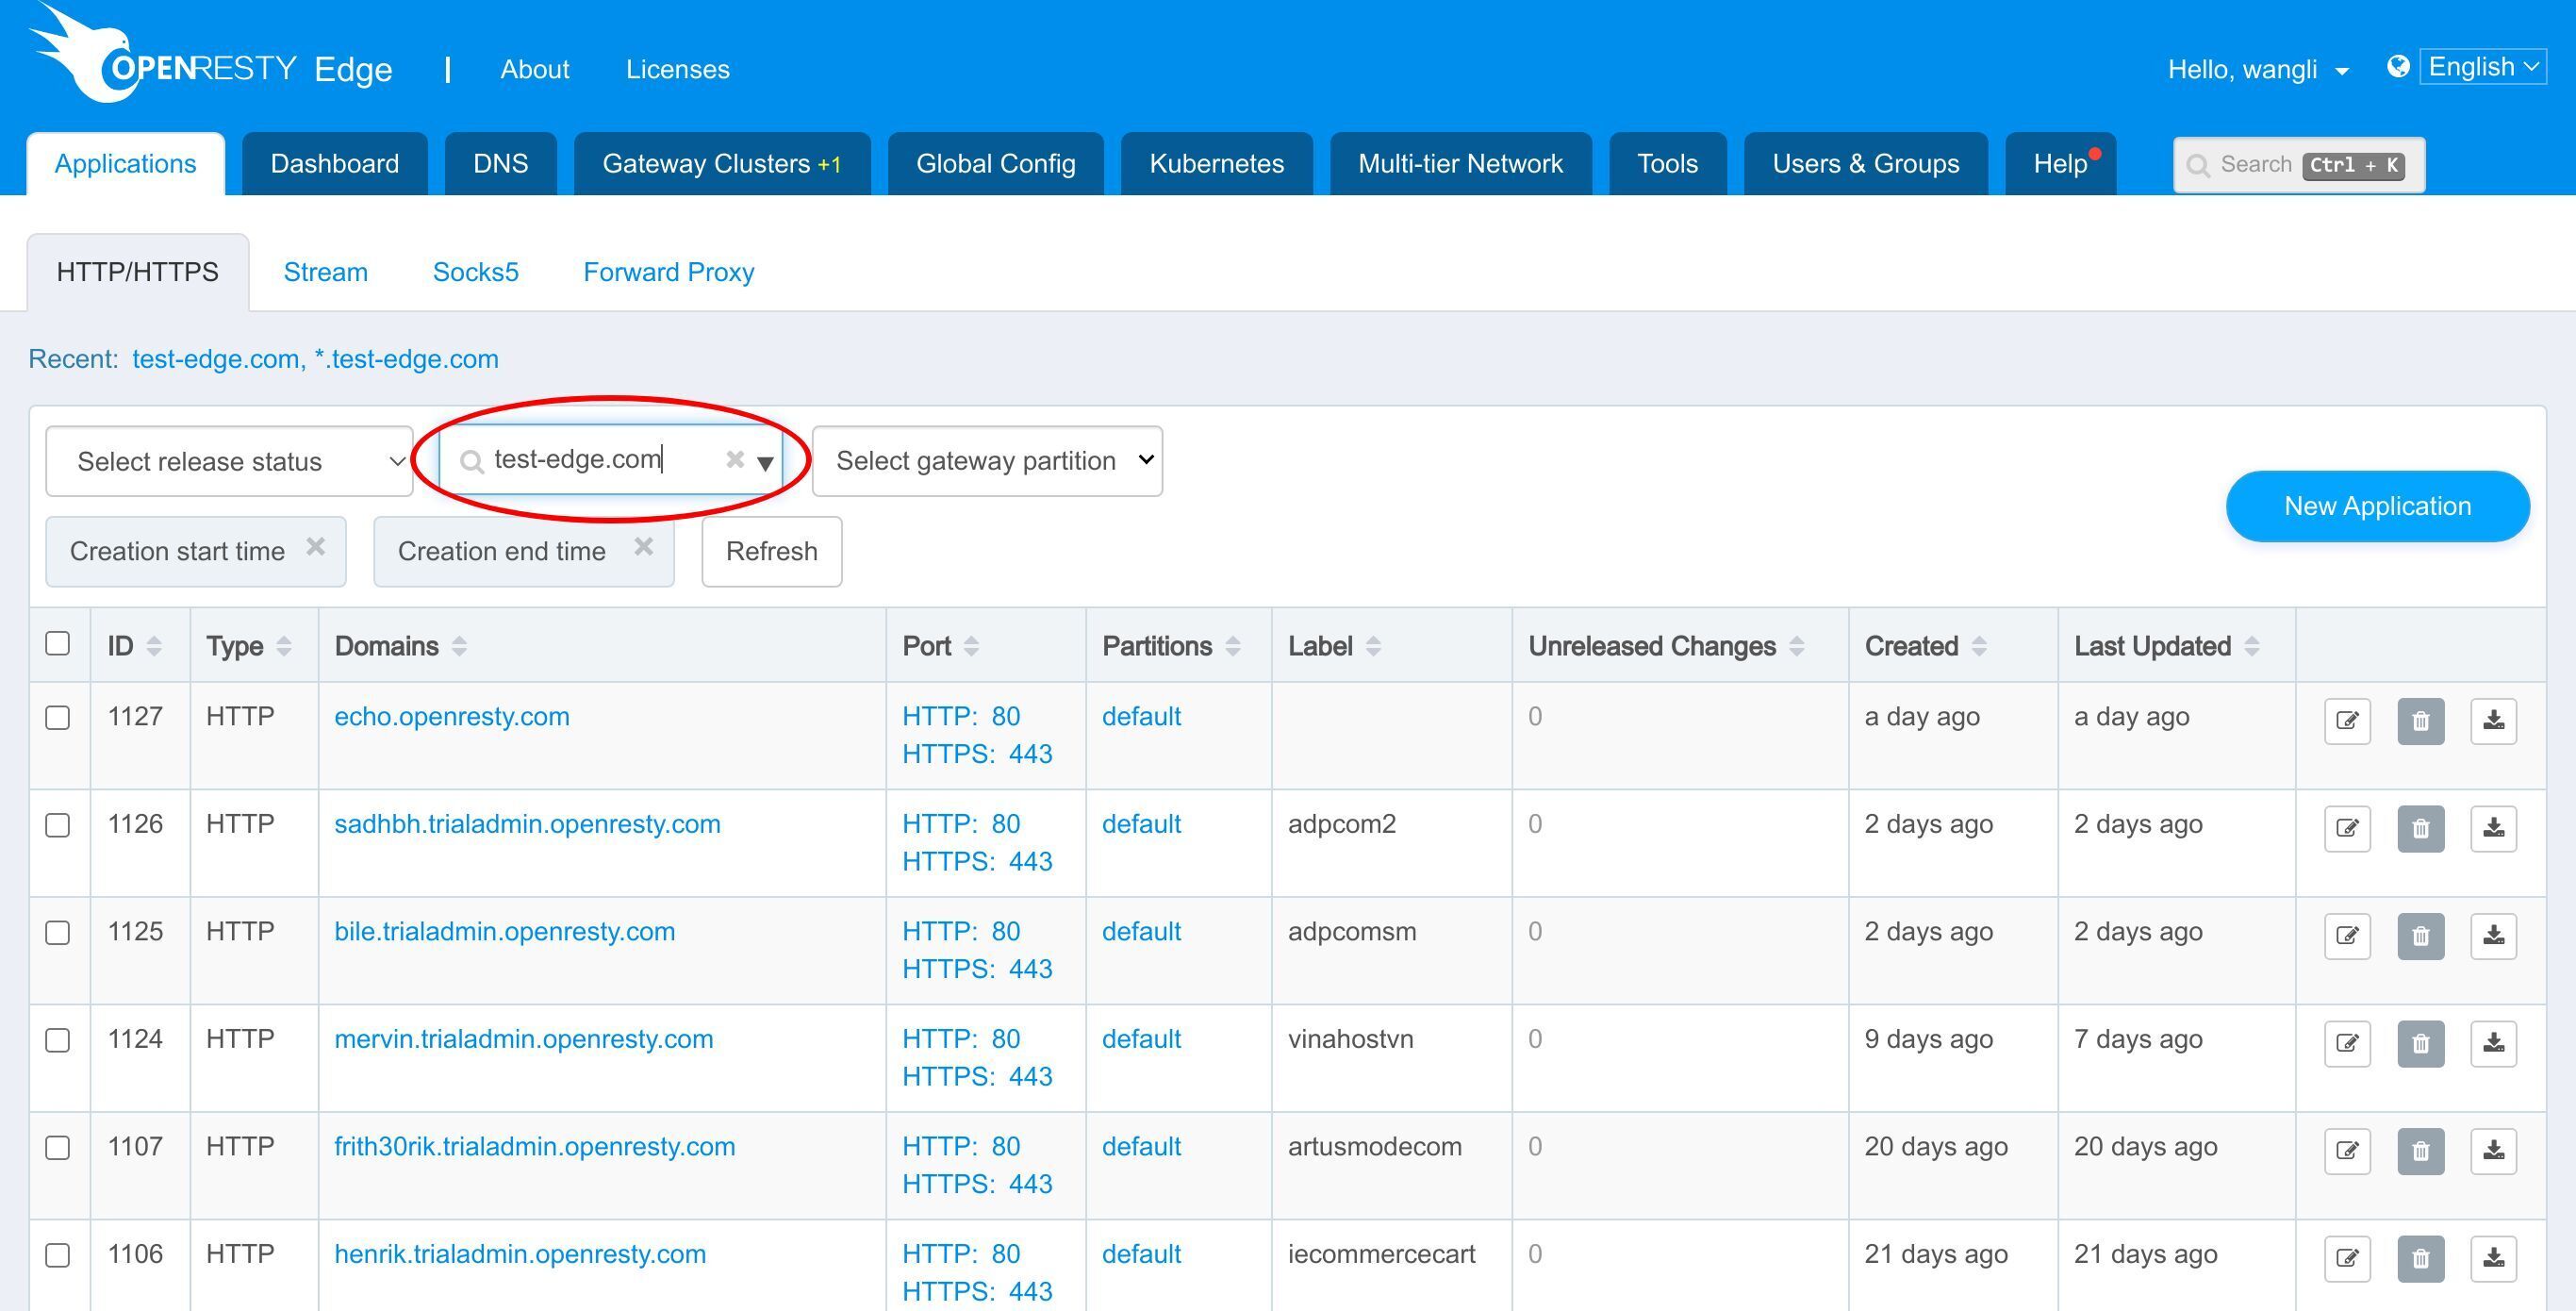
Let’s enter this application.
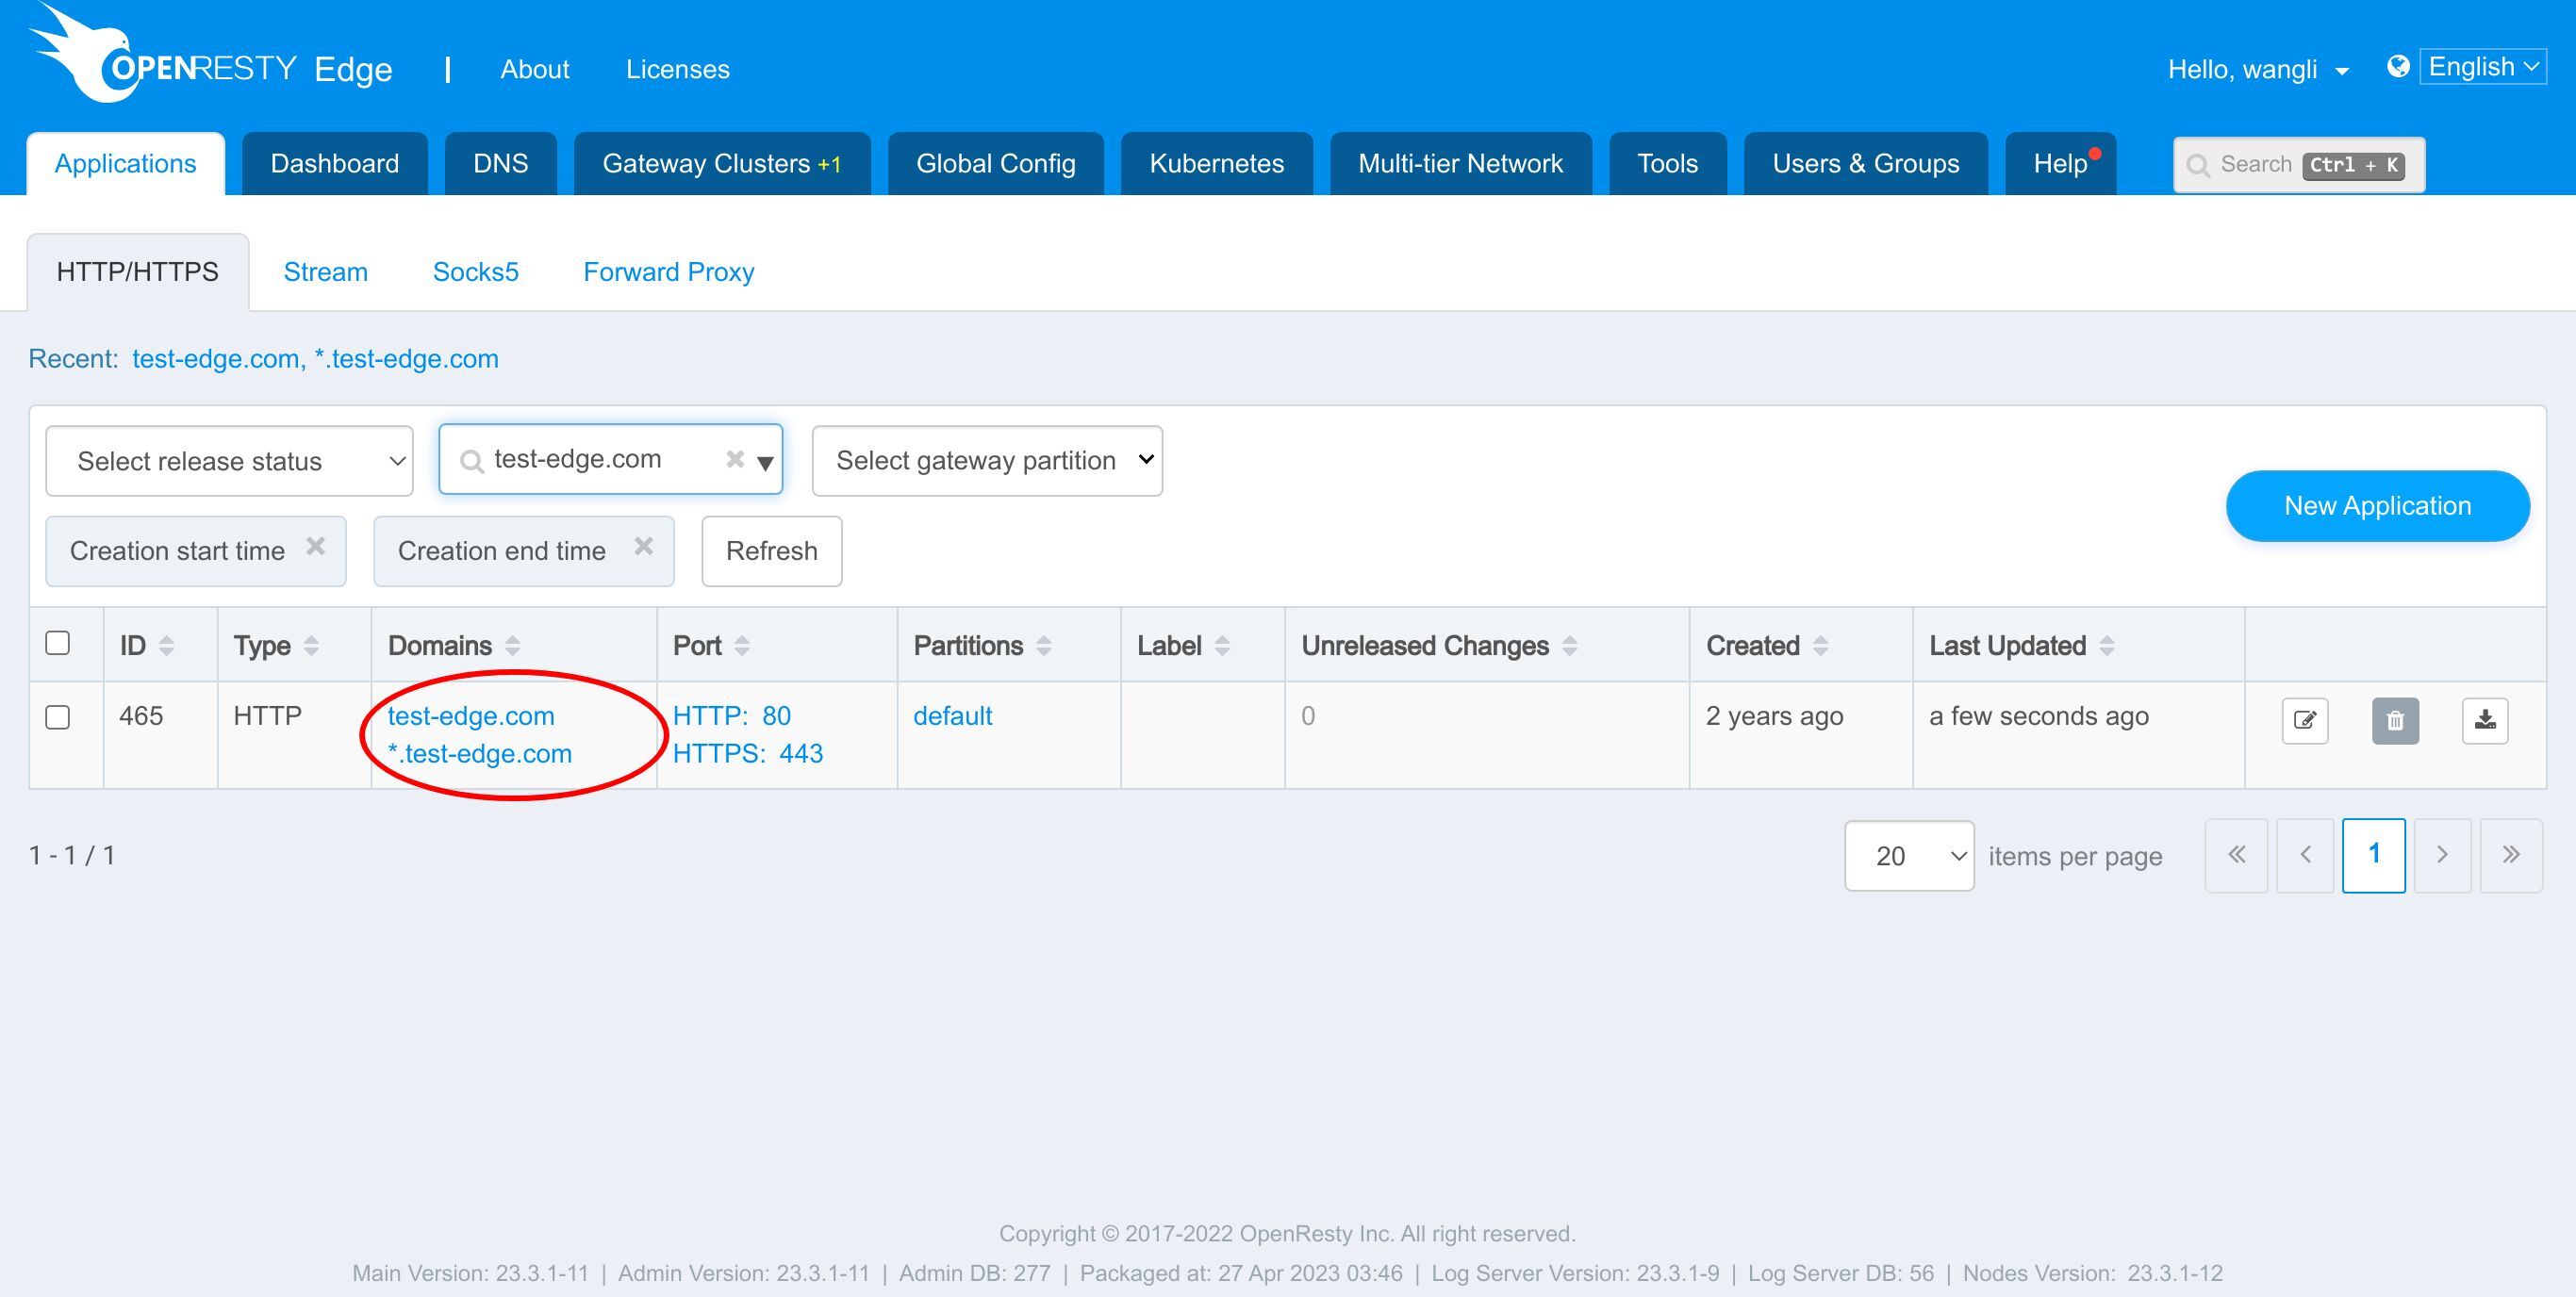
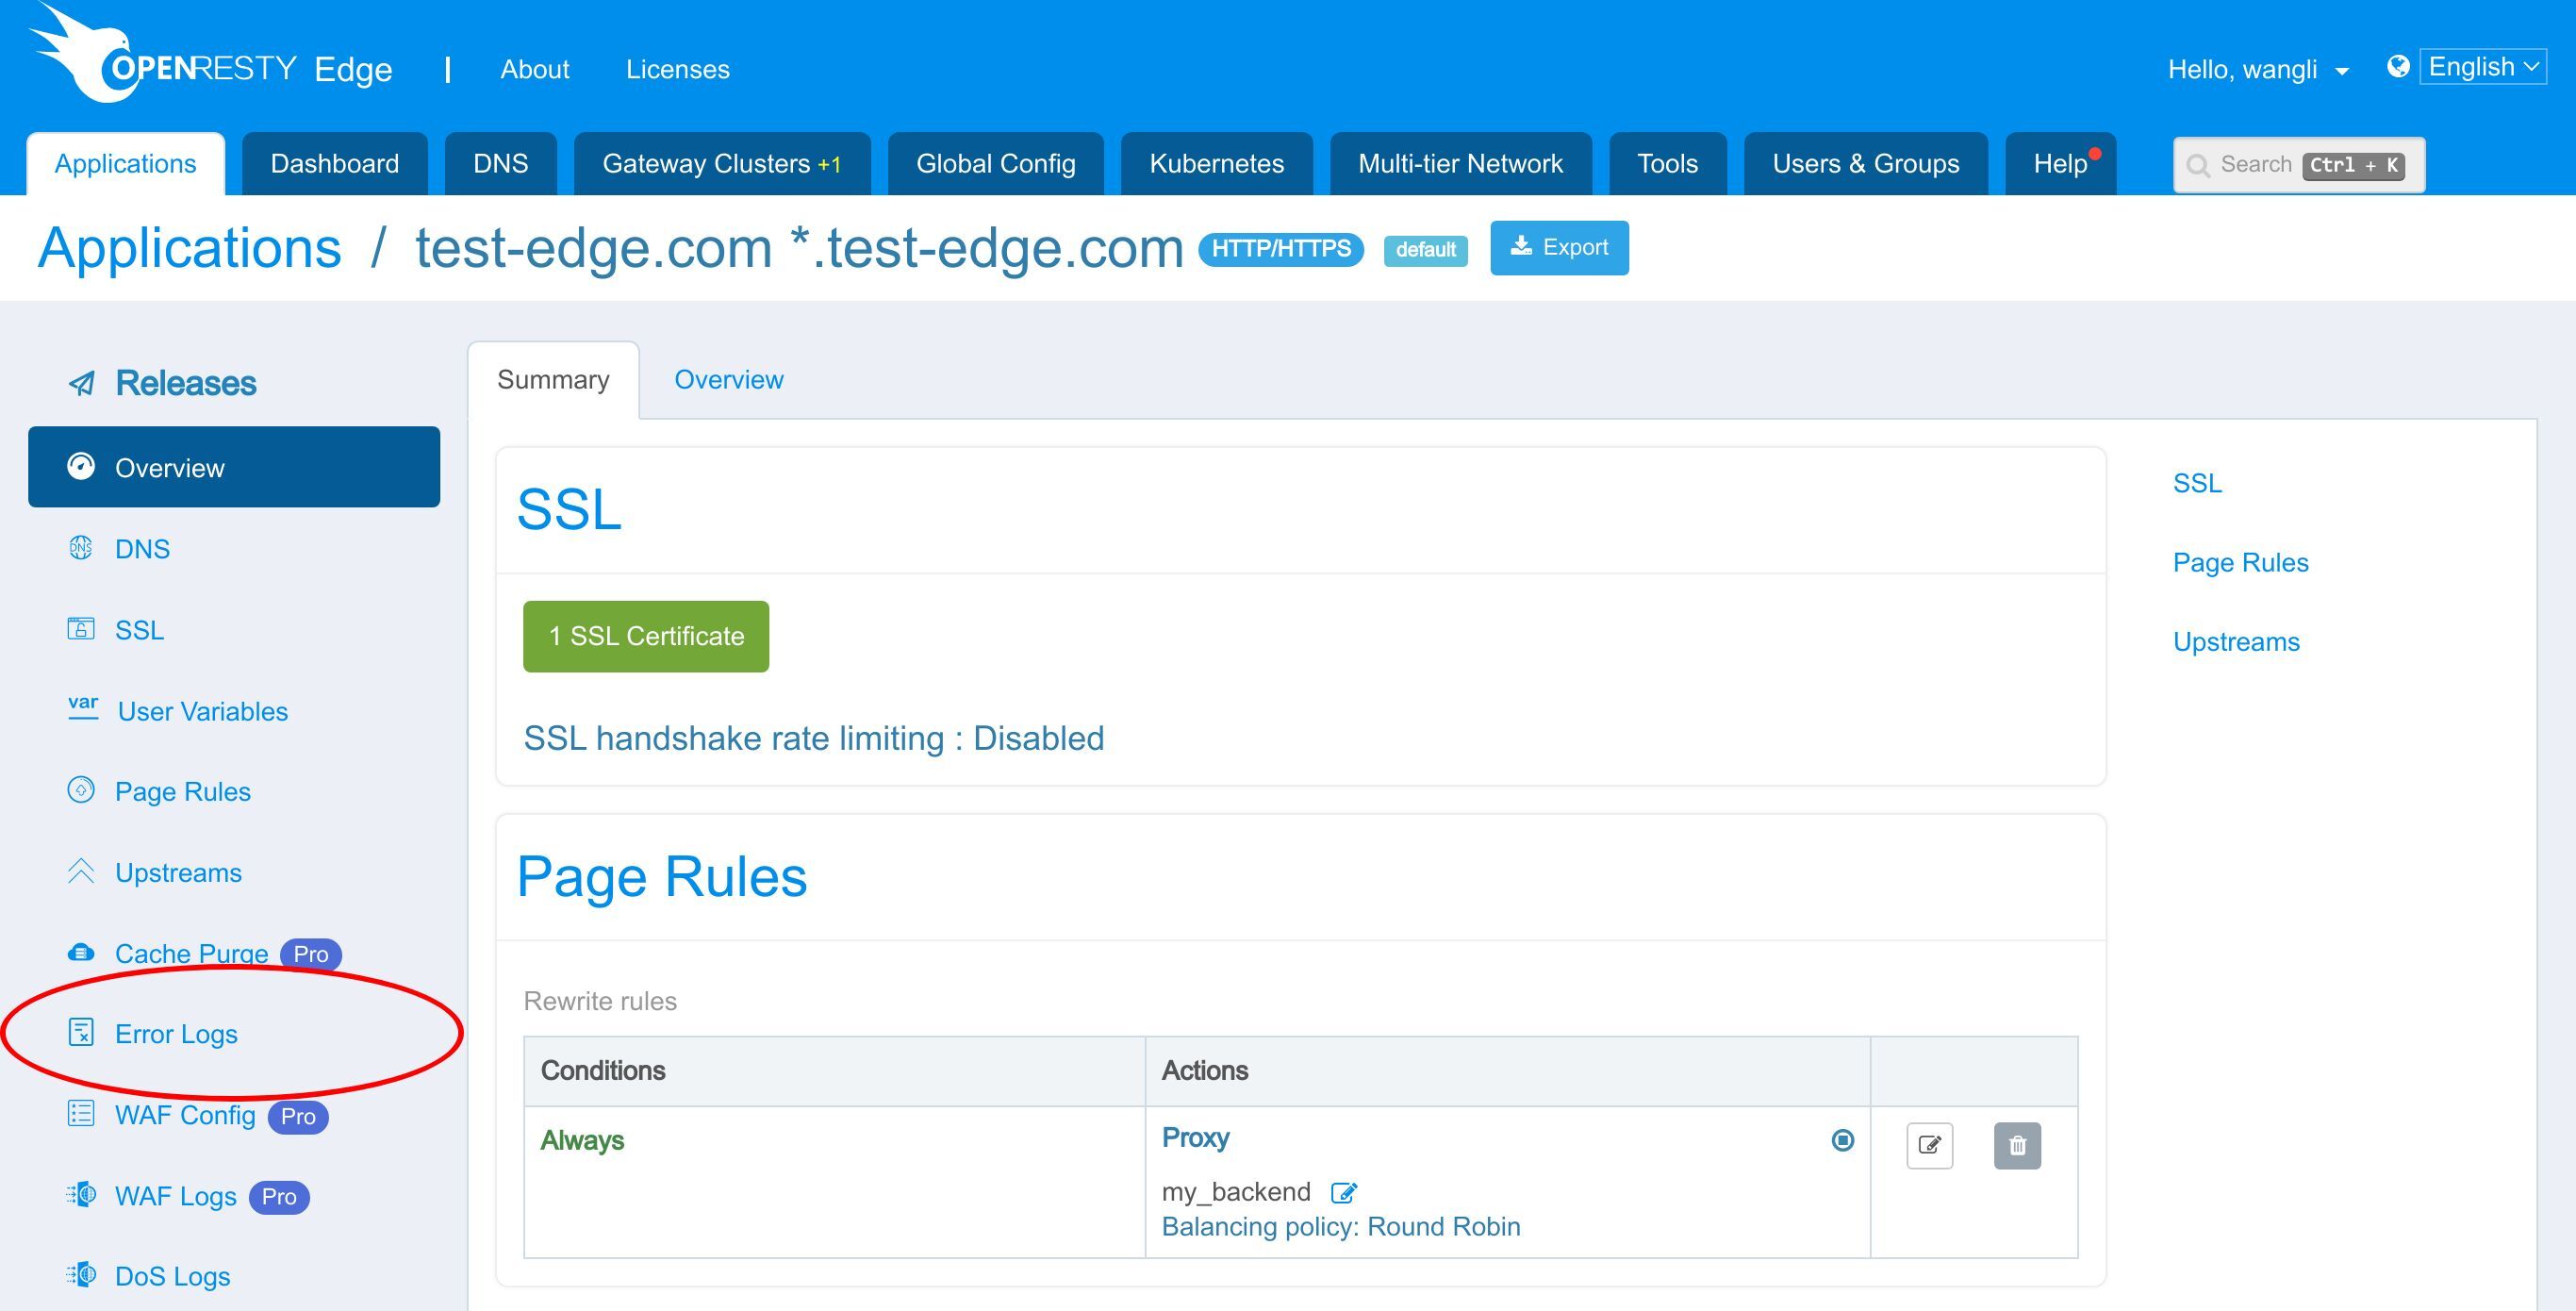
Click here to view the error logs of this application.
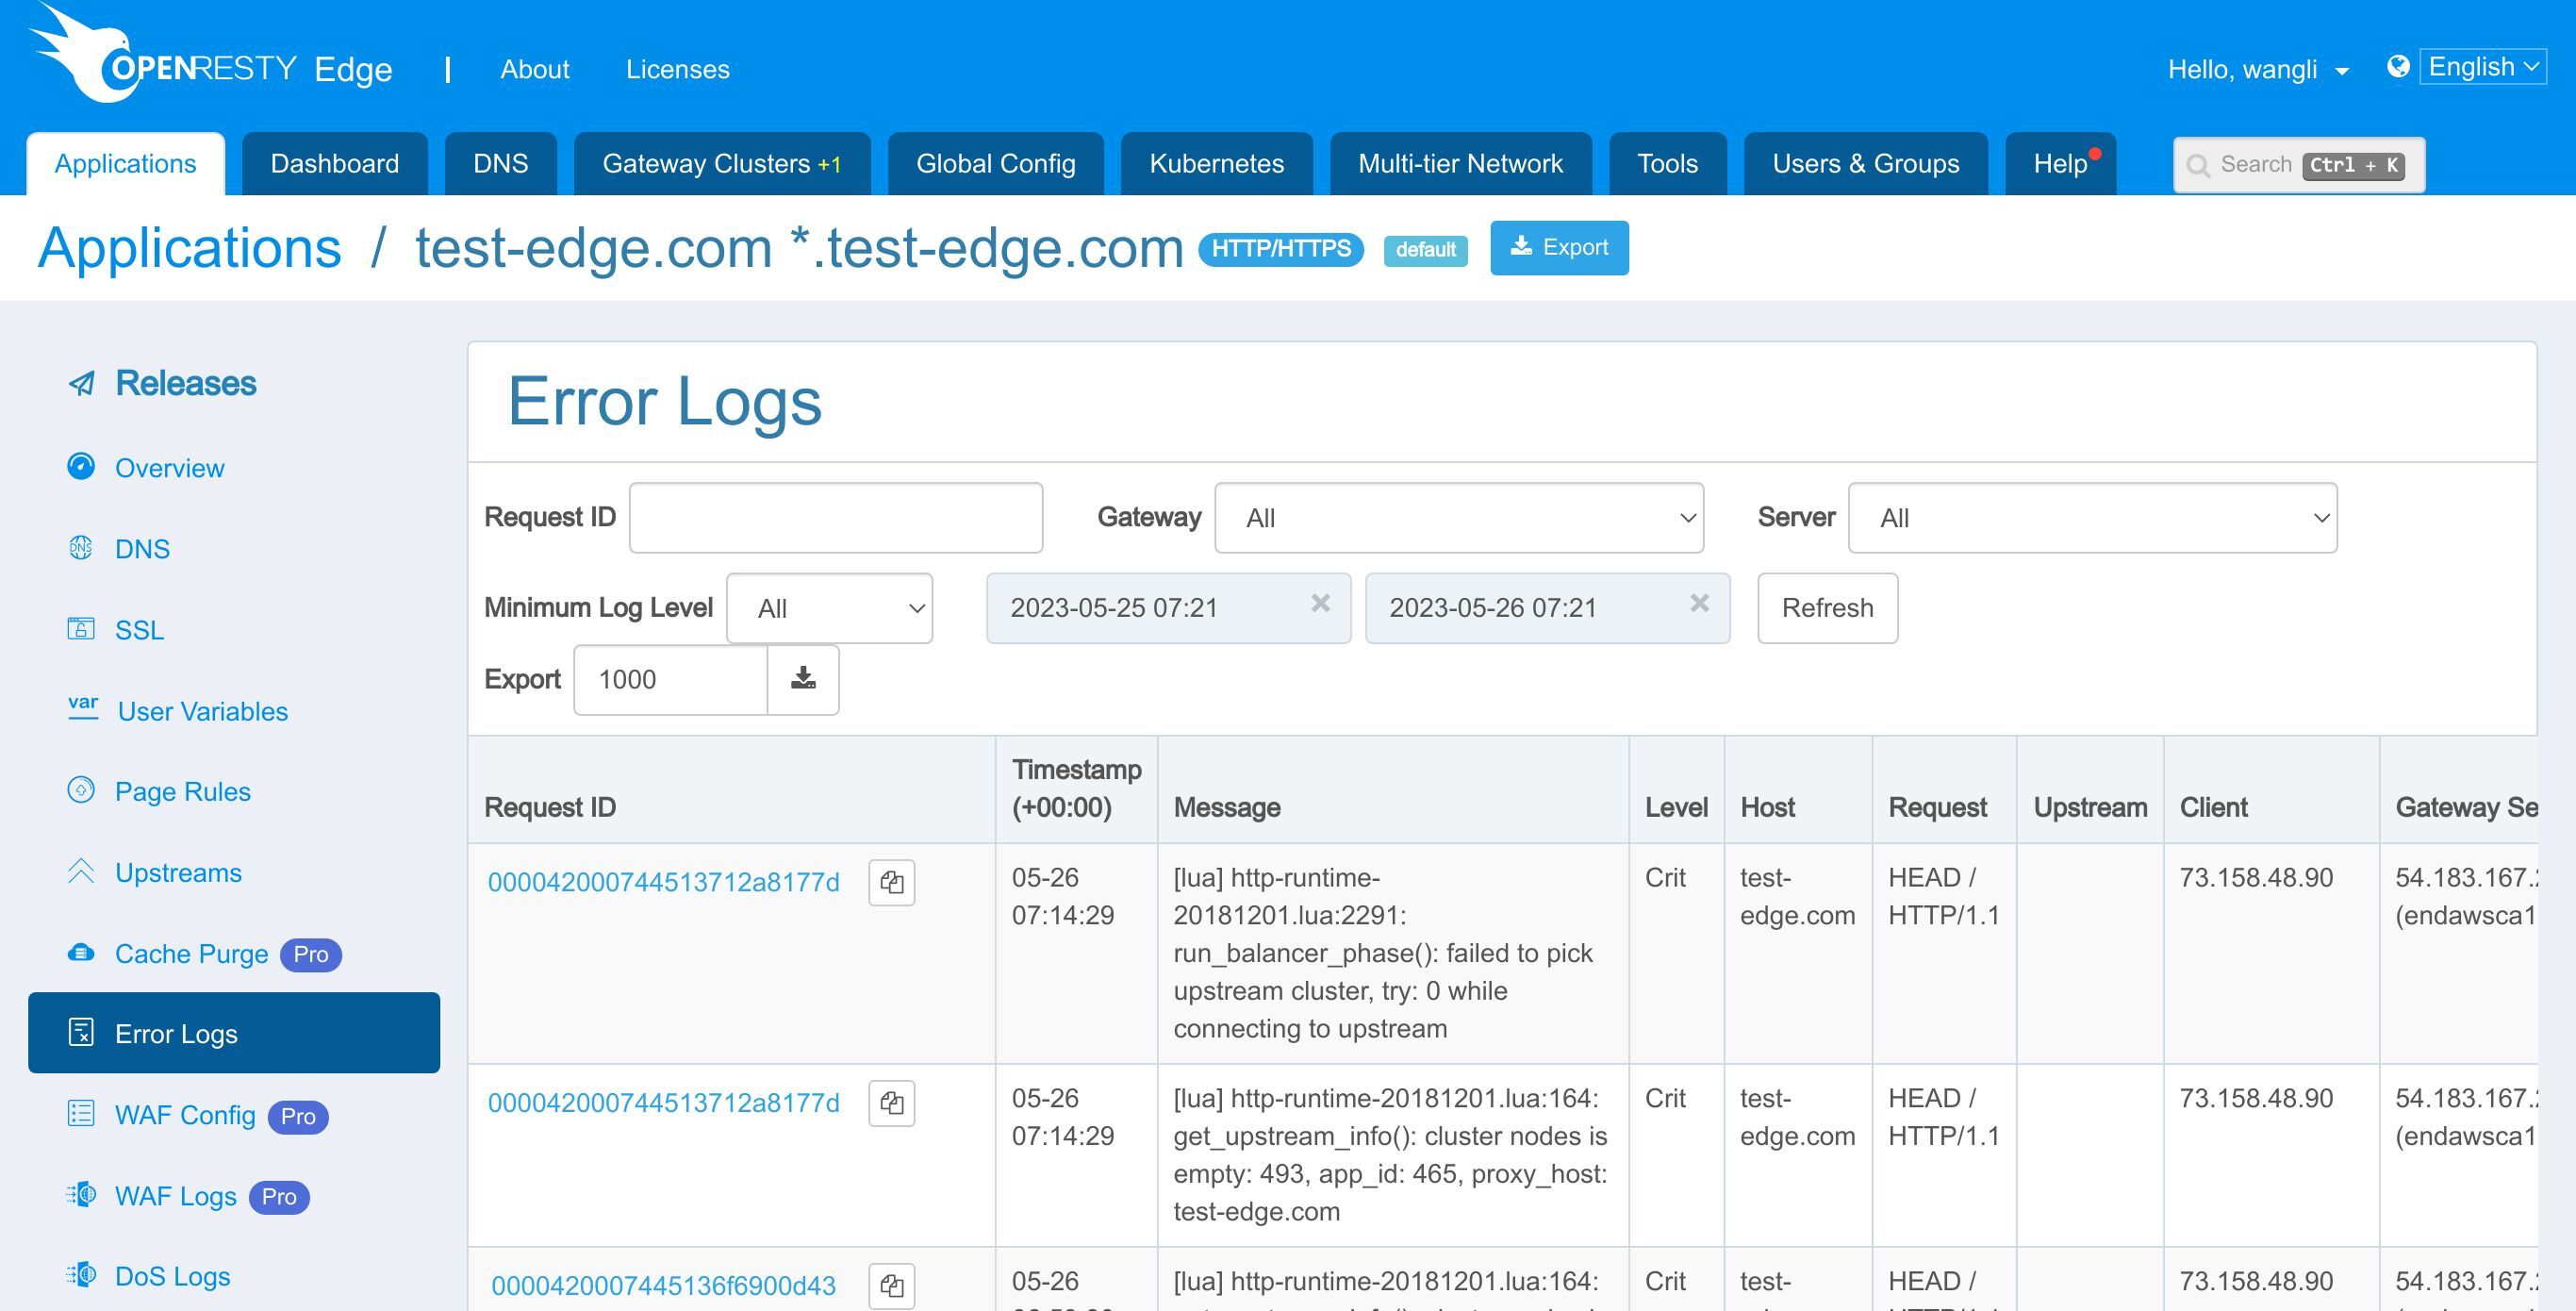
We can see that there are already some error logs recorded here. This page displays some important information about the error log.
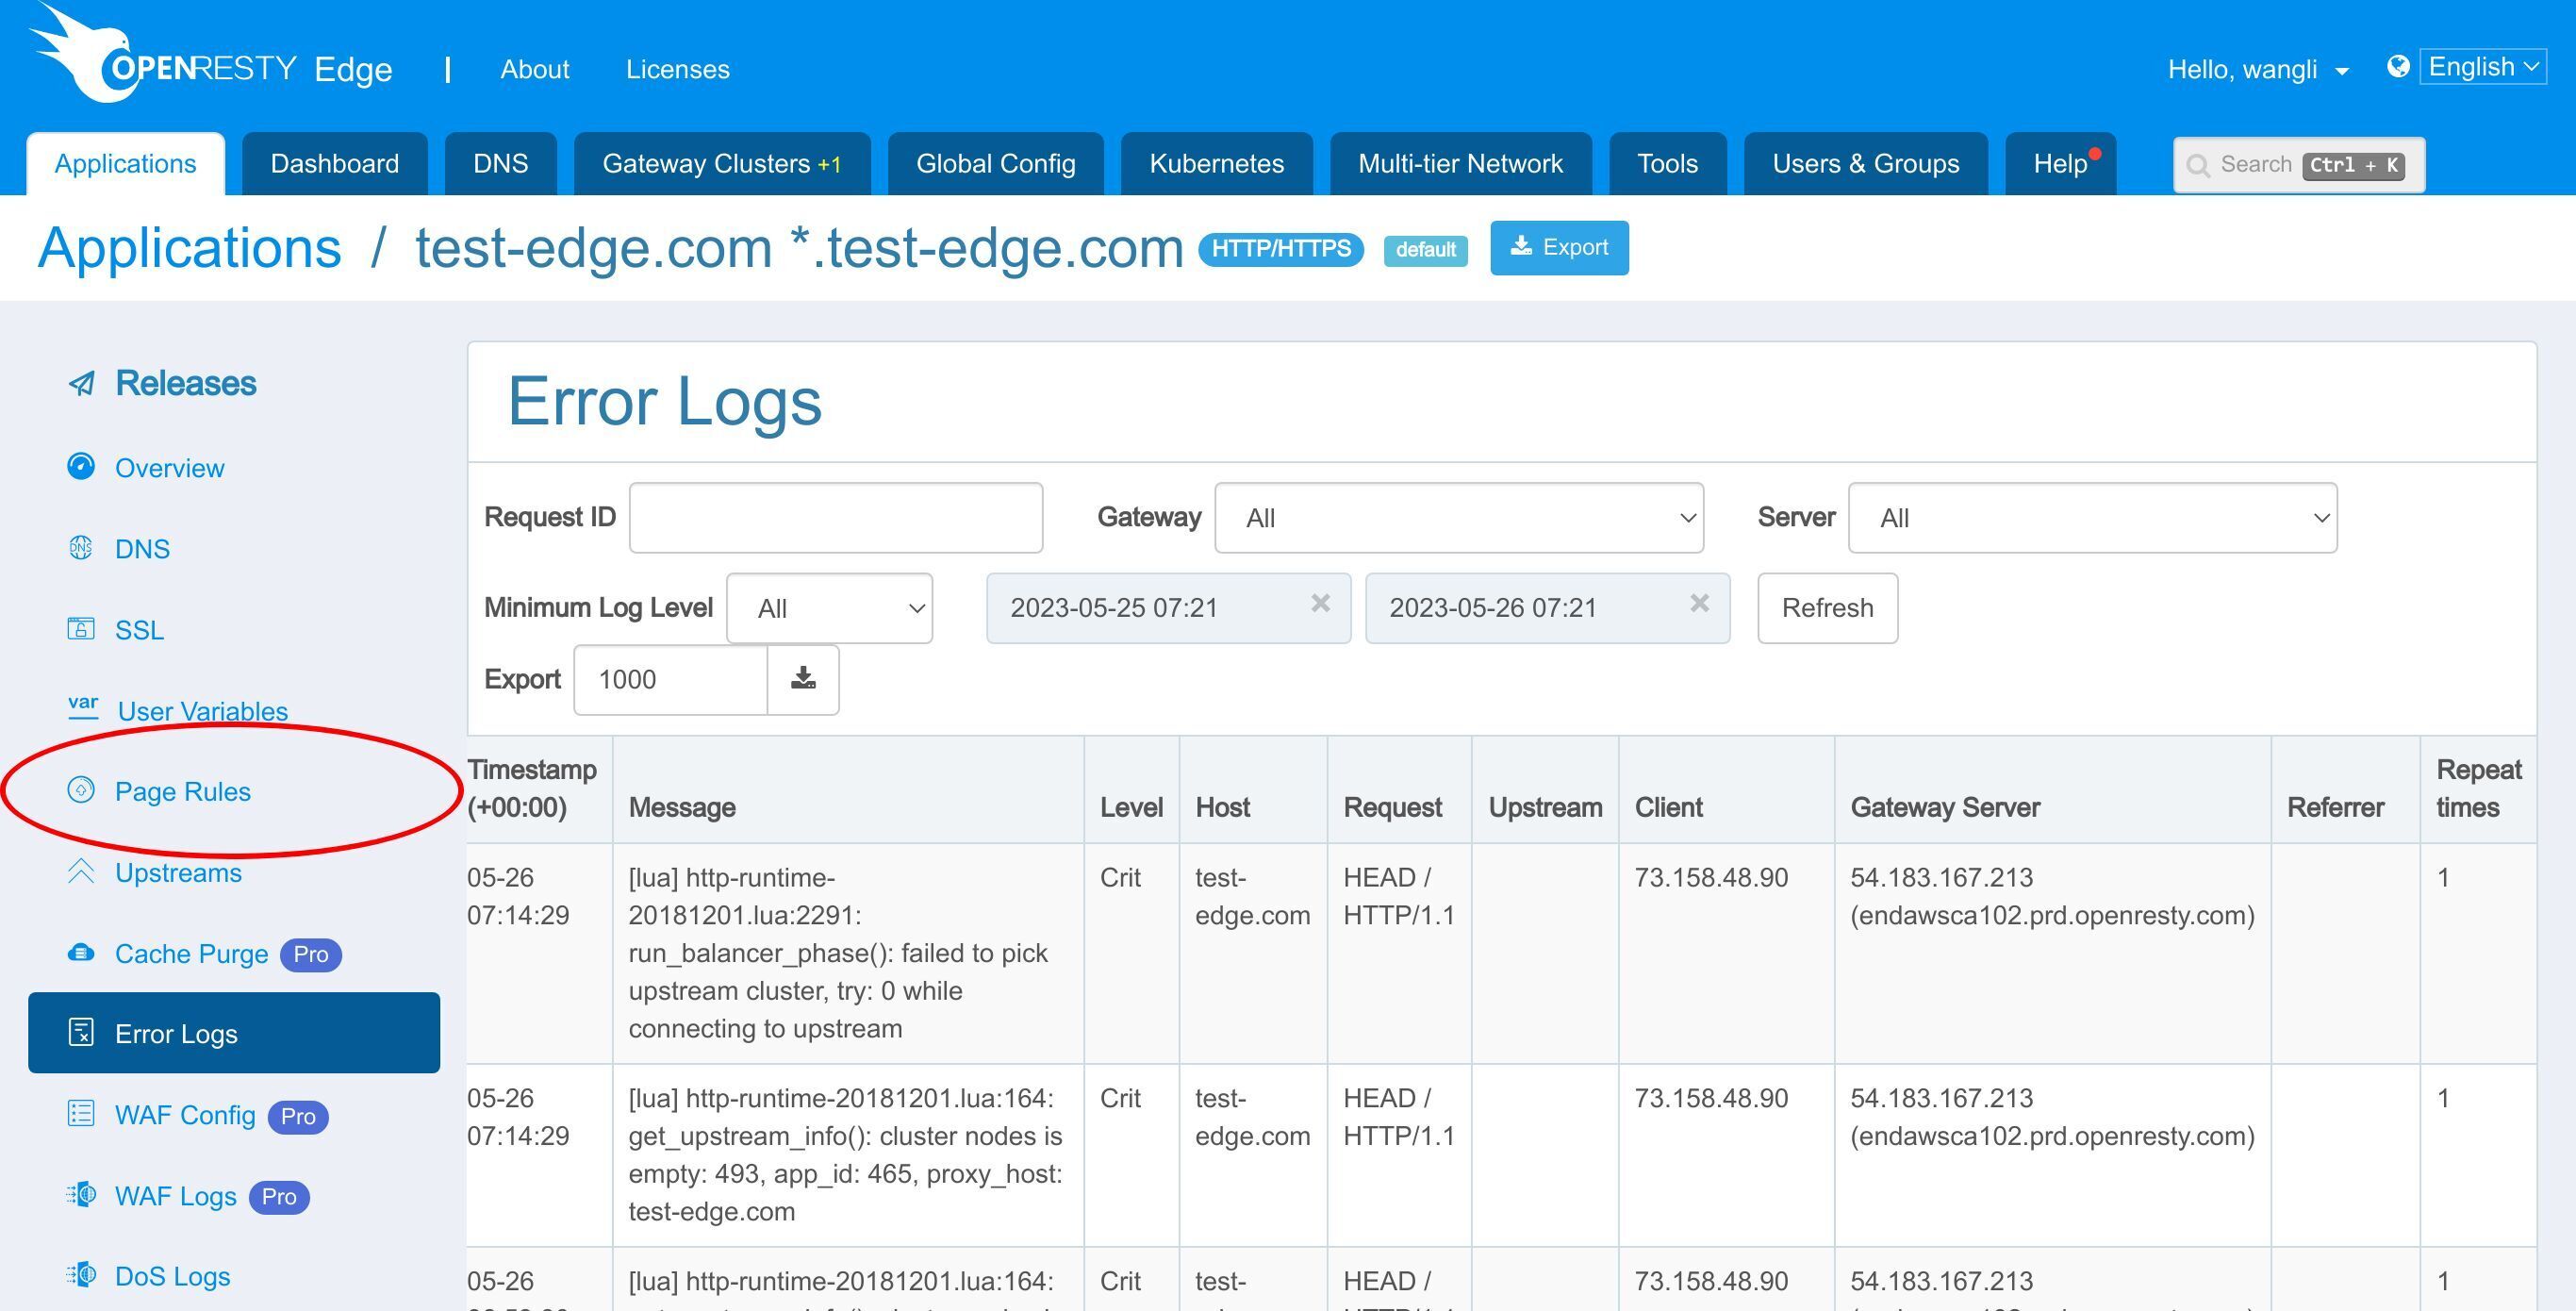
Such as Request ID, Error log message, Host name, Request body, Client IP addresses, etc.
Let’s make some changes for test-edge.com and visit the domain to generate a new error log message.
We already have a page rule defined.
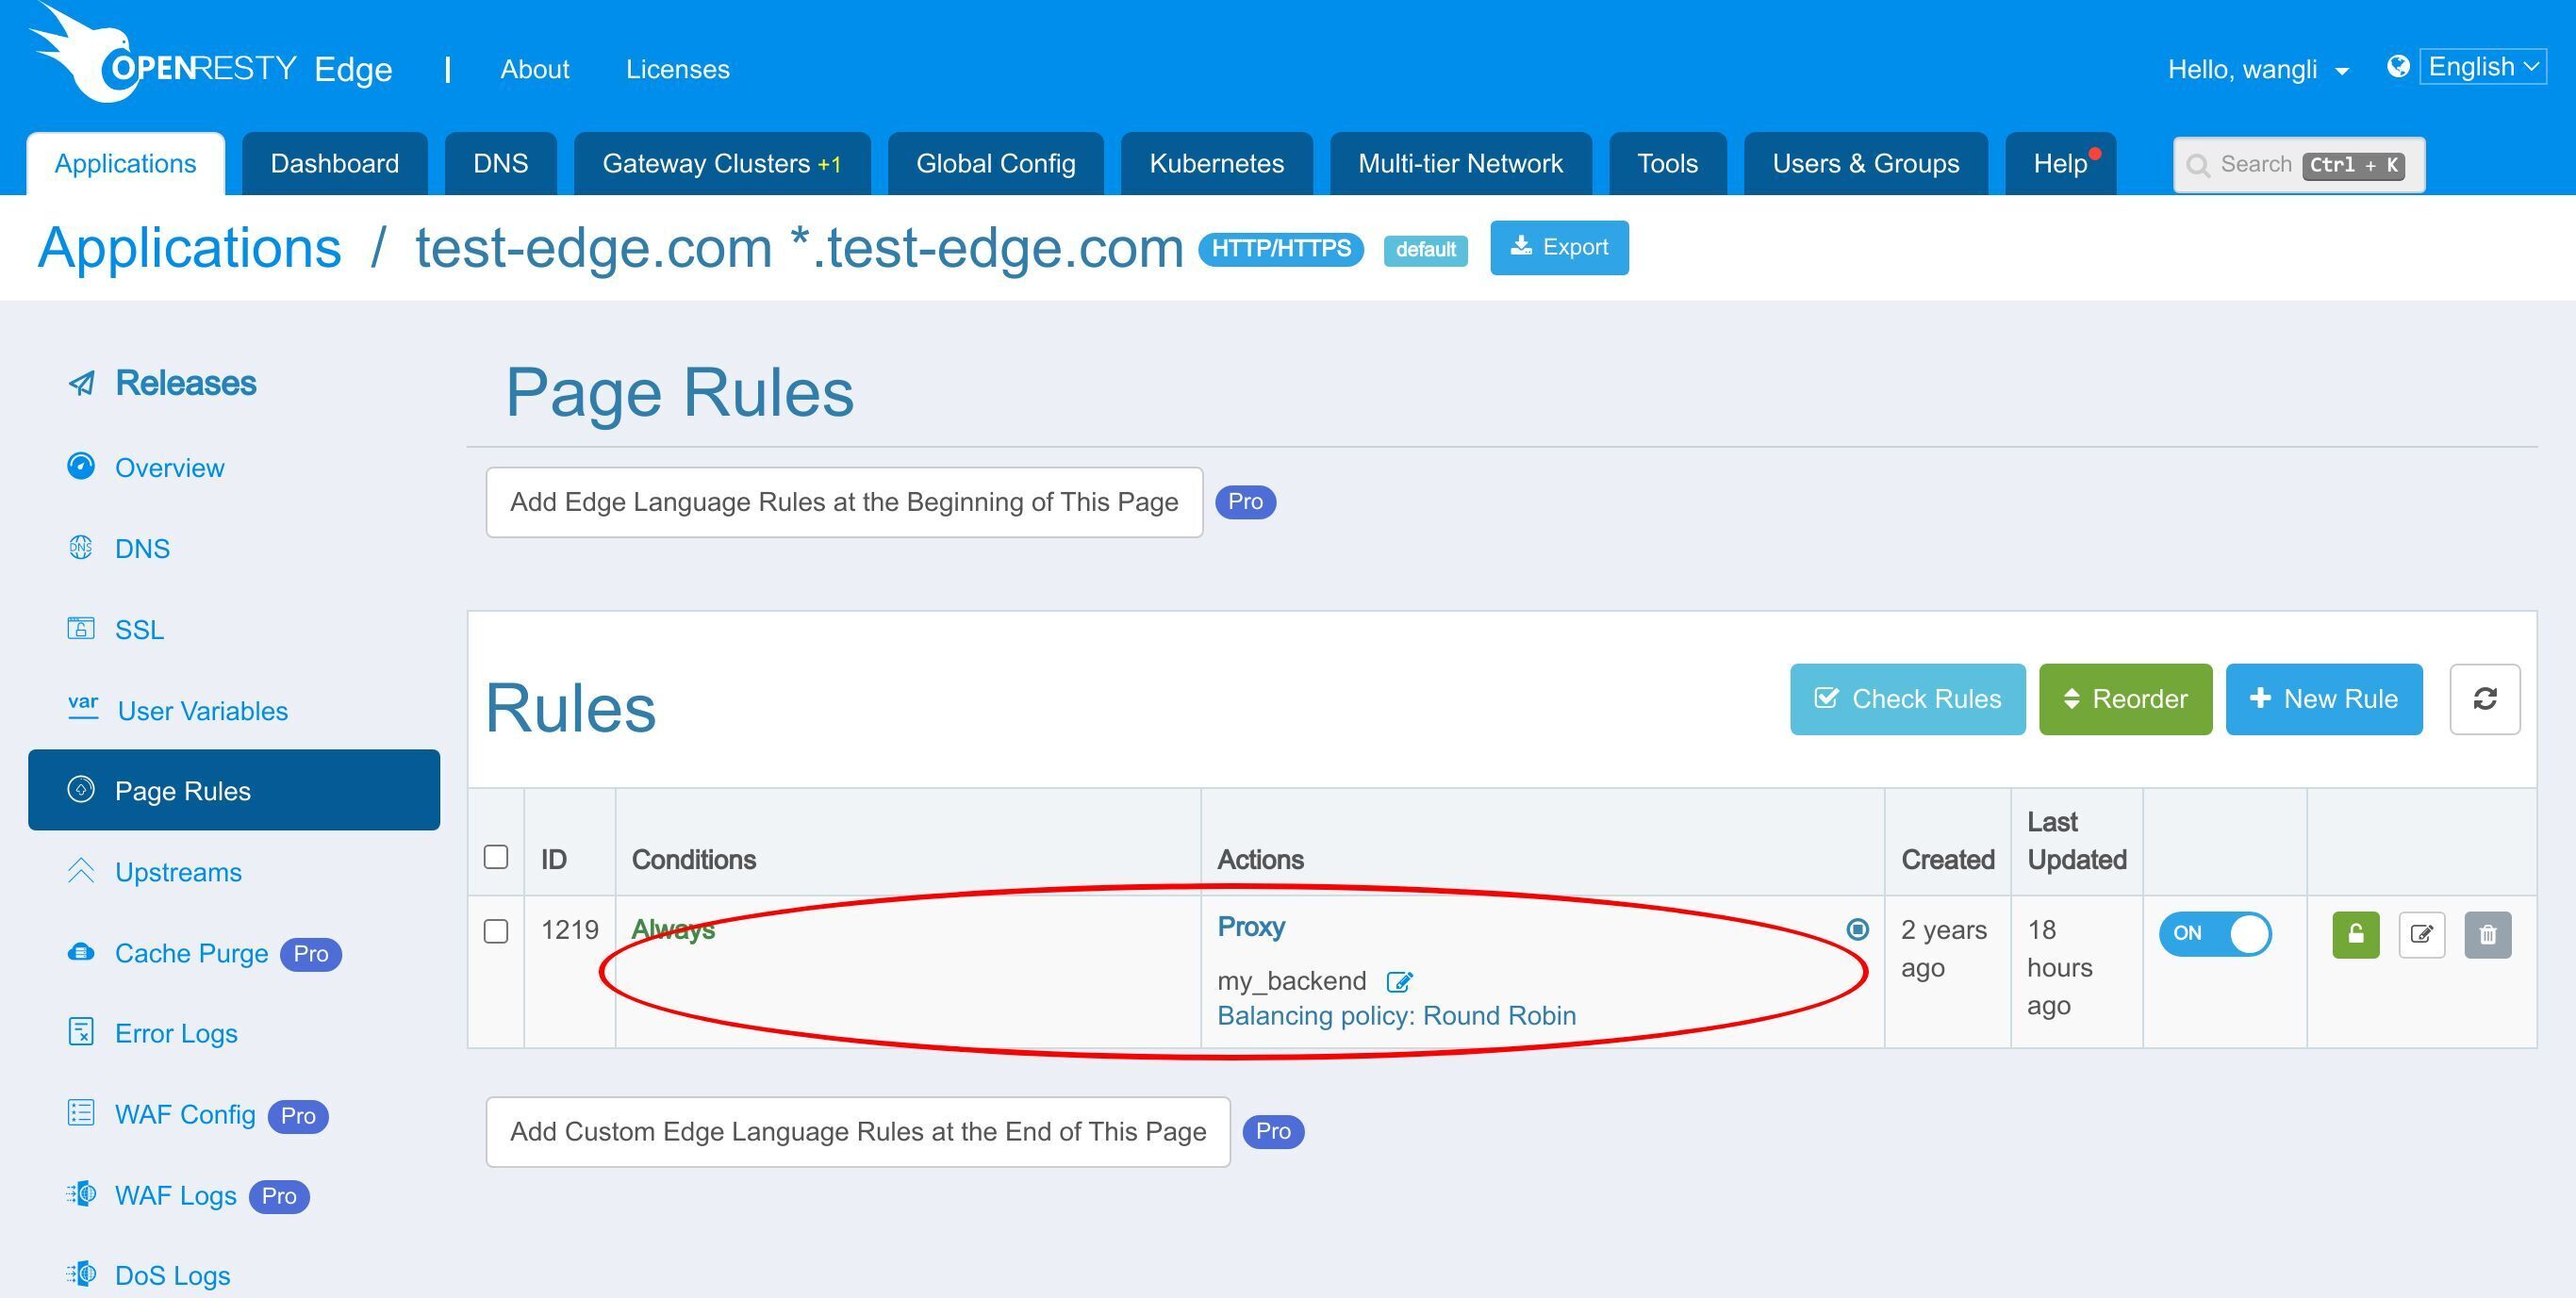
This page rule sets up a reverse proxy to a pre-defined upstream.
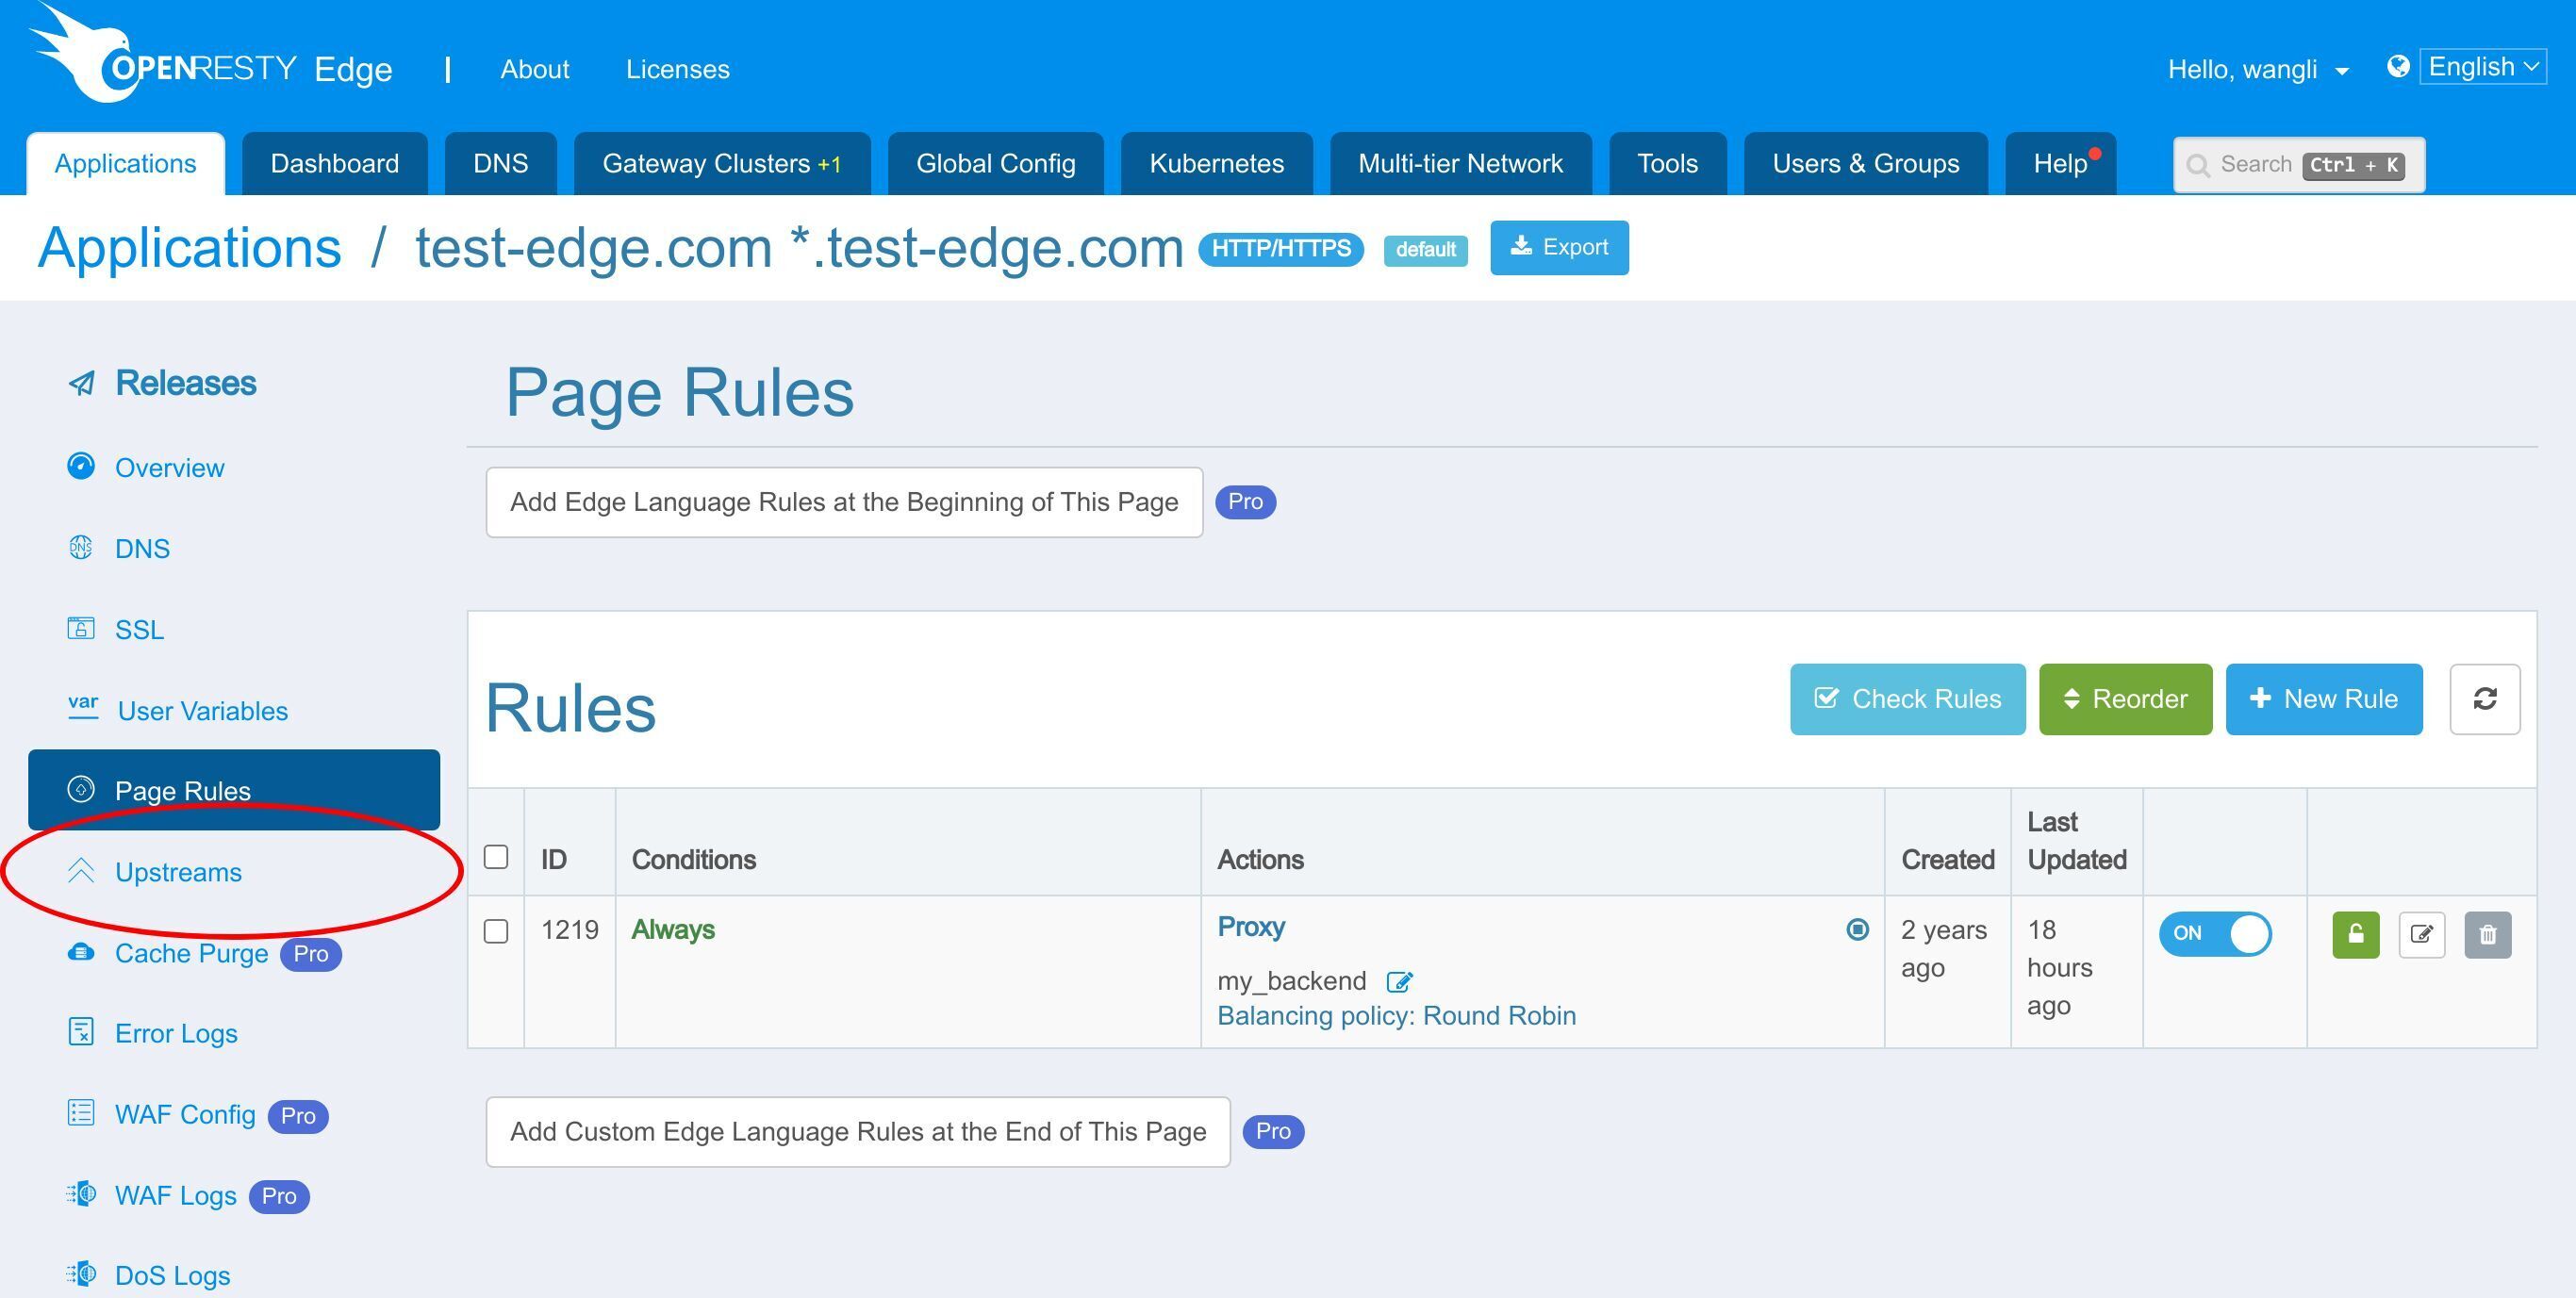
Let’s go to the upstream page.
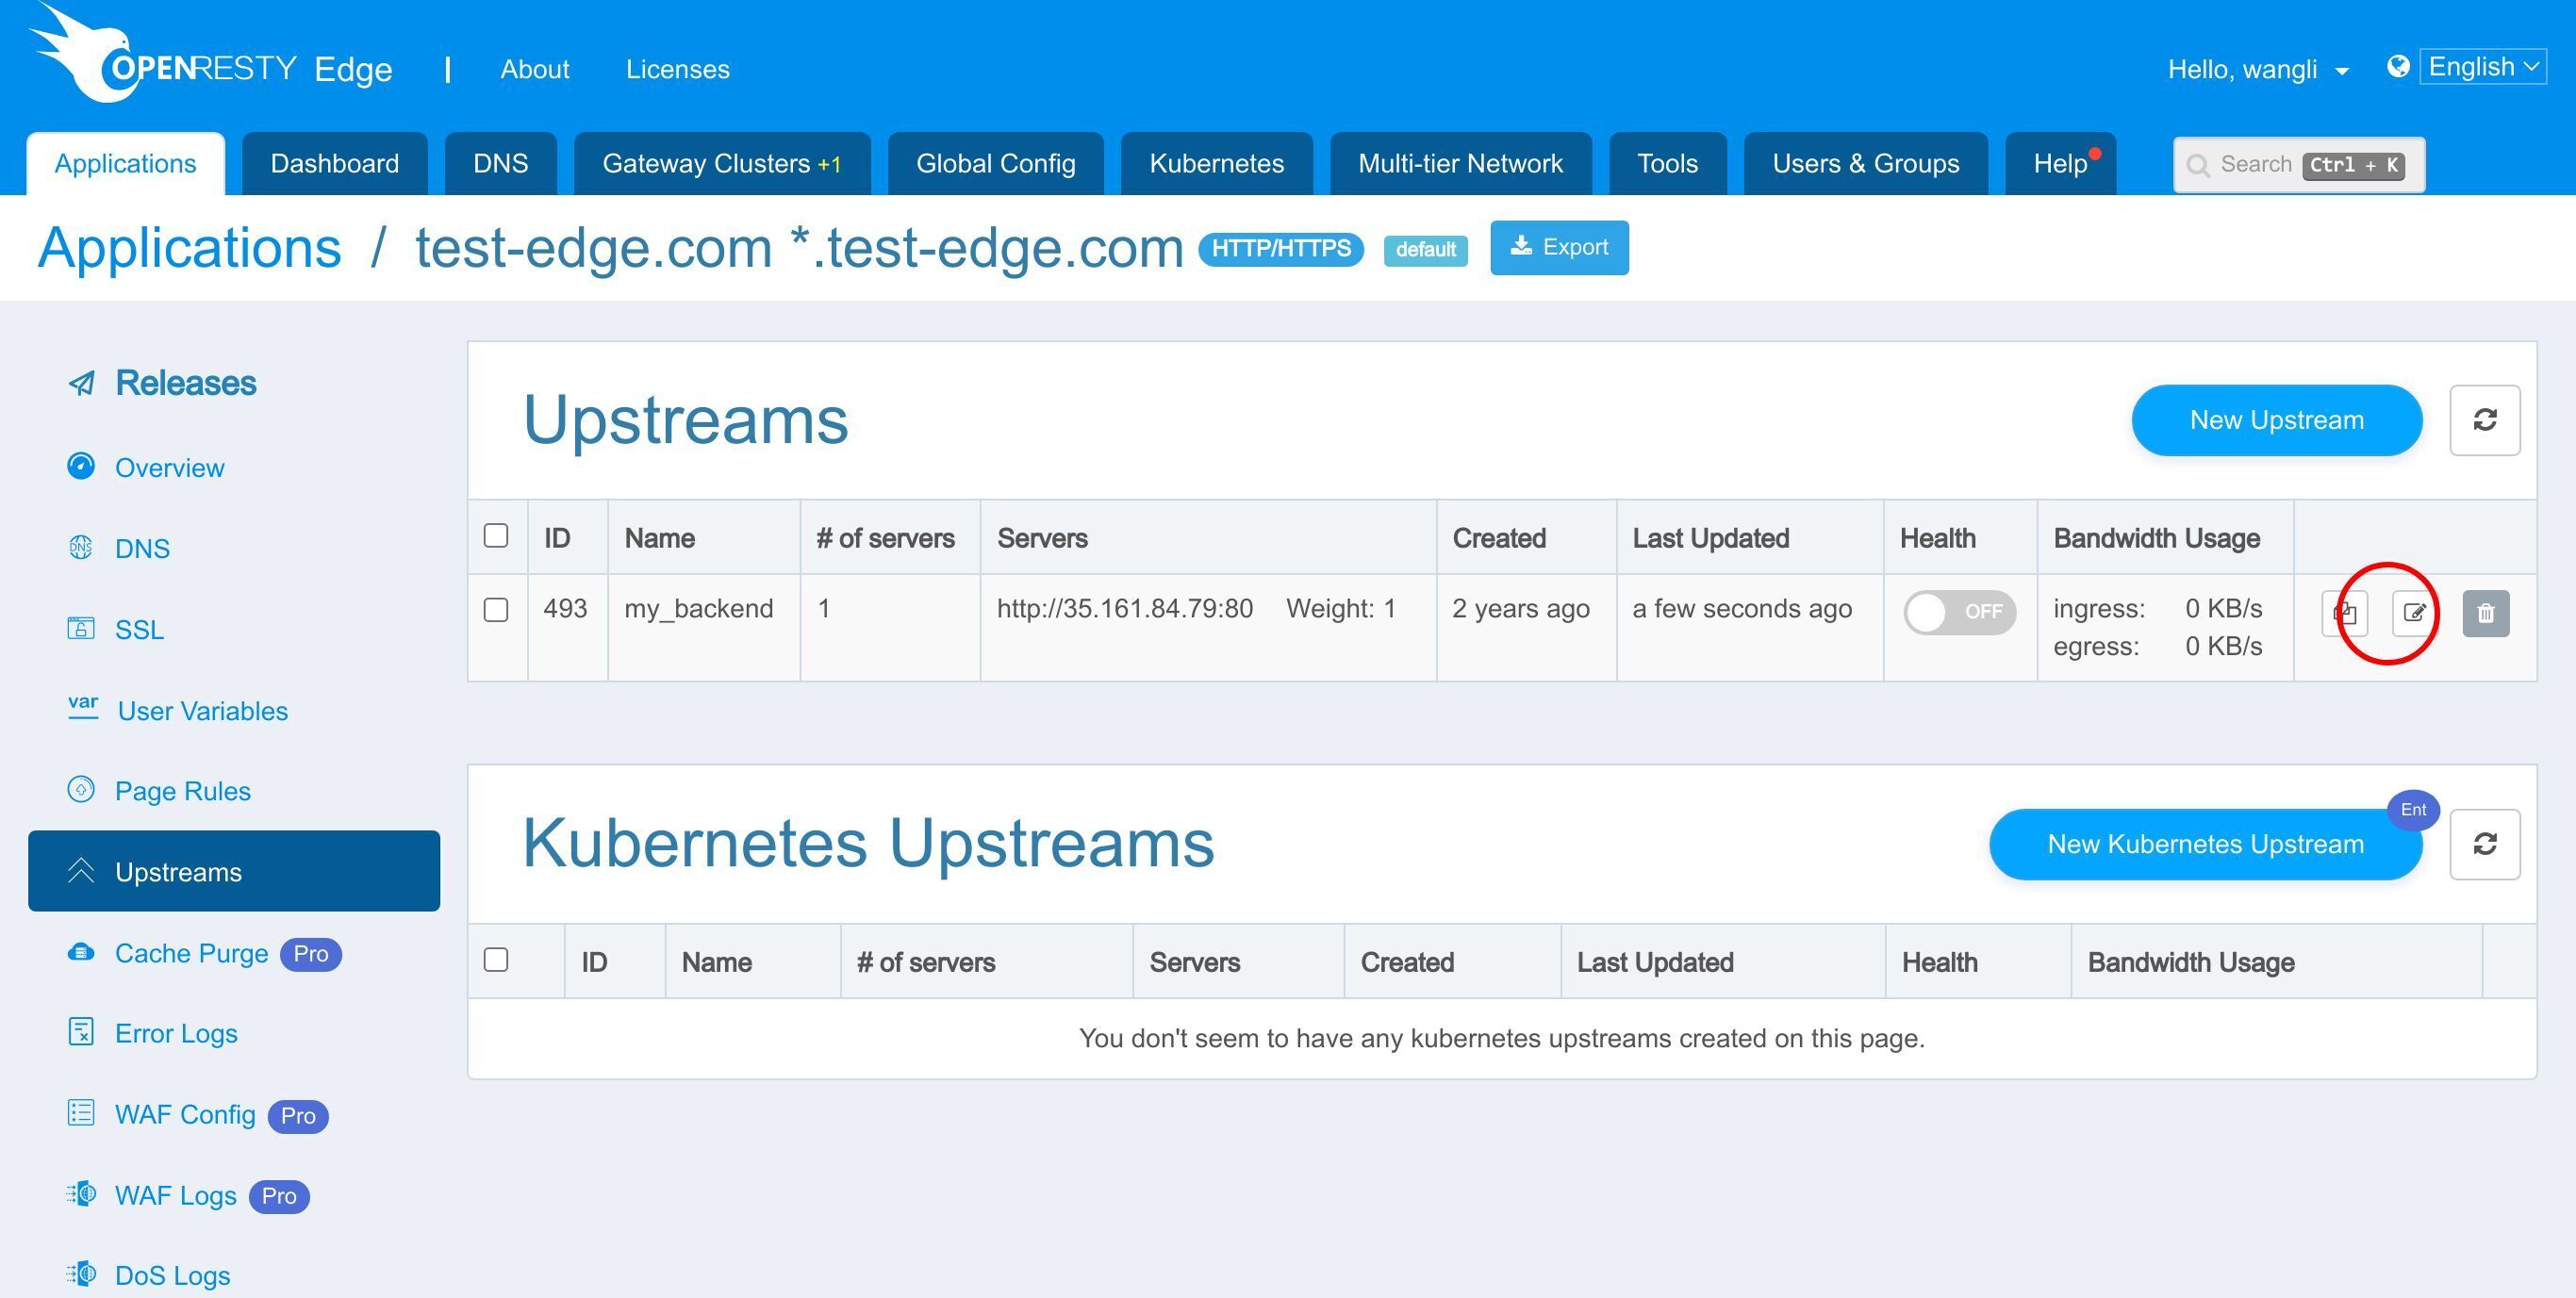
Let’s edit the upstream server.
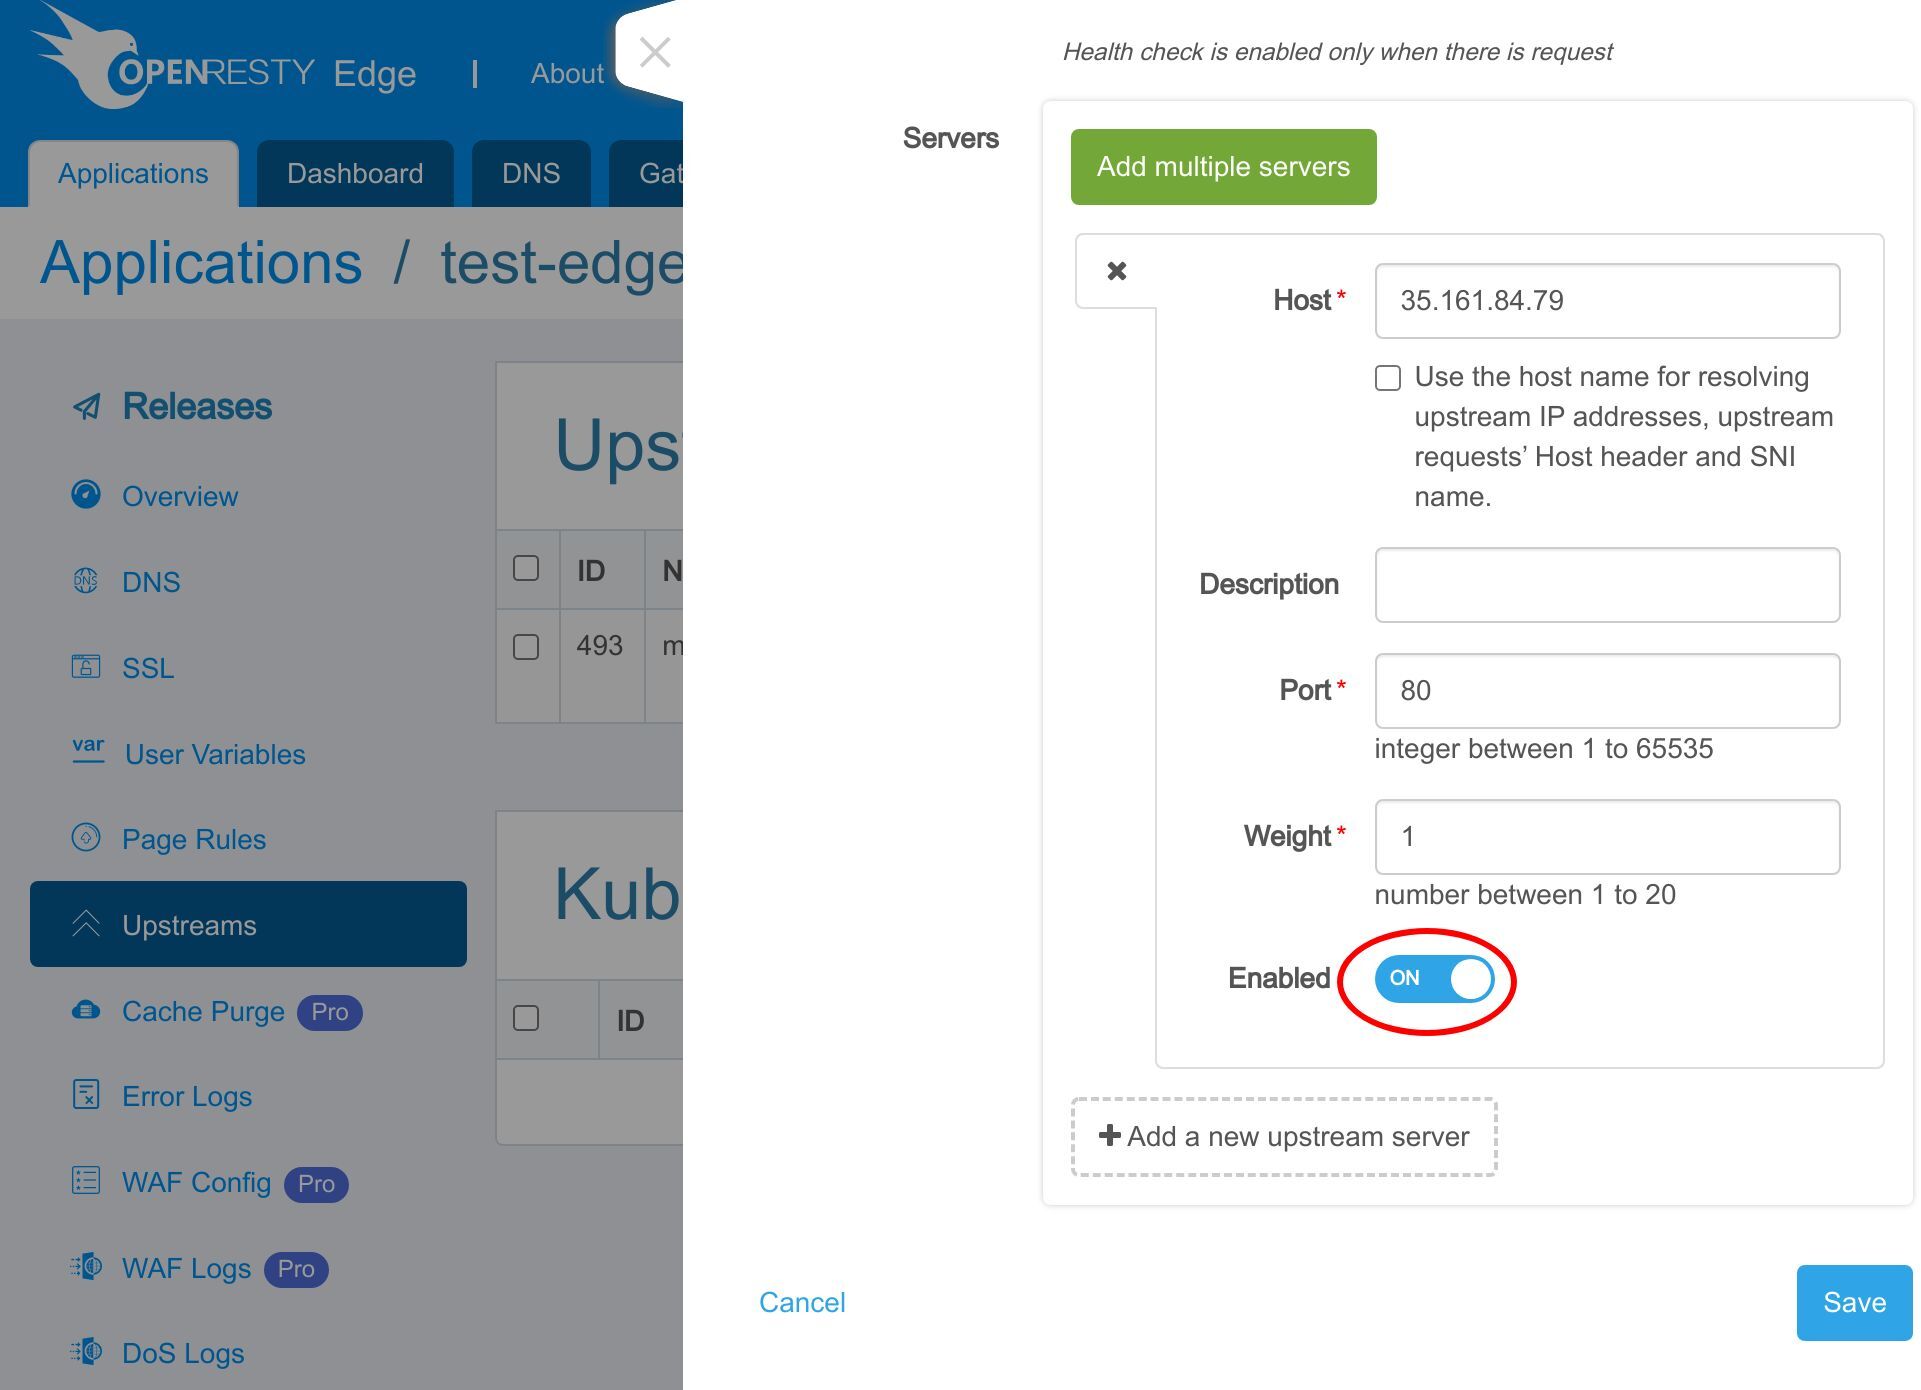
We disable this upstream server. After disabling upstream, we will get a bad gateway error when accessing the application.
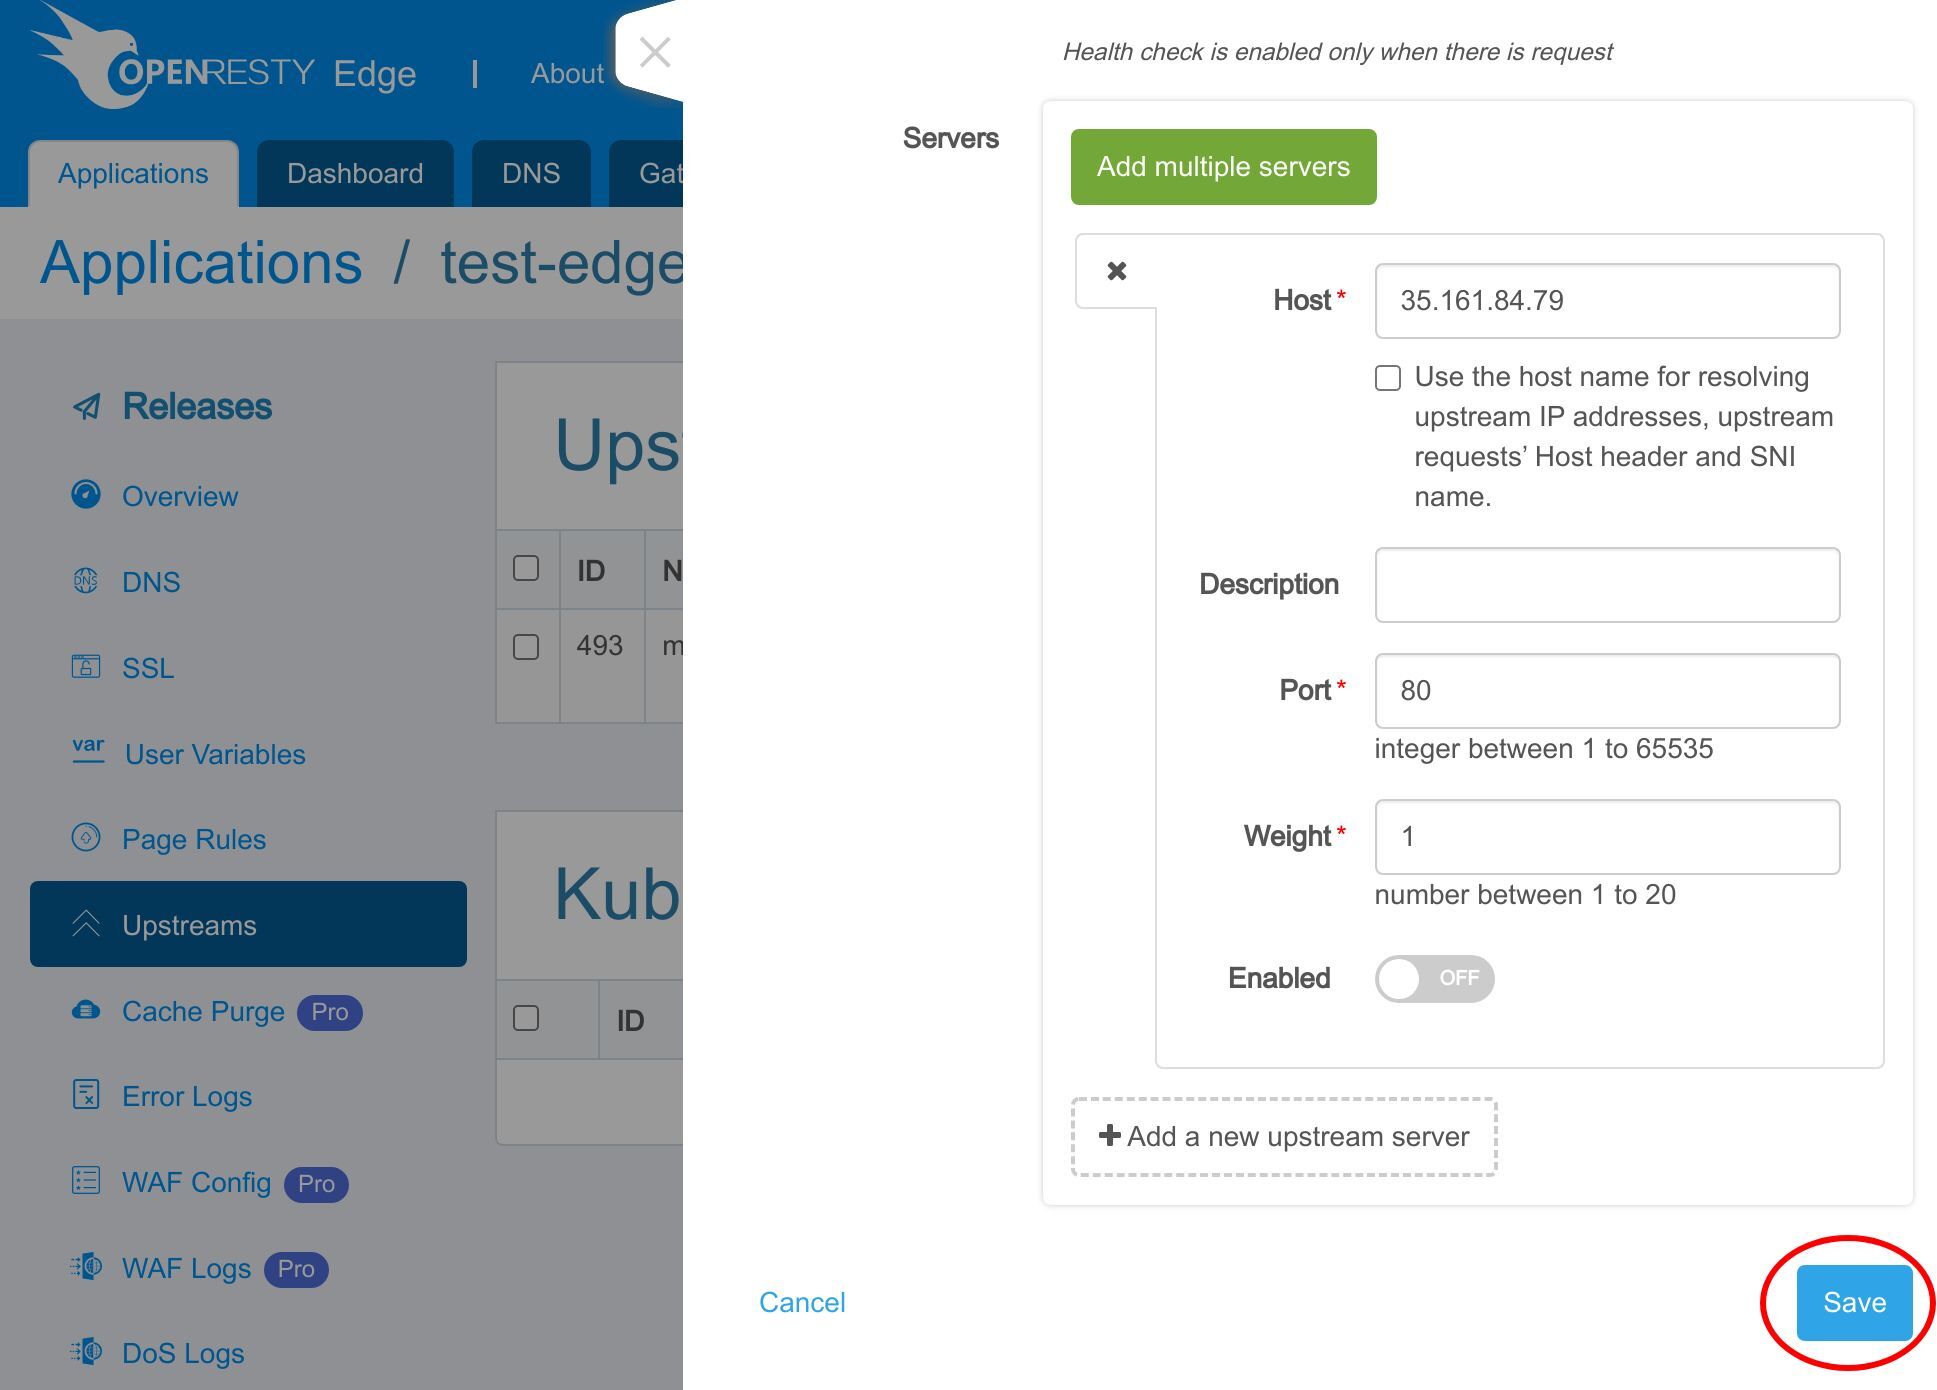
Save this change.
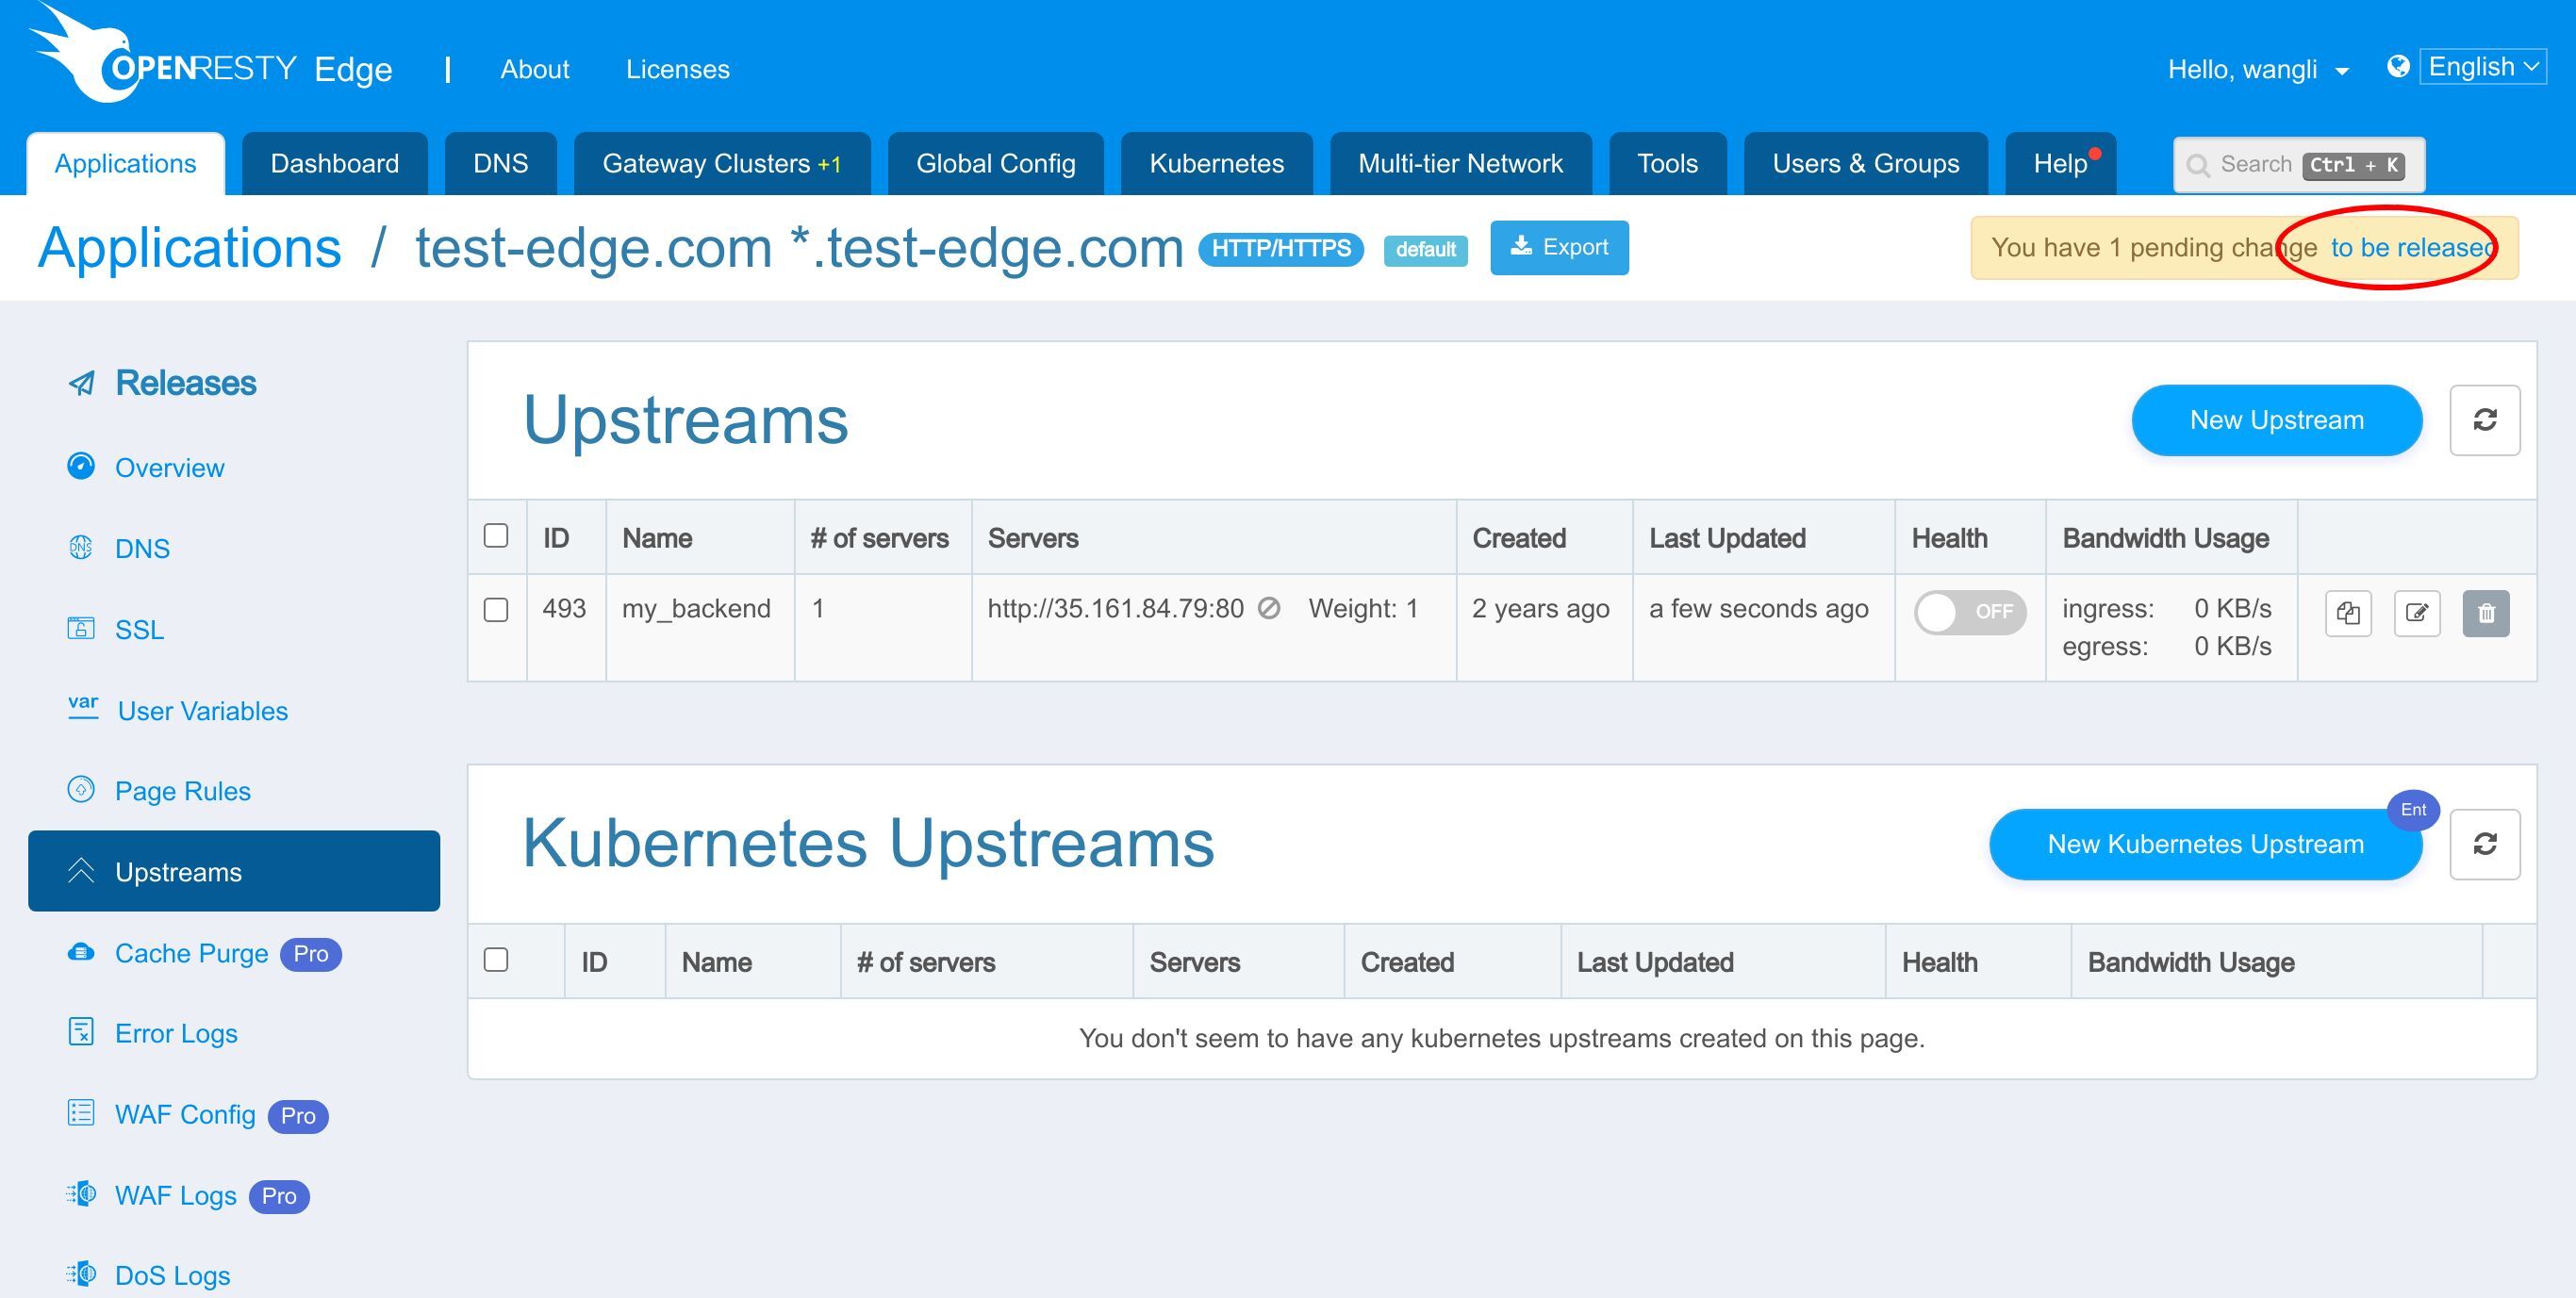
As always, we need to make a new release to push out our edited page rule.
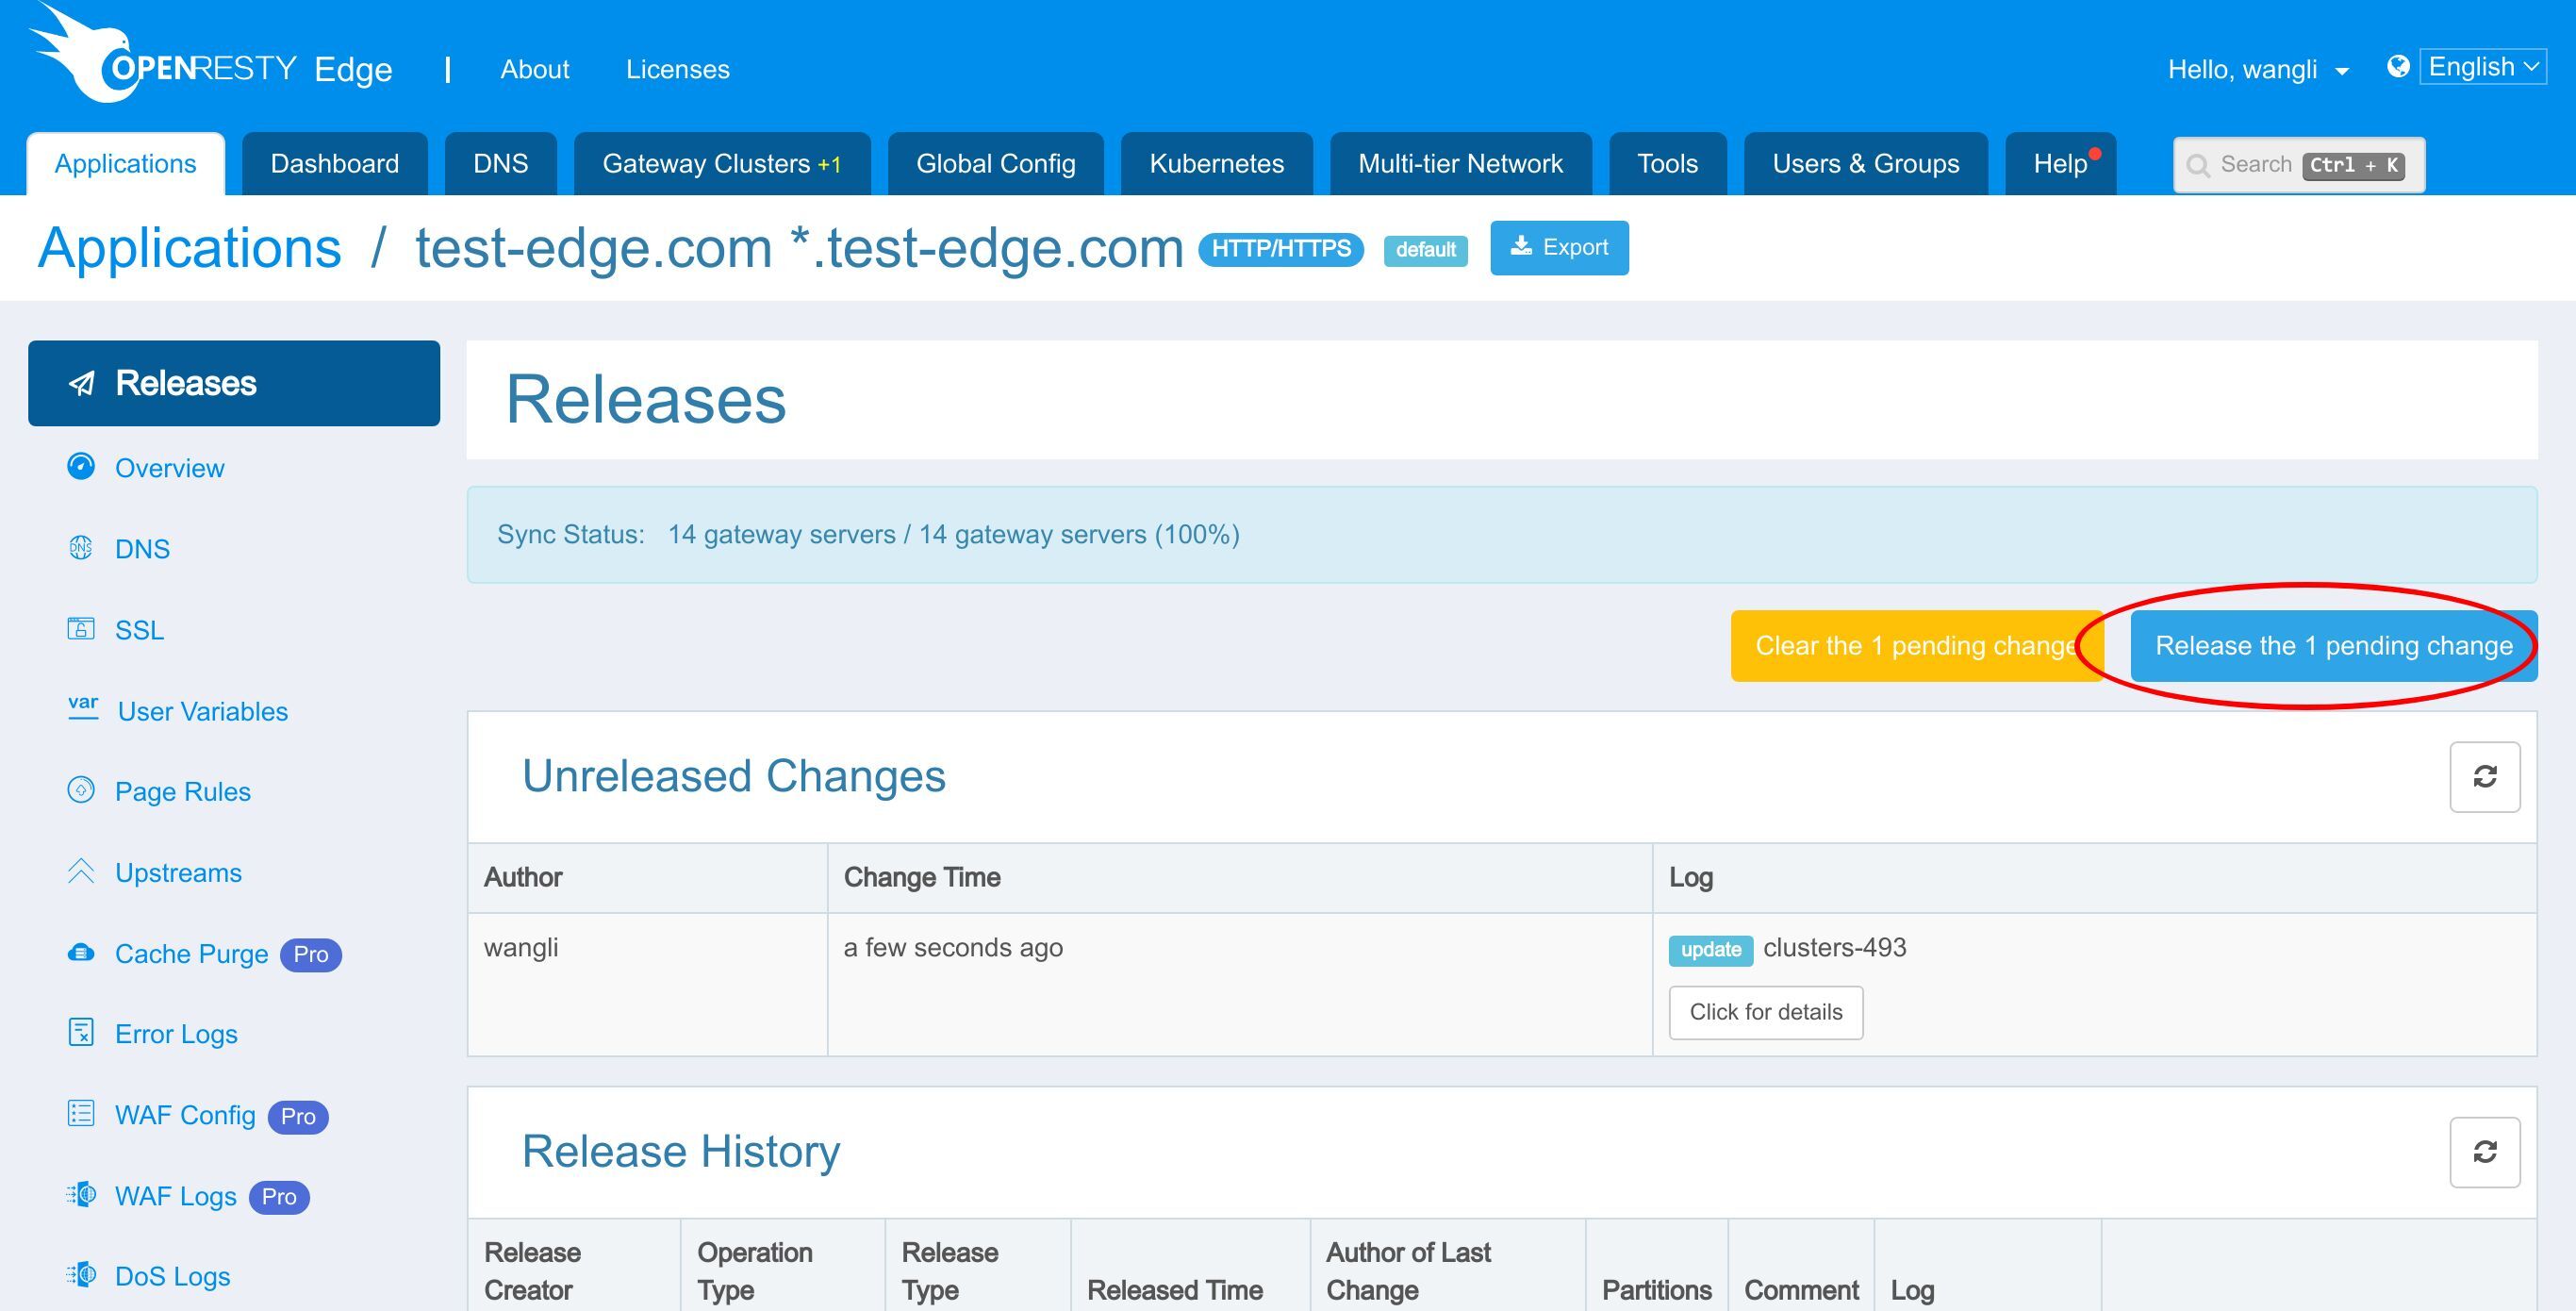
Click on this button.
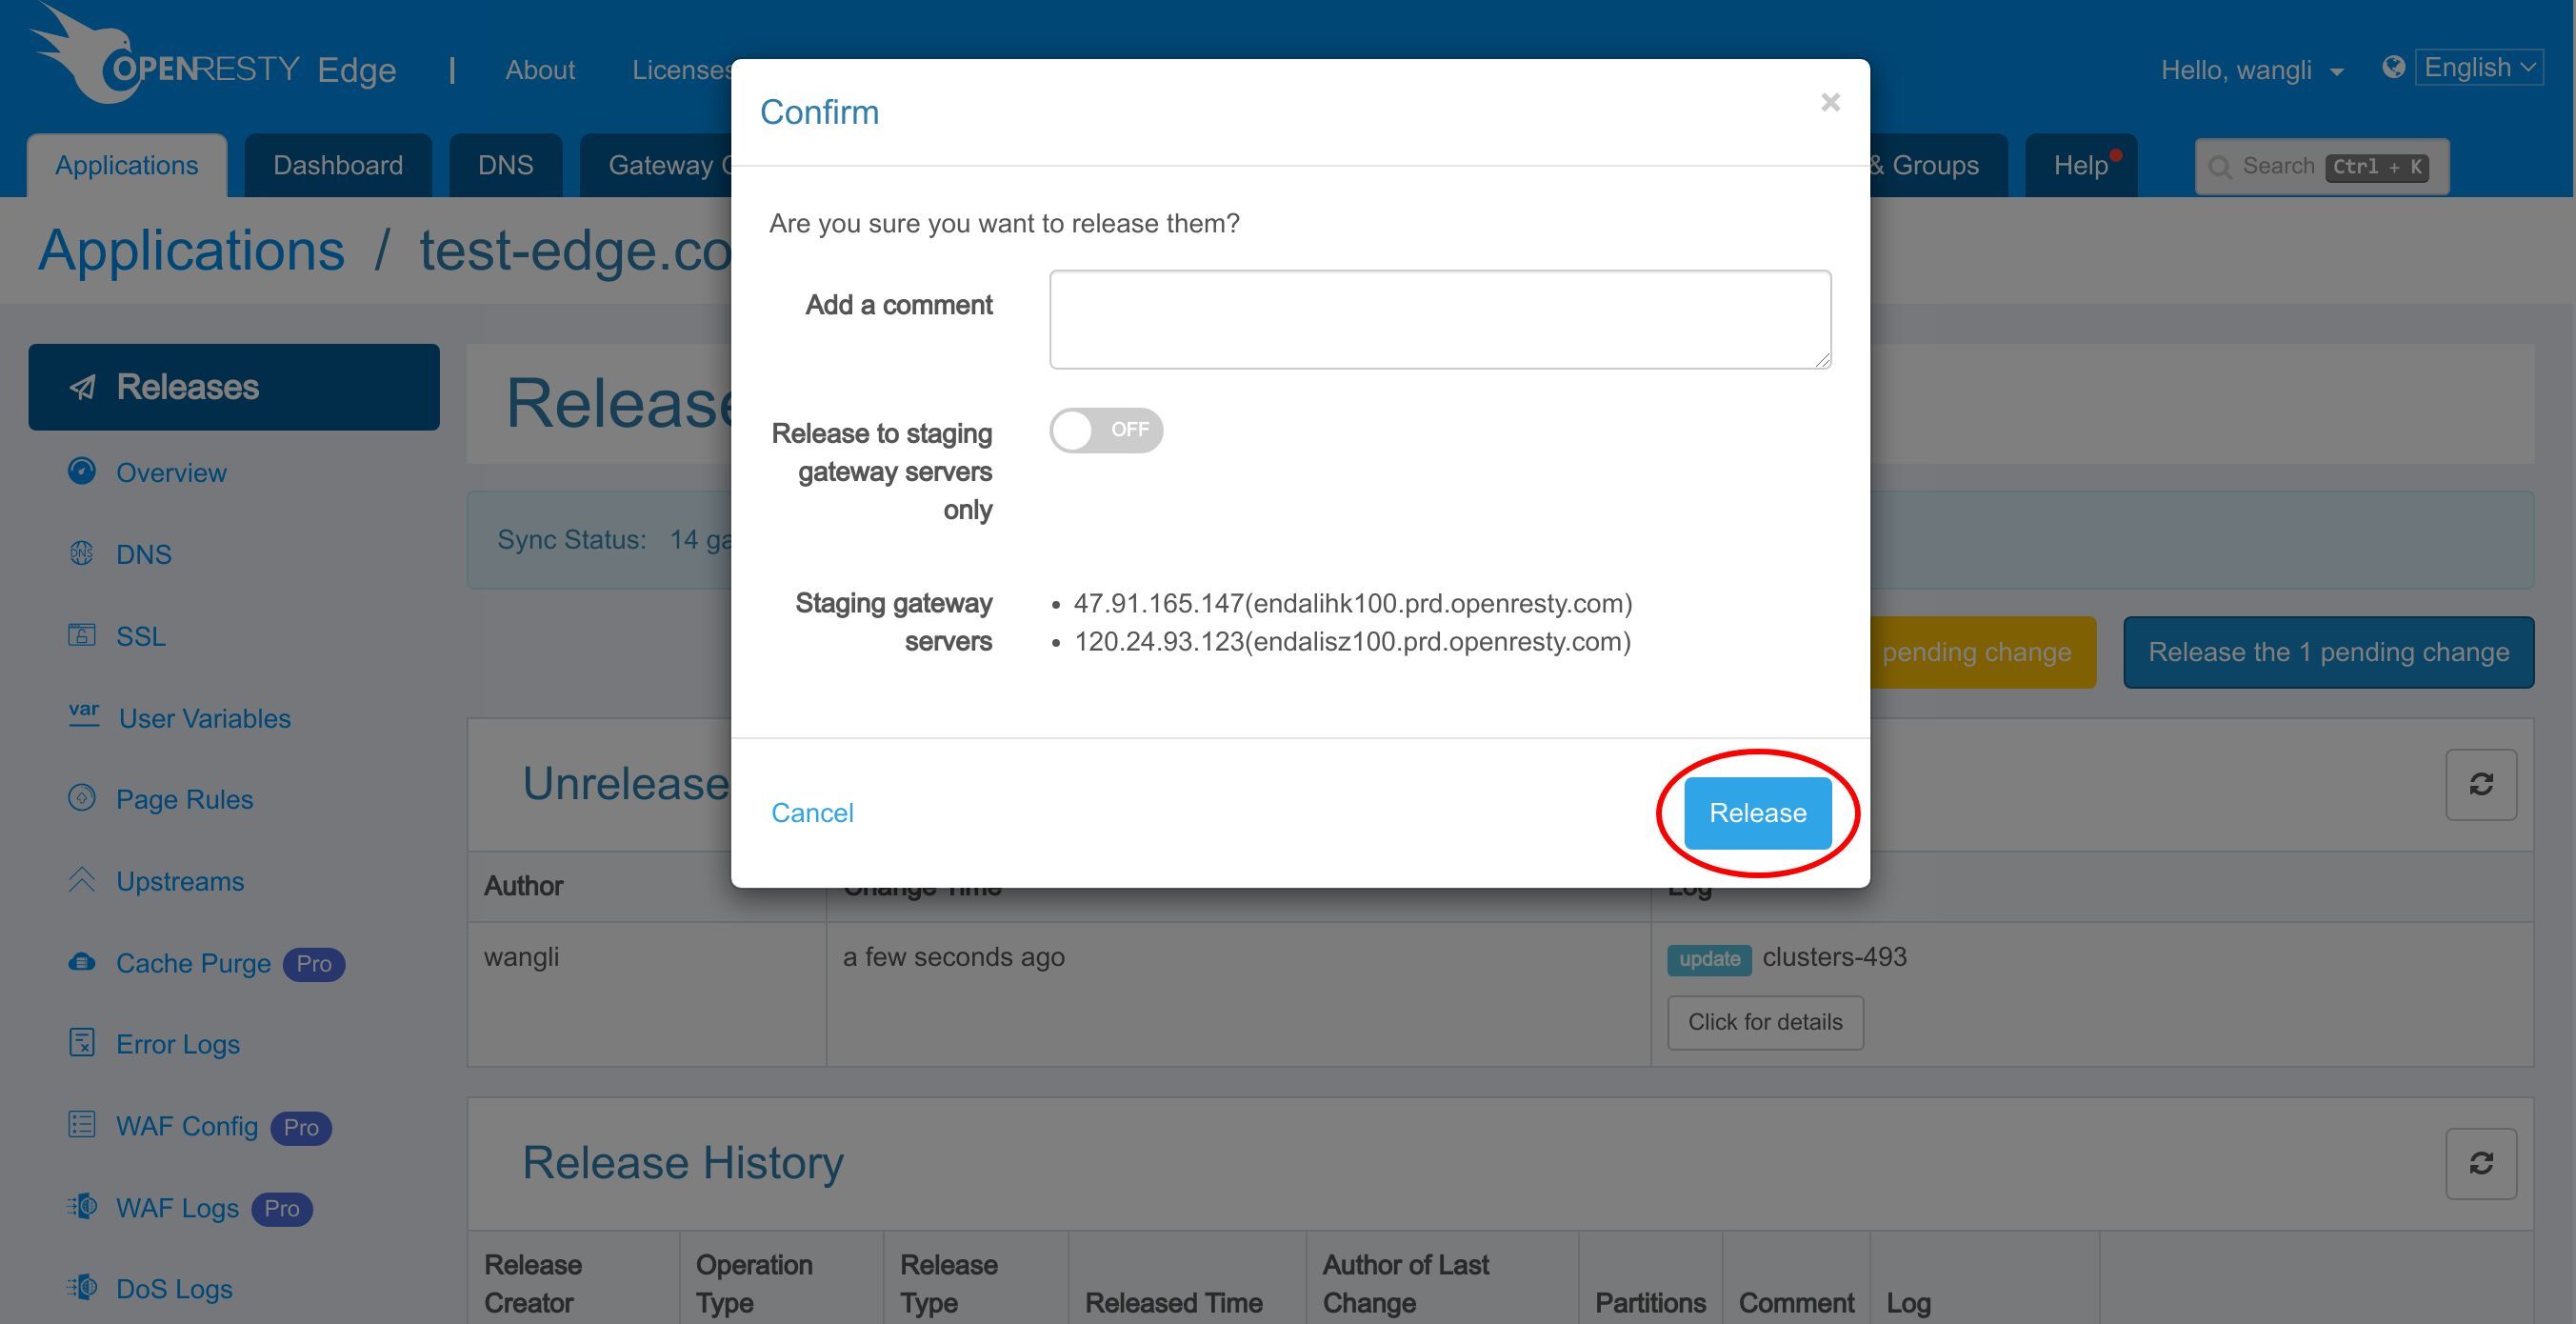
Ship it!
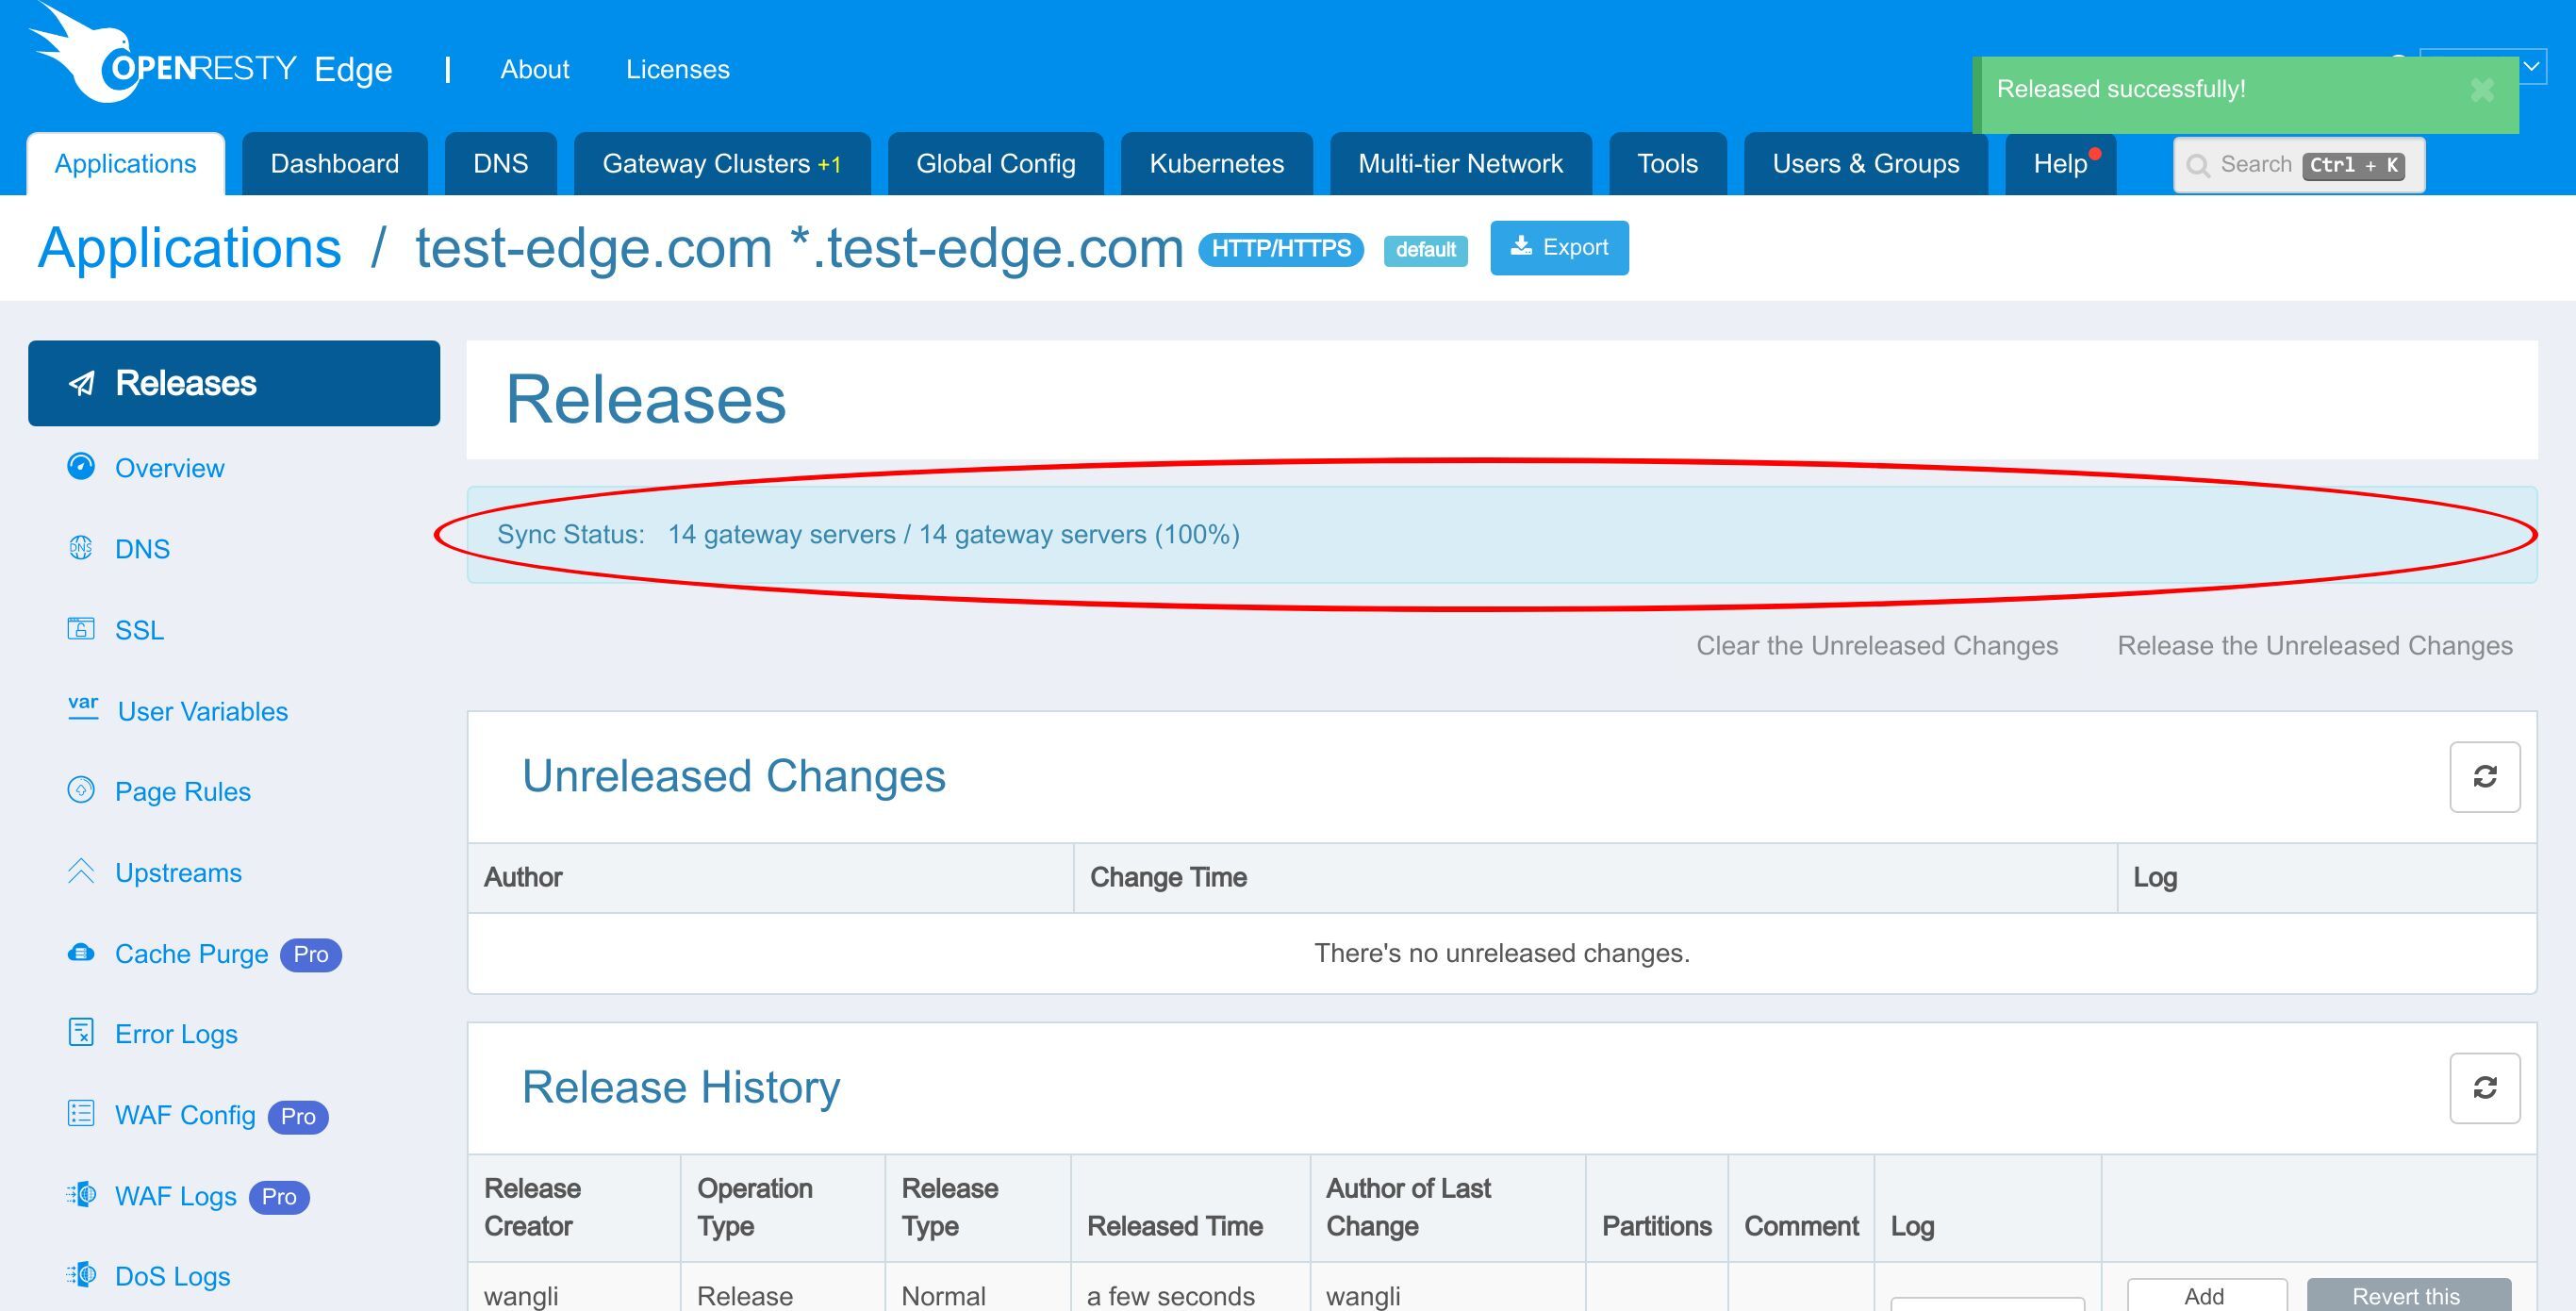
Our new release is now synchronized to all our gateway servers.
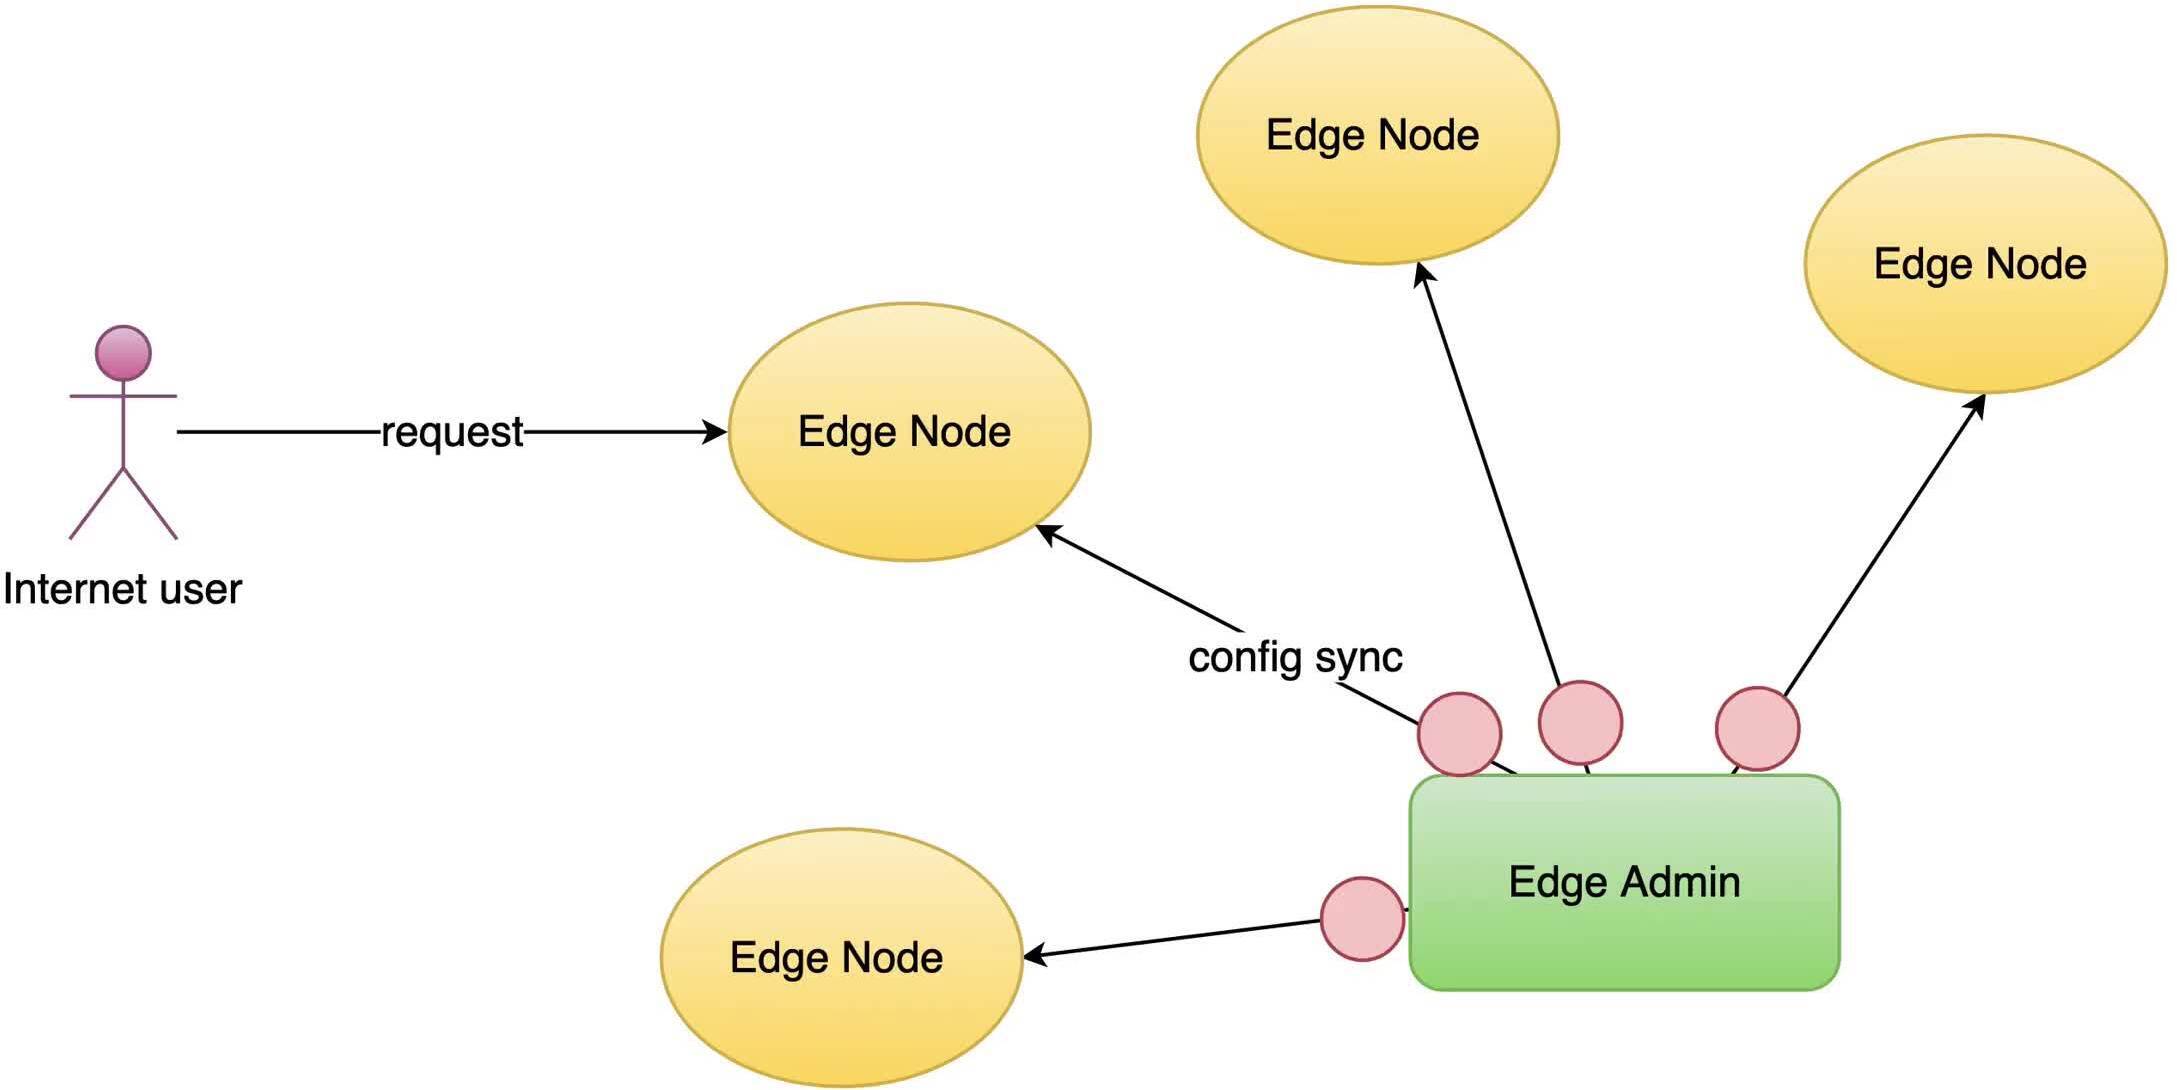
Now the new page rule has been pushed to all the gateway clusters and servers.
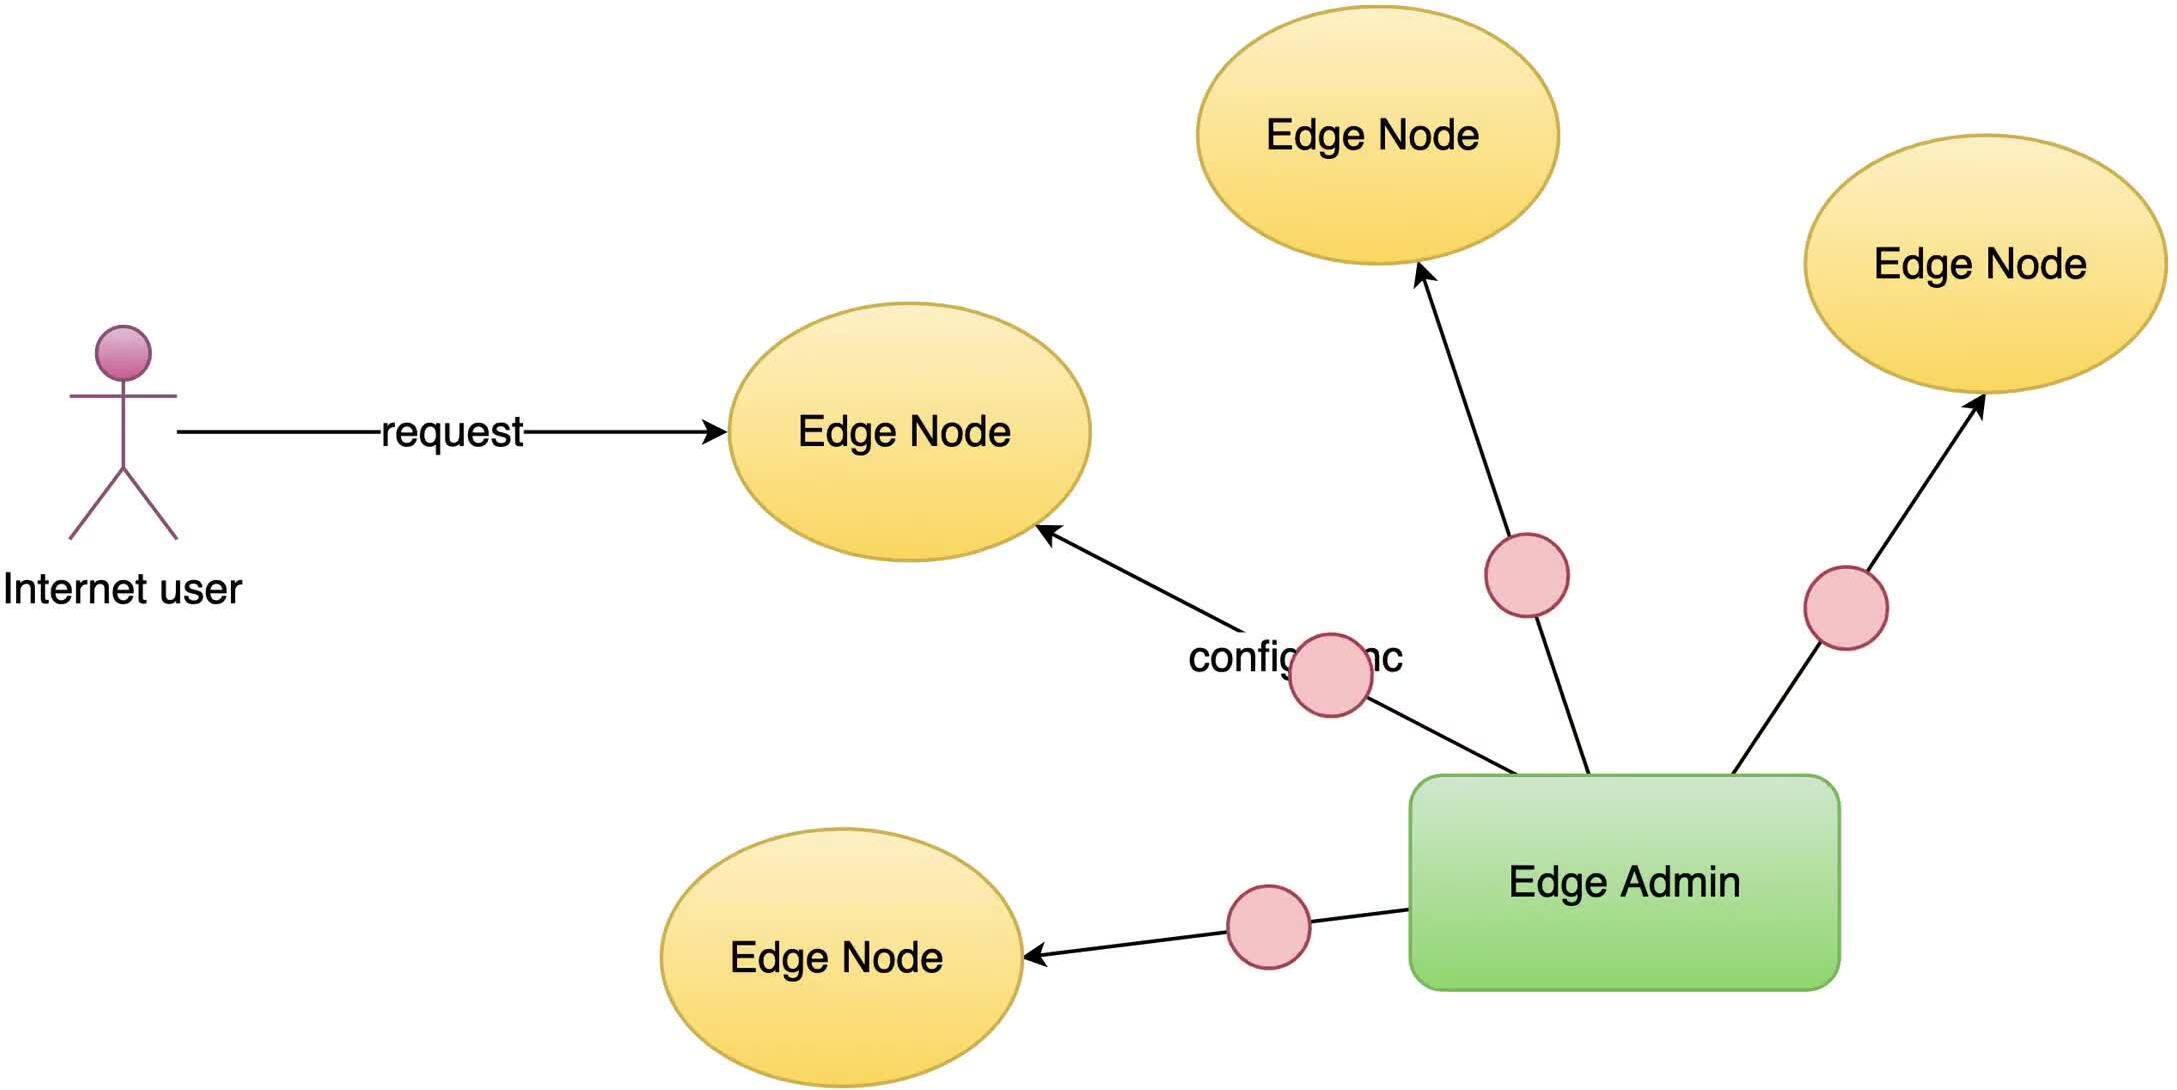
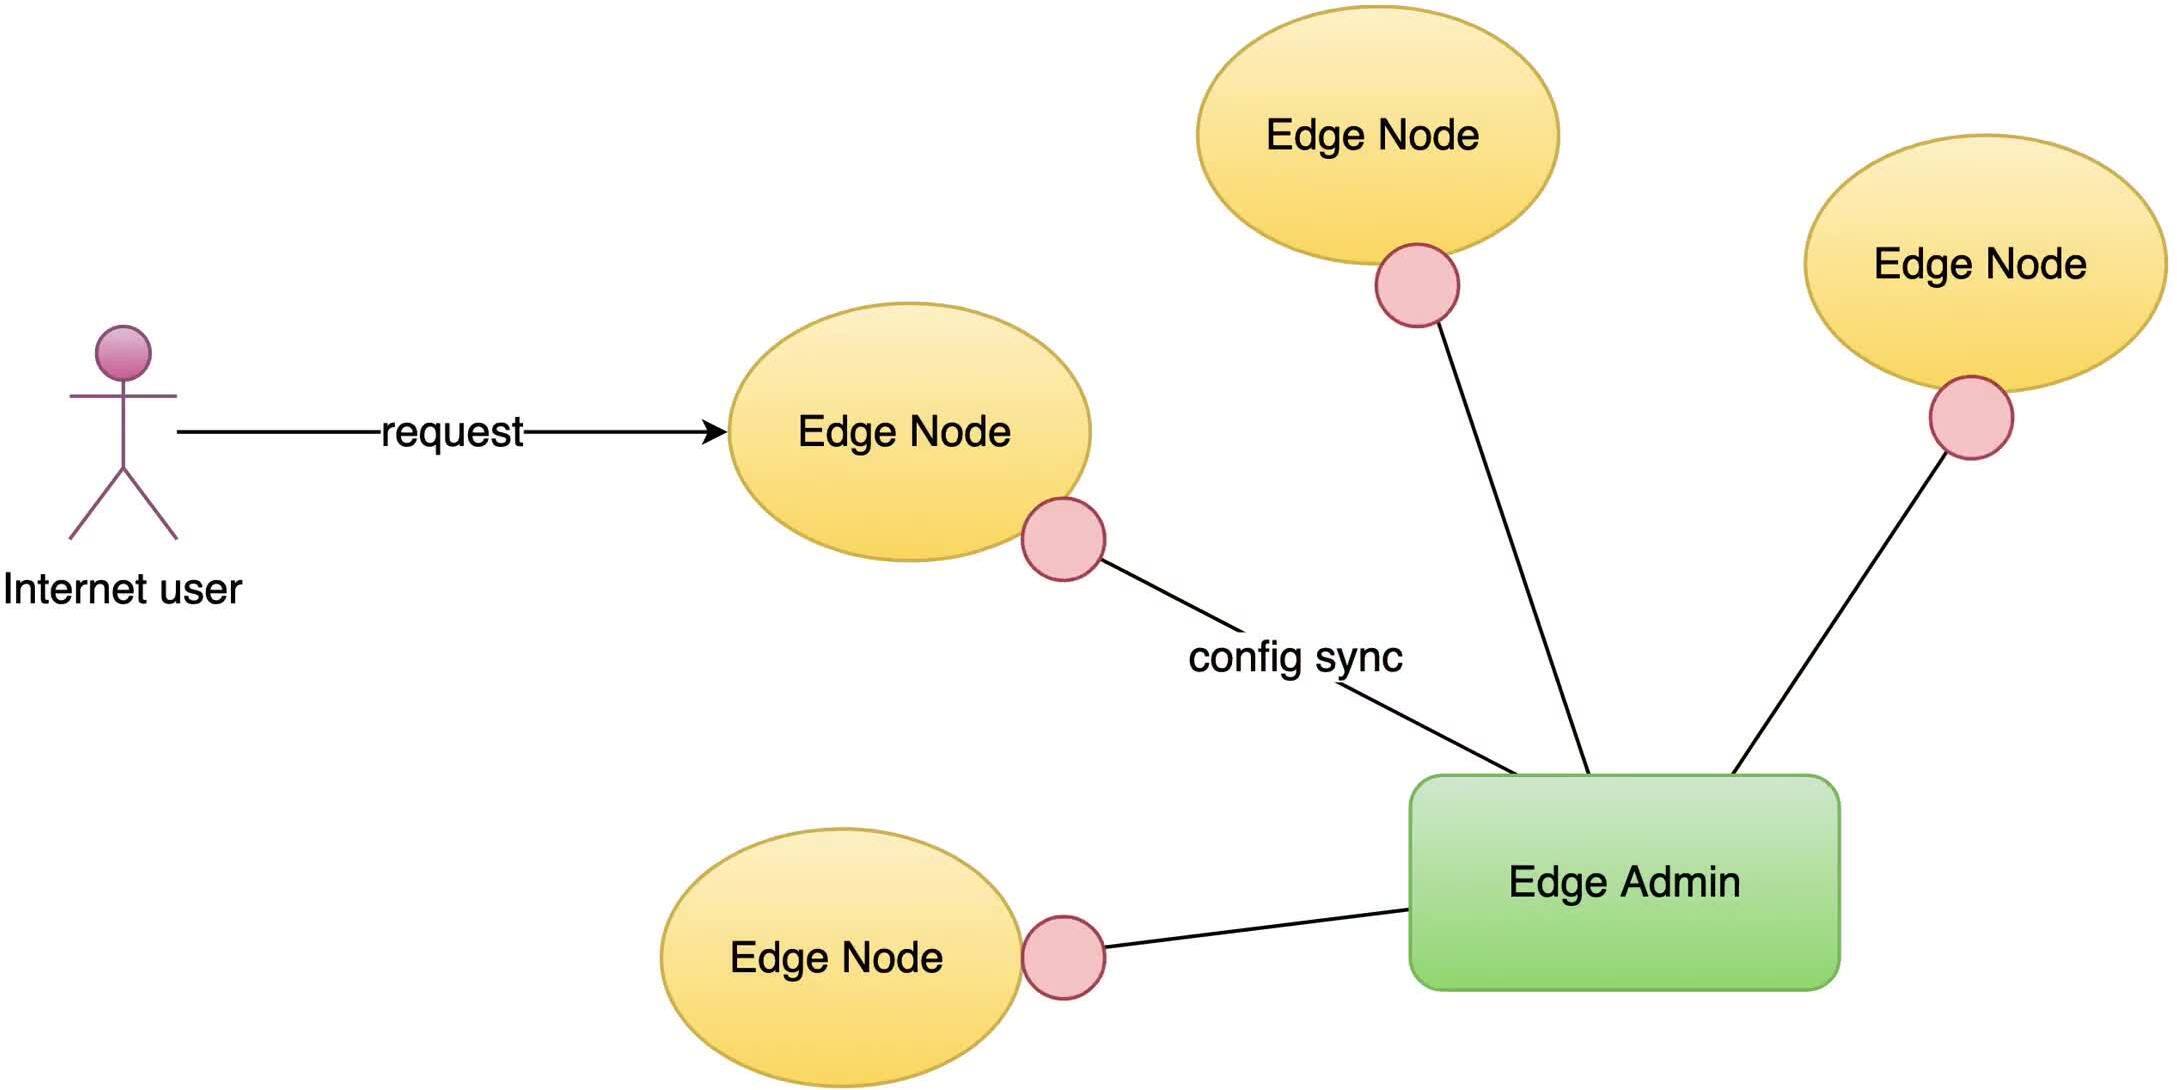
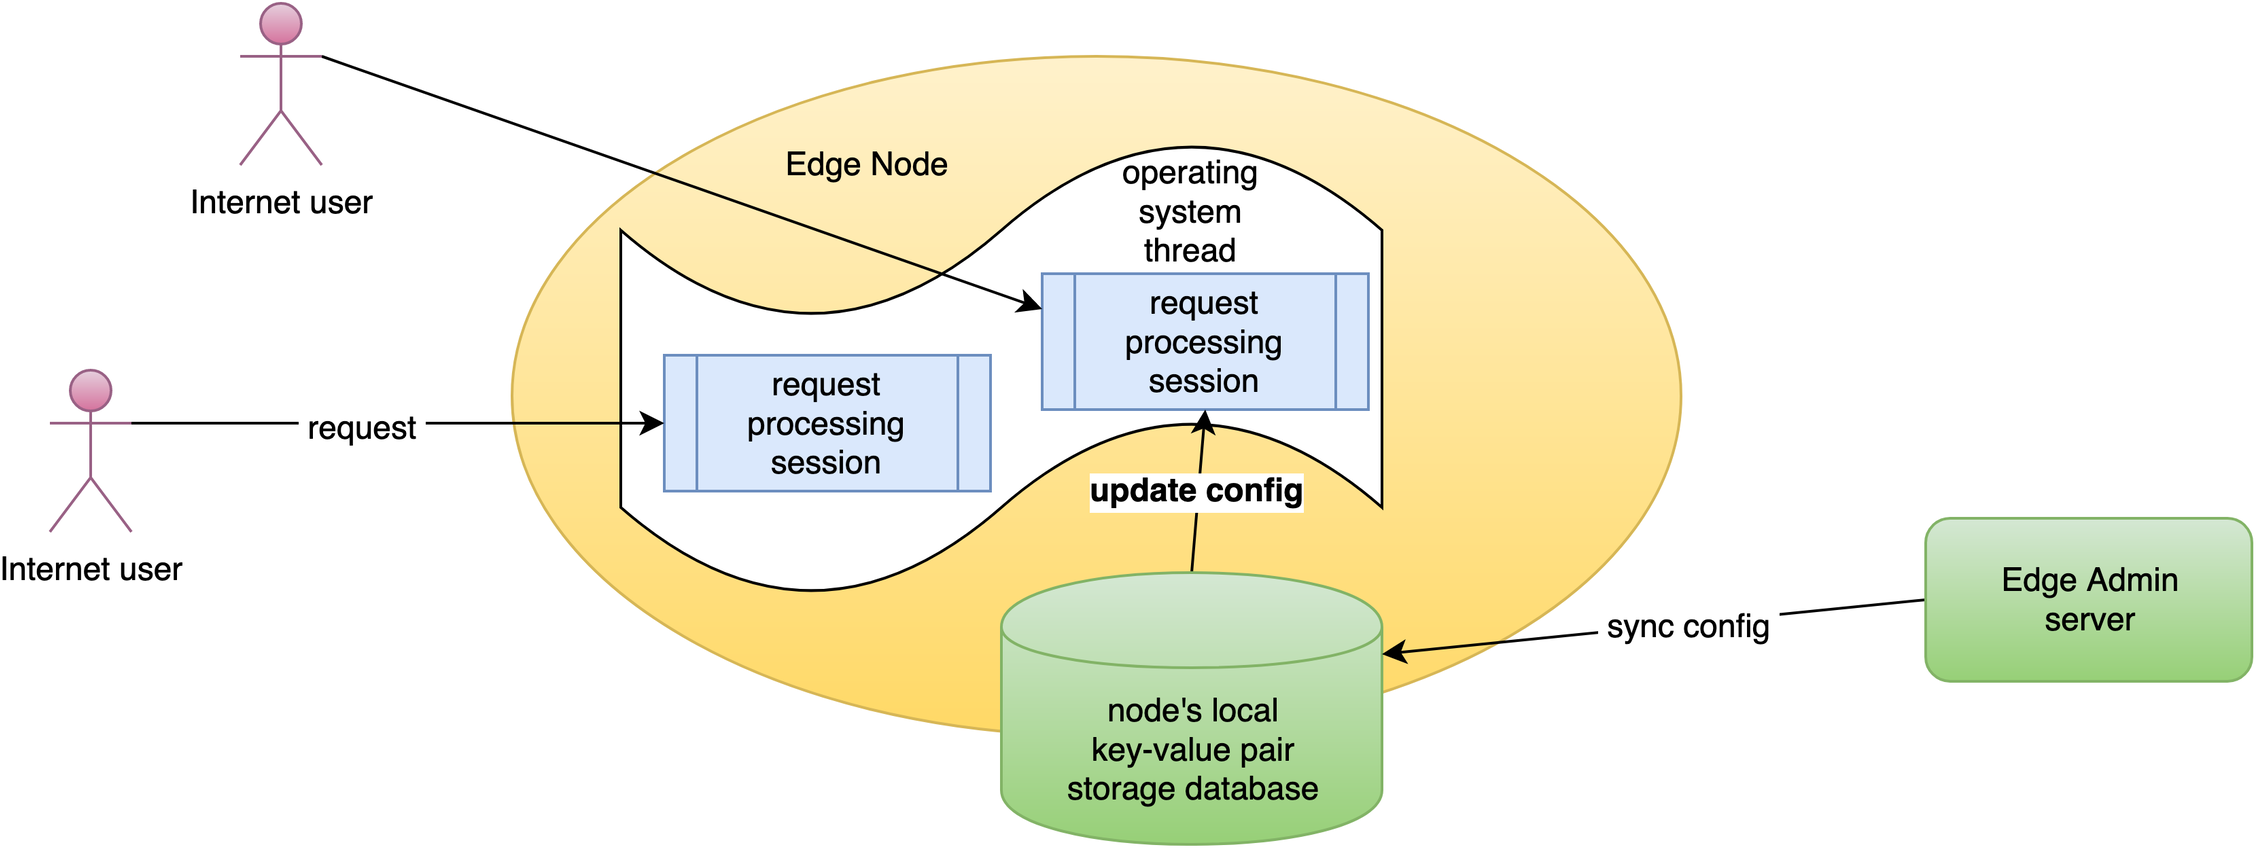
Our configuration changes do NOT require server reload, restart, or binary upgrade. So it’s very efficient and scalable.
Now let’s try to send a request.
On the terminal, we send a request by curl.
curl -sSI http://test-edge.com
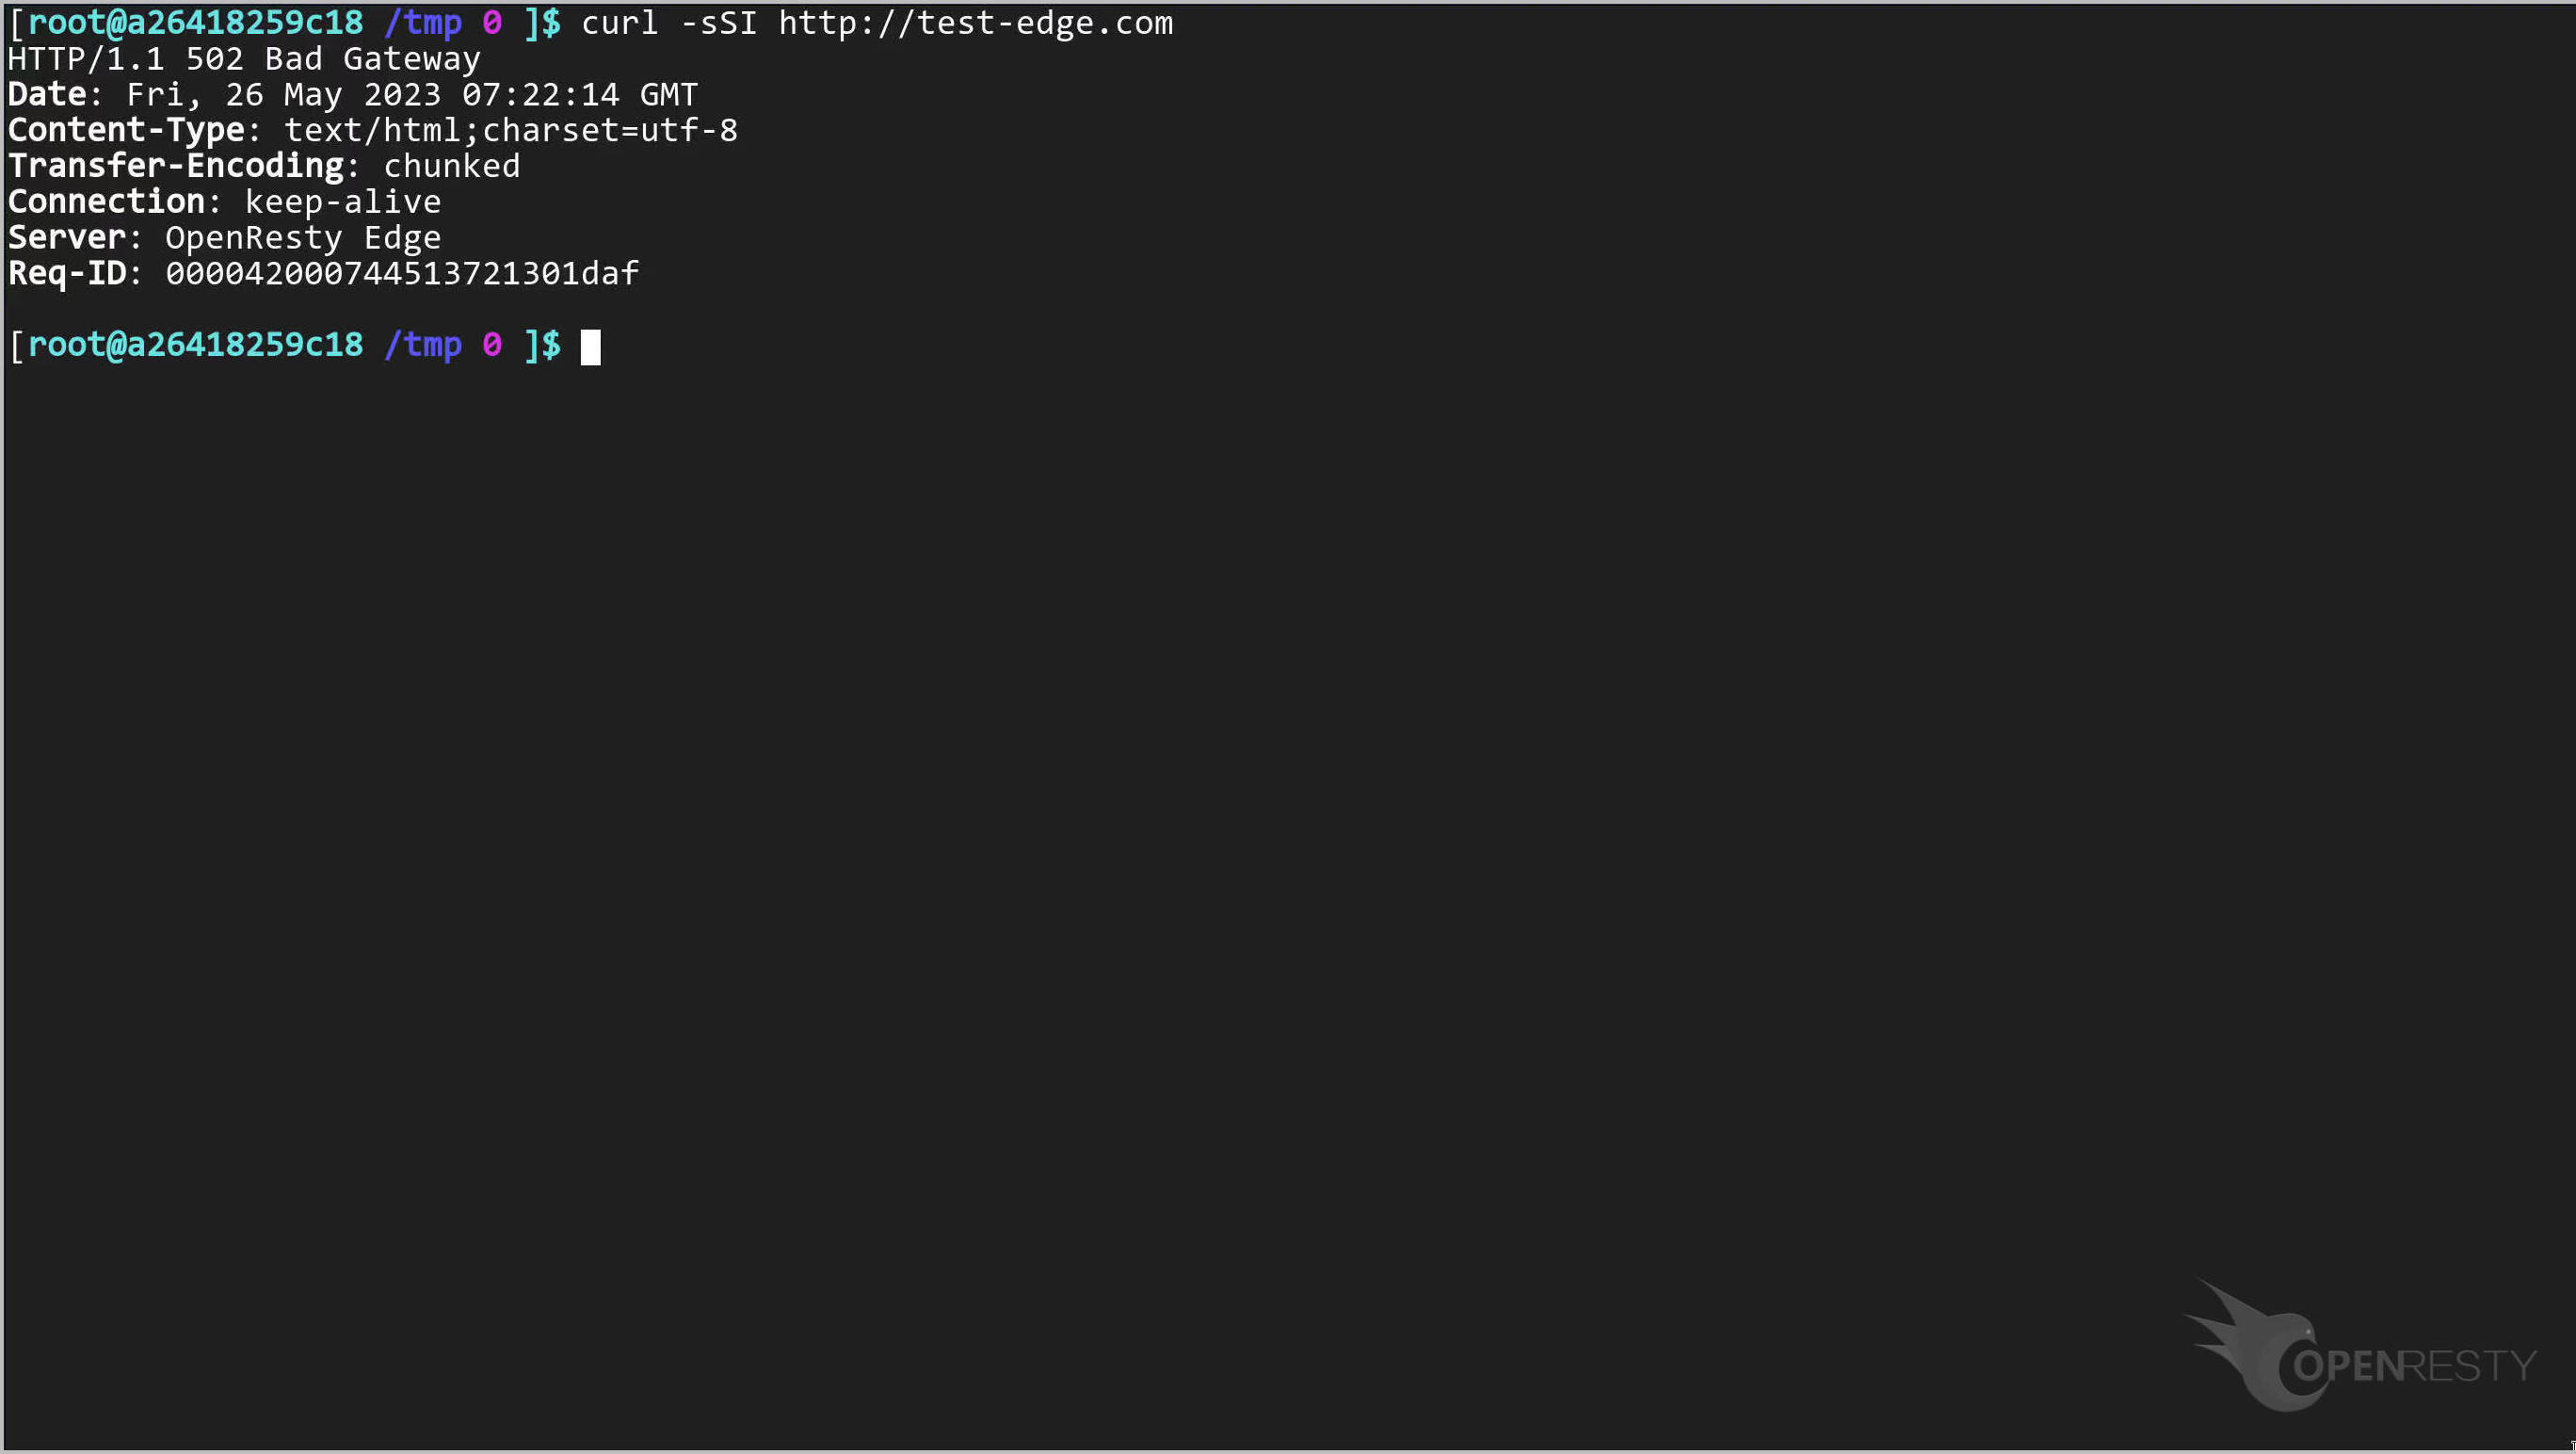
We can see the bad gateway error, which will be recorded in our application’s error log.
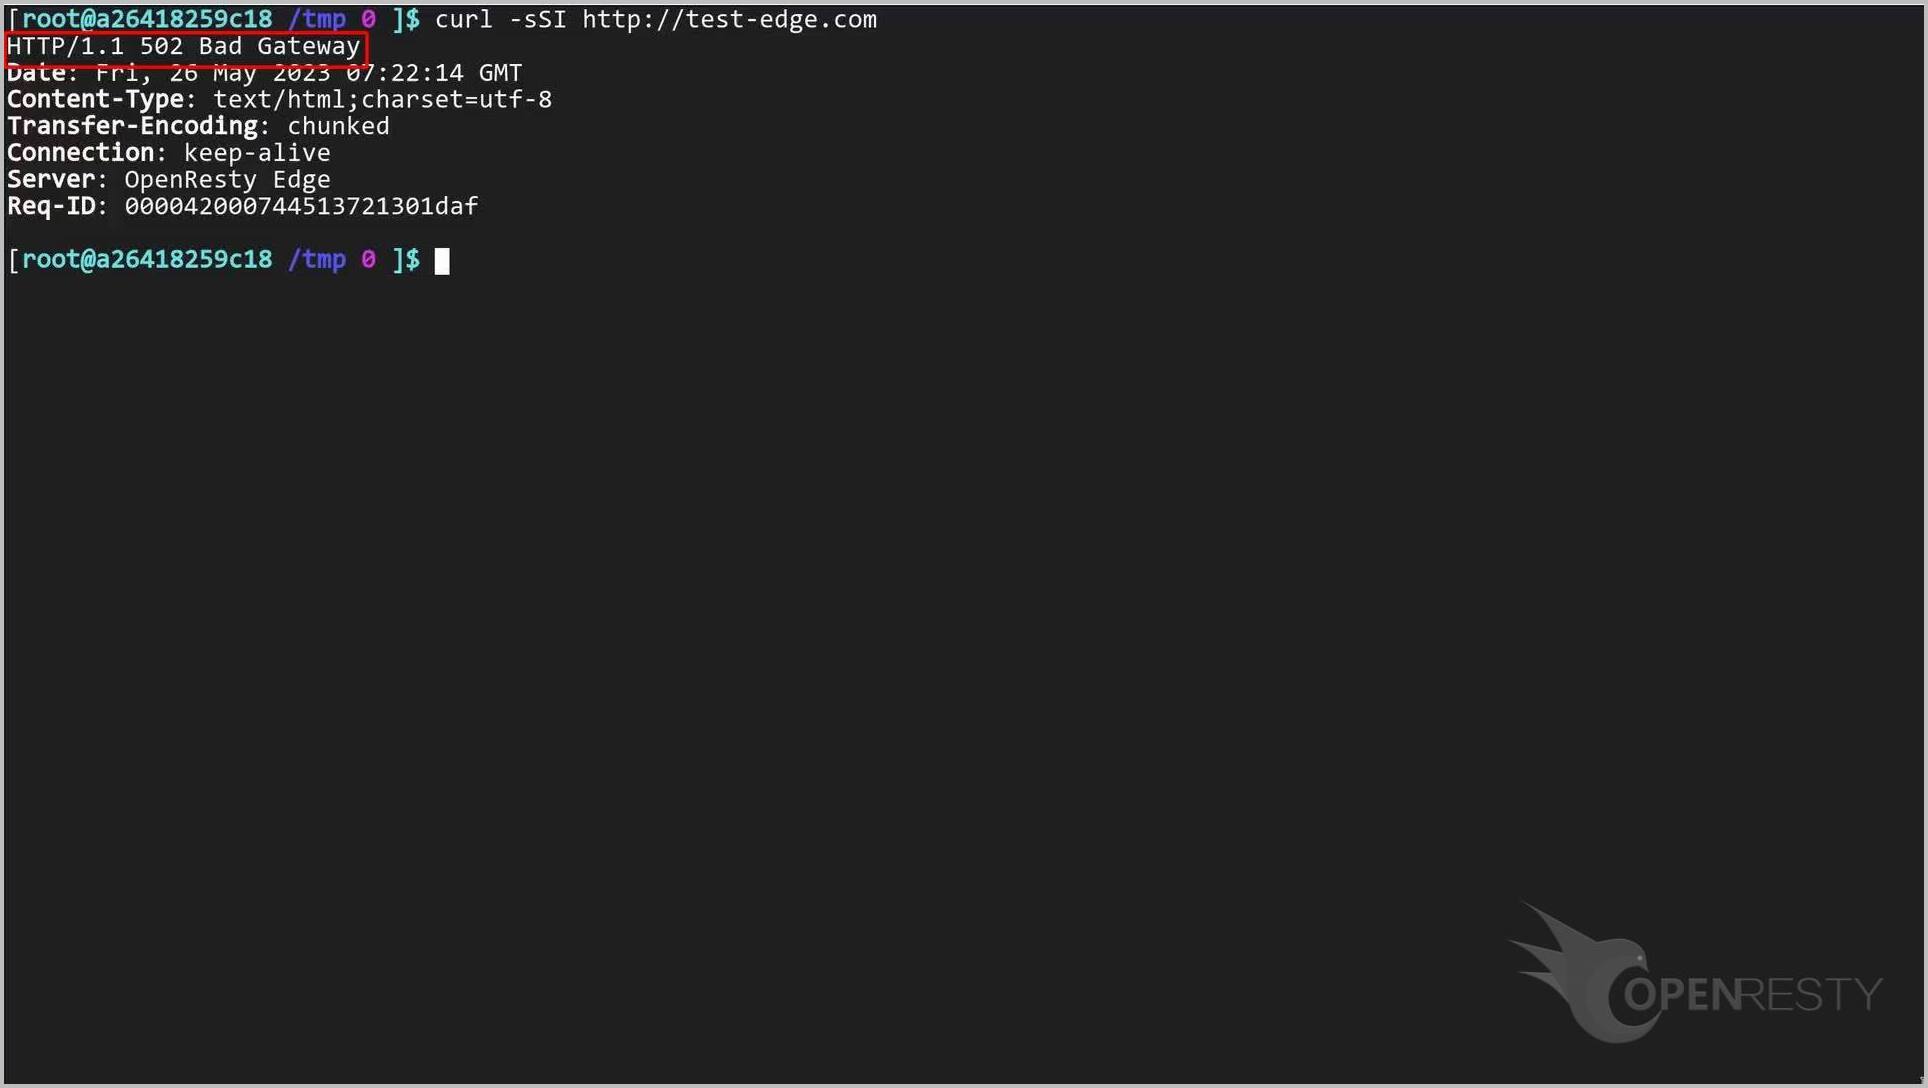
And we can see that the server-side response has a request ID. We can copy it and use it to find the corresponding log message.
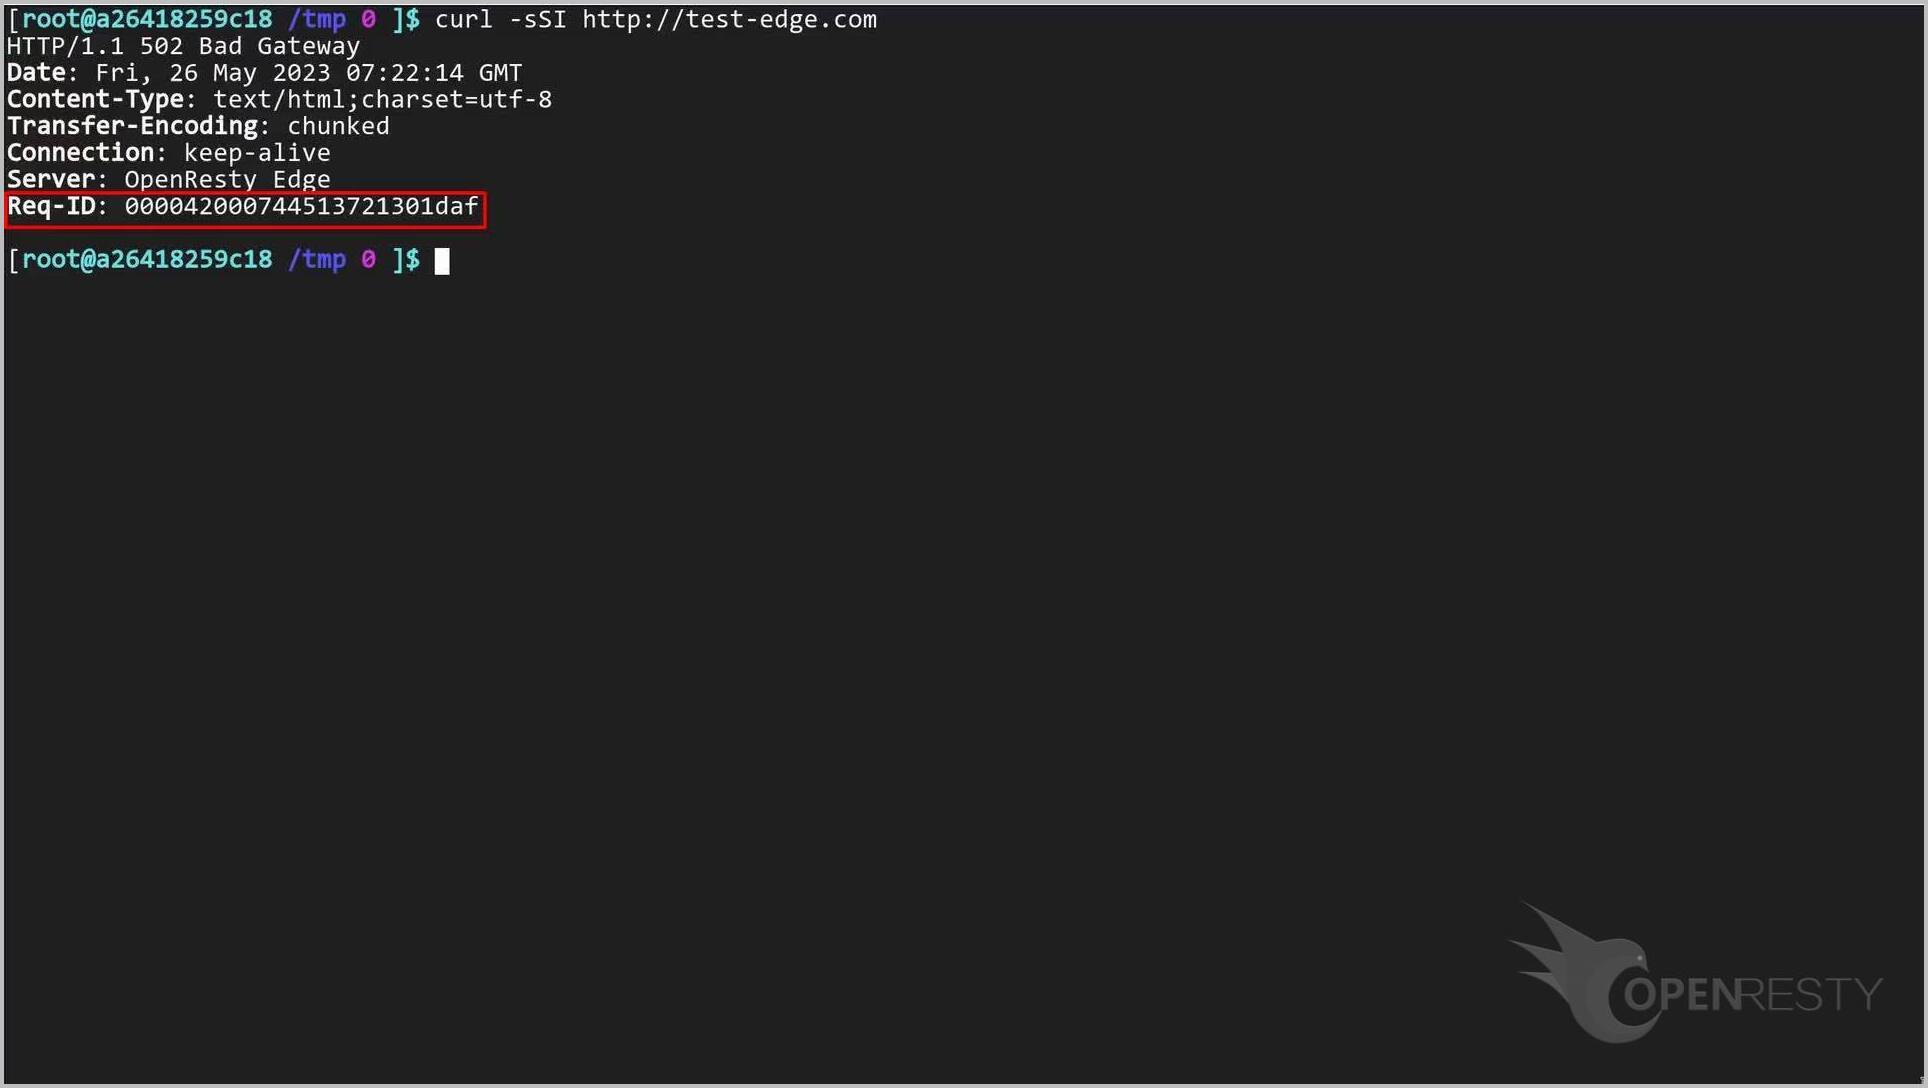
Let’s go back to the application’s error logs page. Check the error log message we generated.
As we expected, an error log was generated. Our newly generated error log will appear at the top of the list.
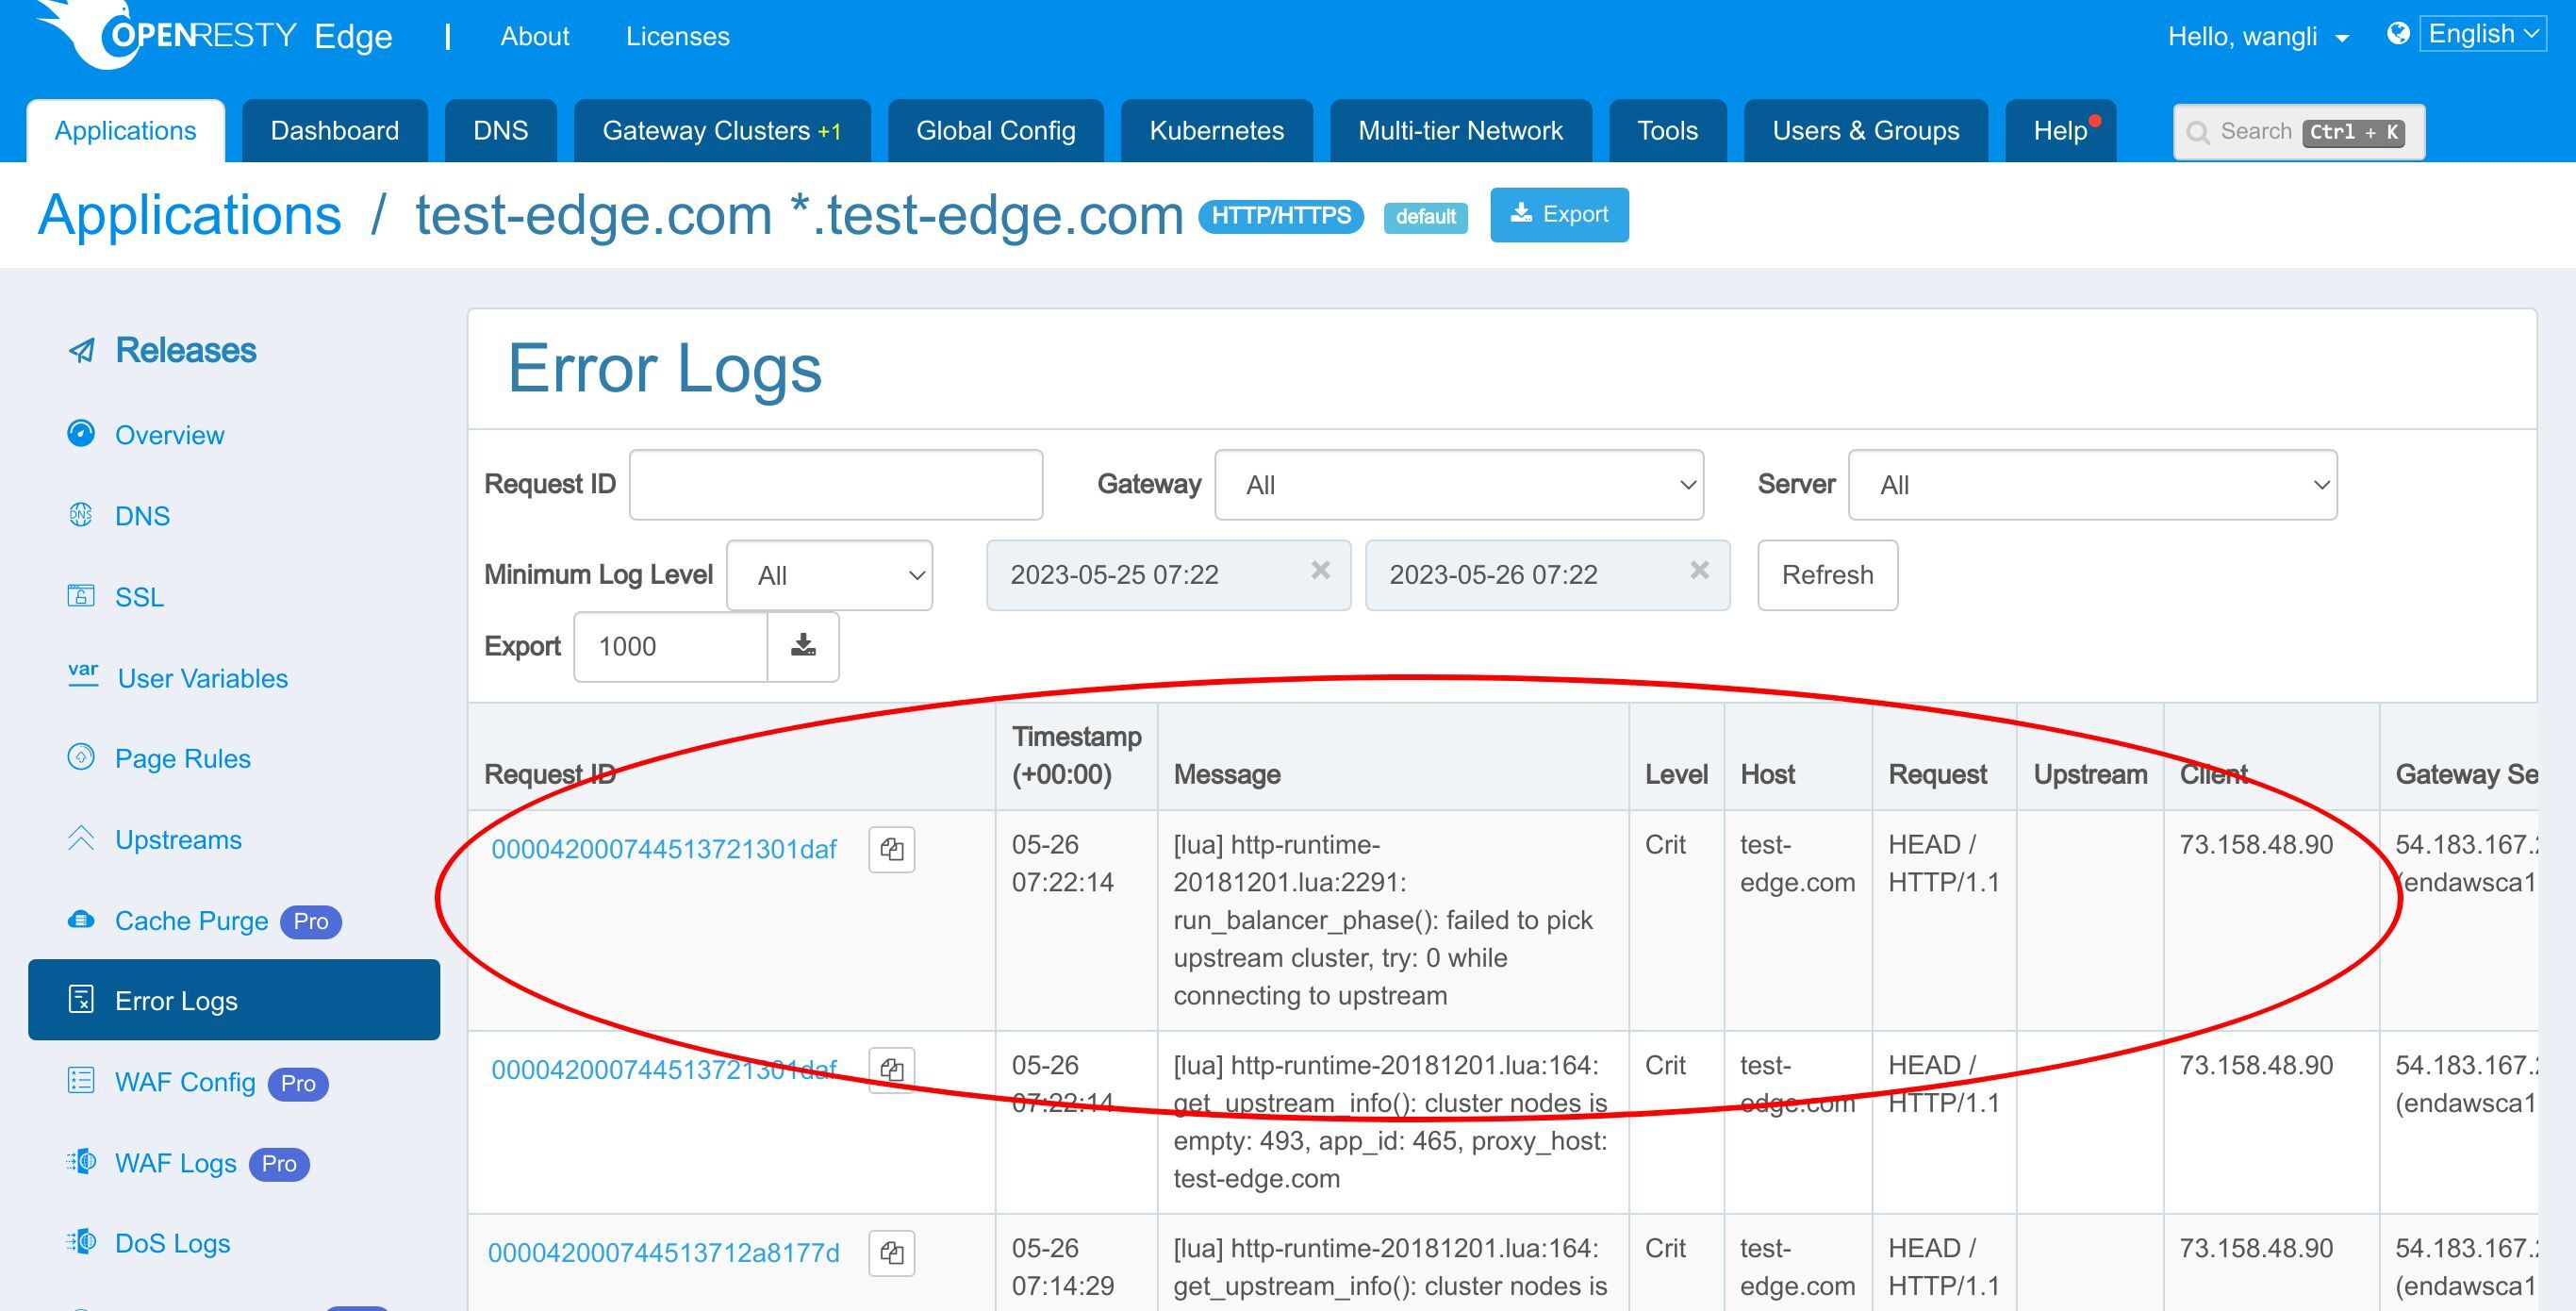
Filtering error logs by Request ID, gateway, server, and log level
The error logs for this domain are few. Let’s look at the error logs for the other domains we already have online.
Go to the Application list page.
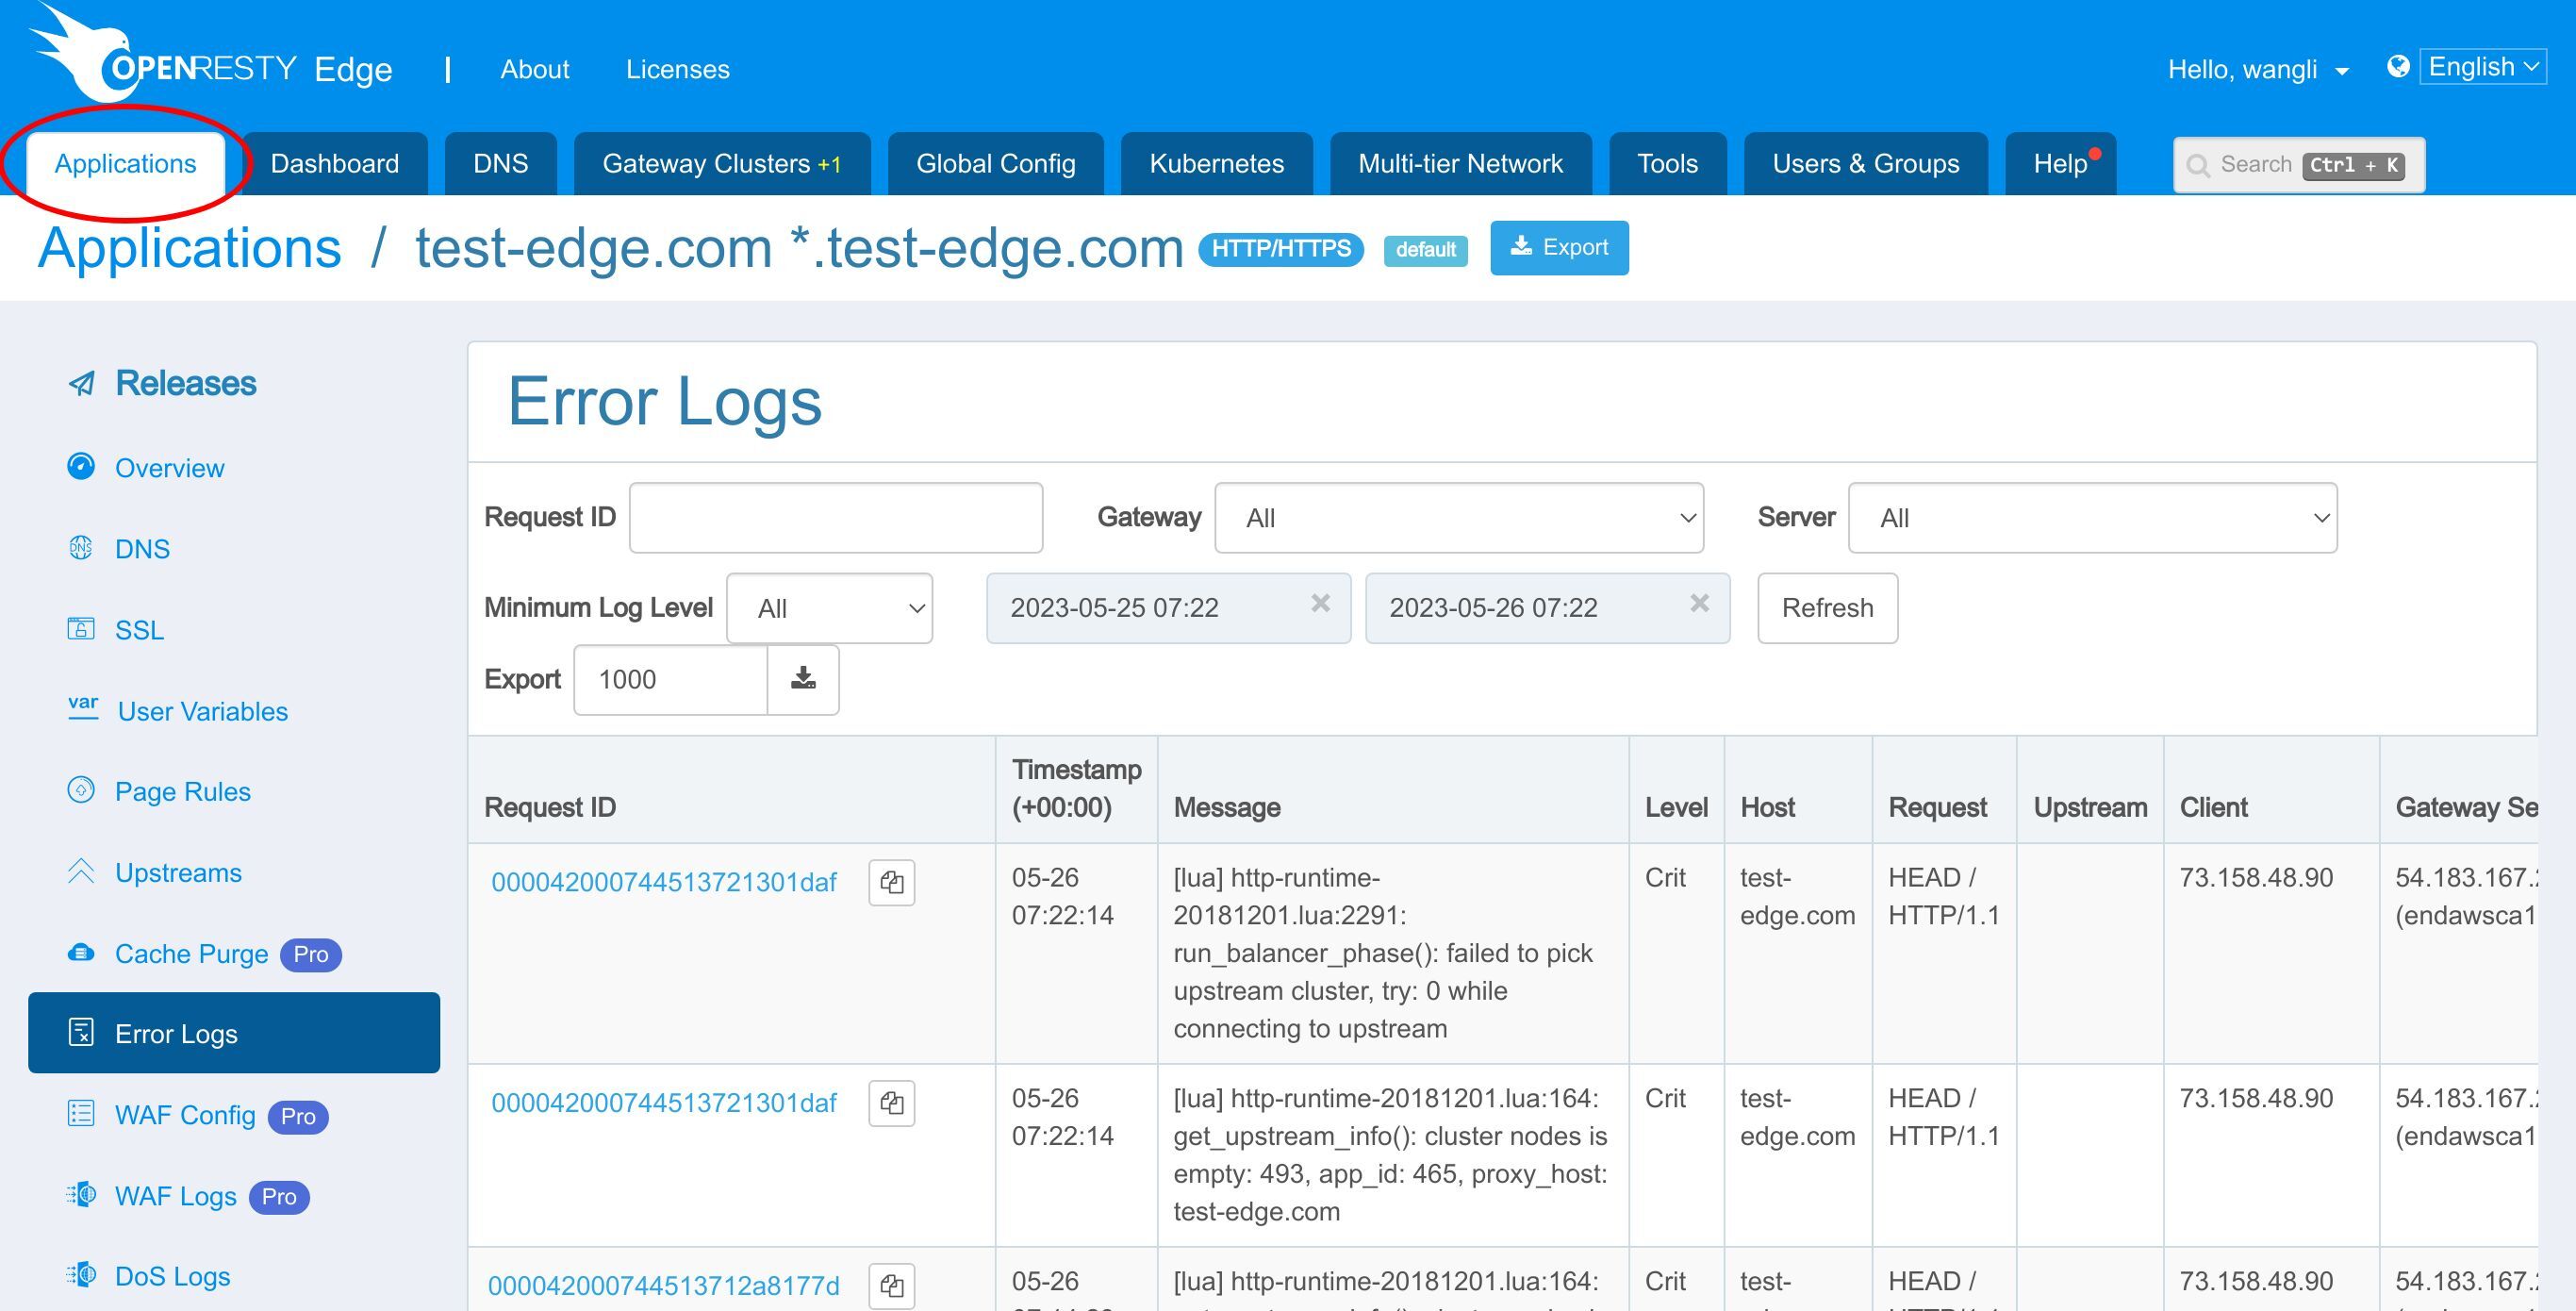
Let’s see the error logs of the OpenResty website.
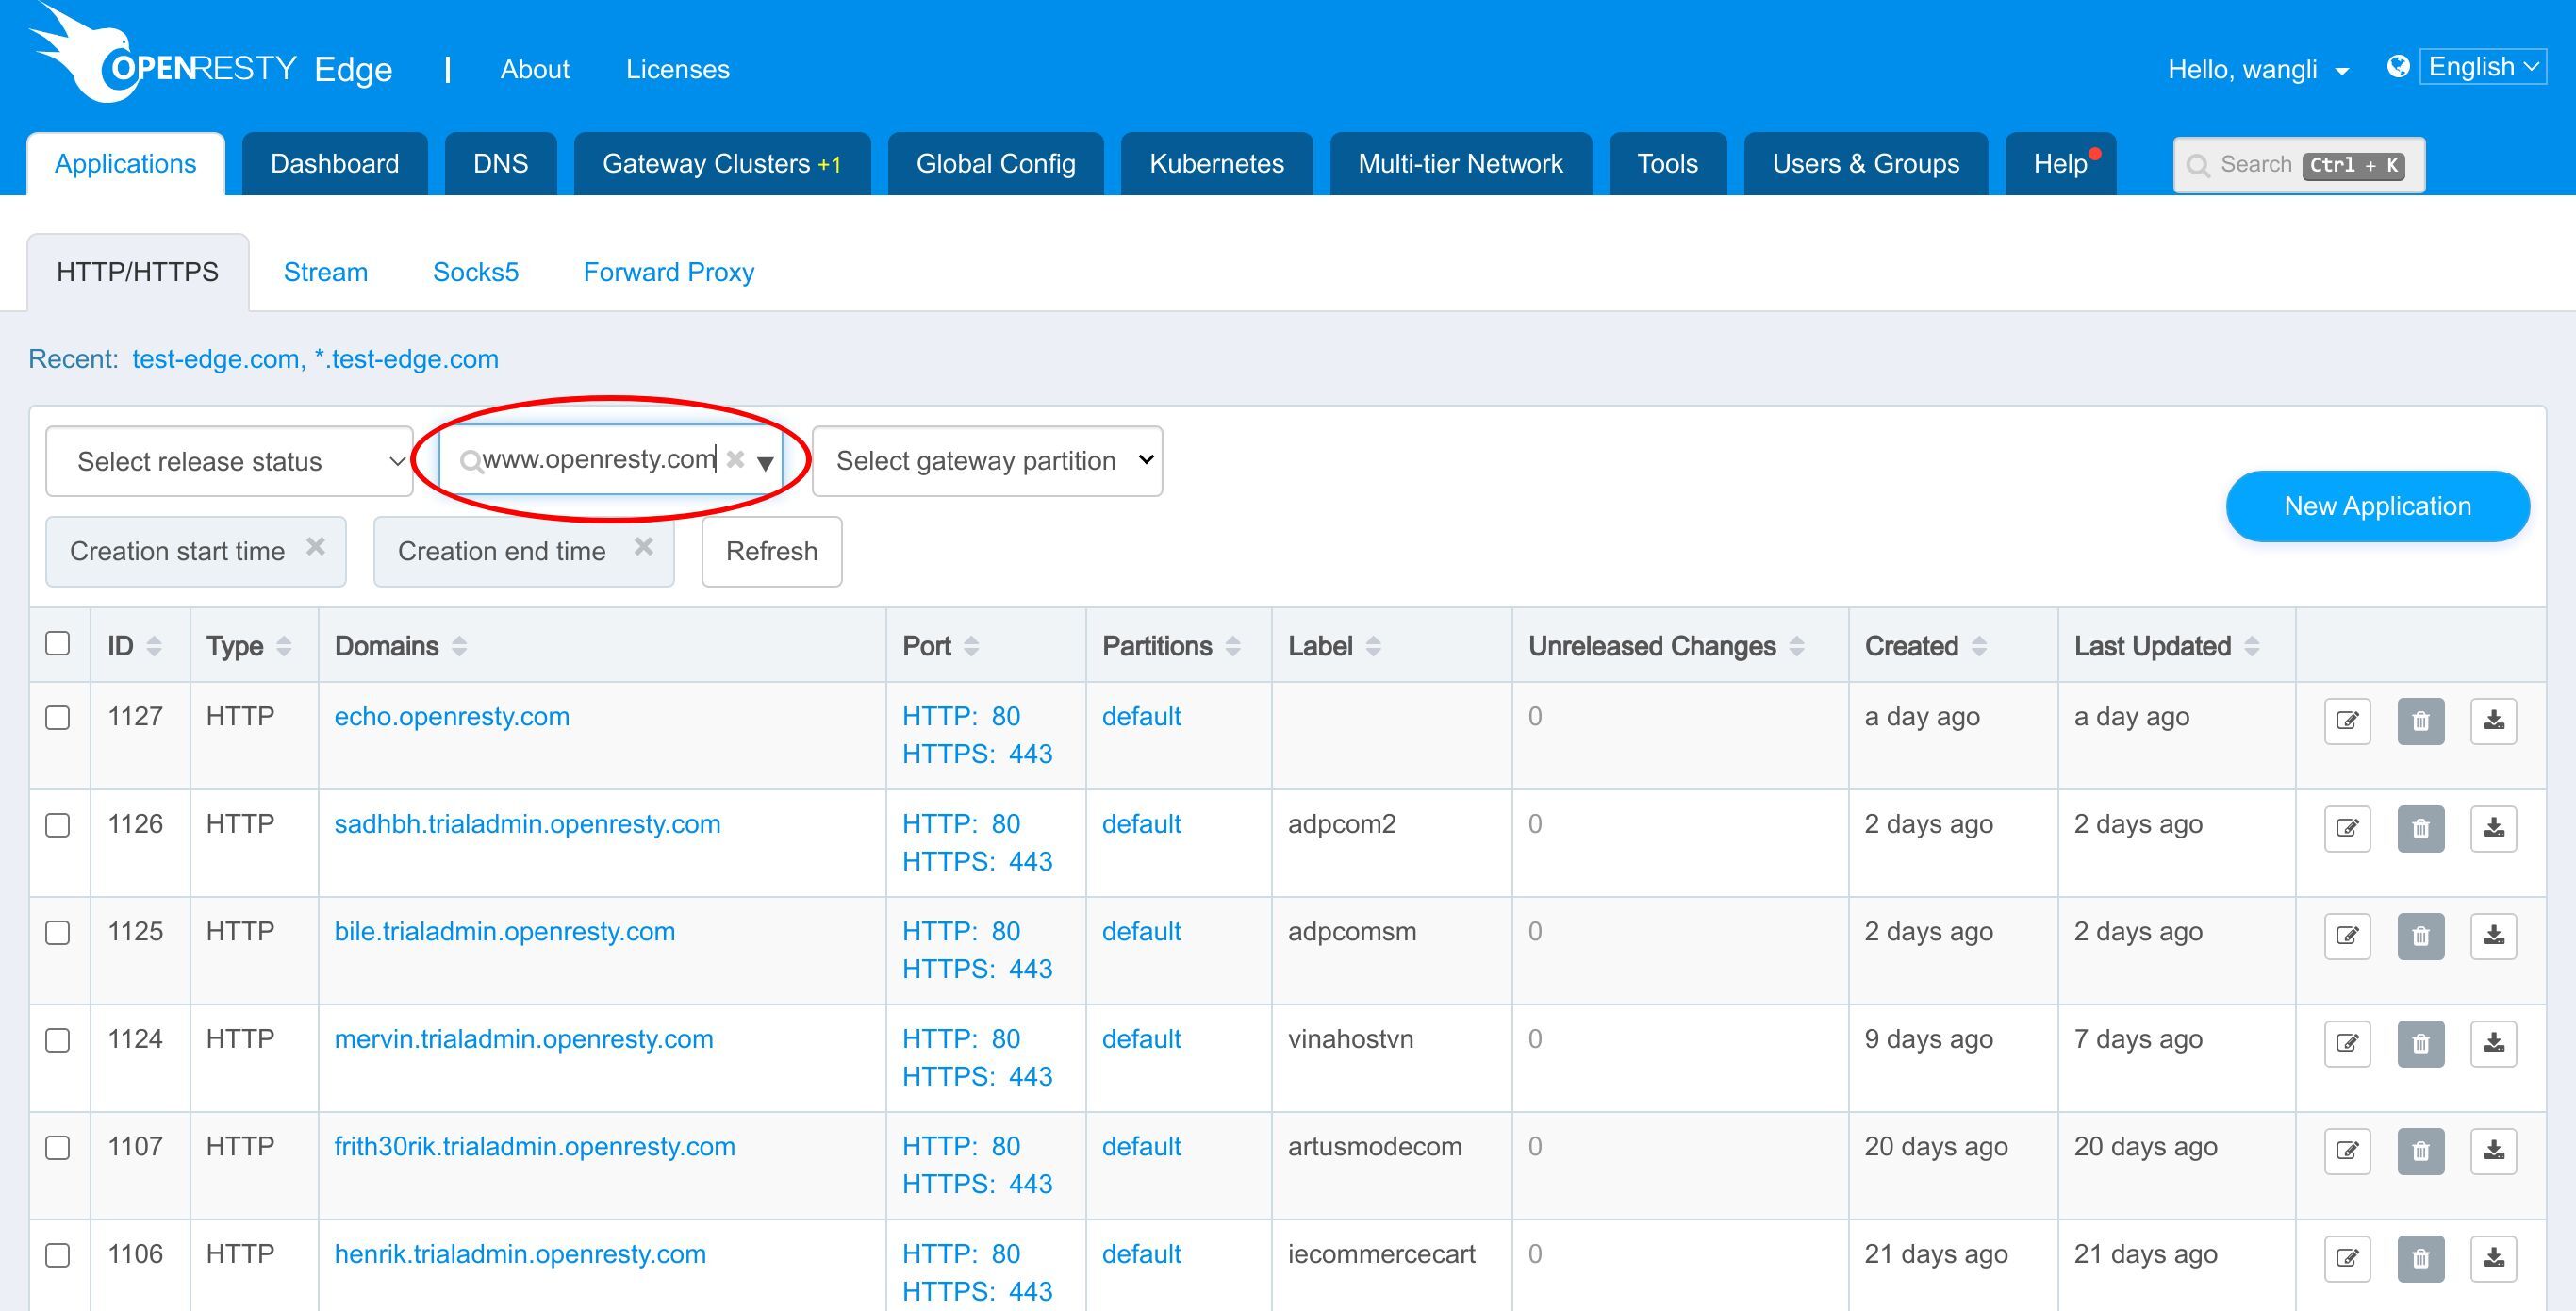
Go to the page.
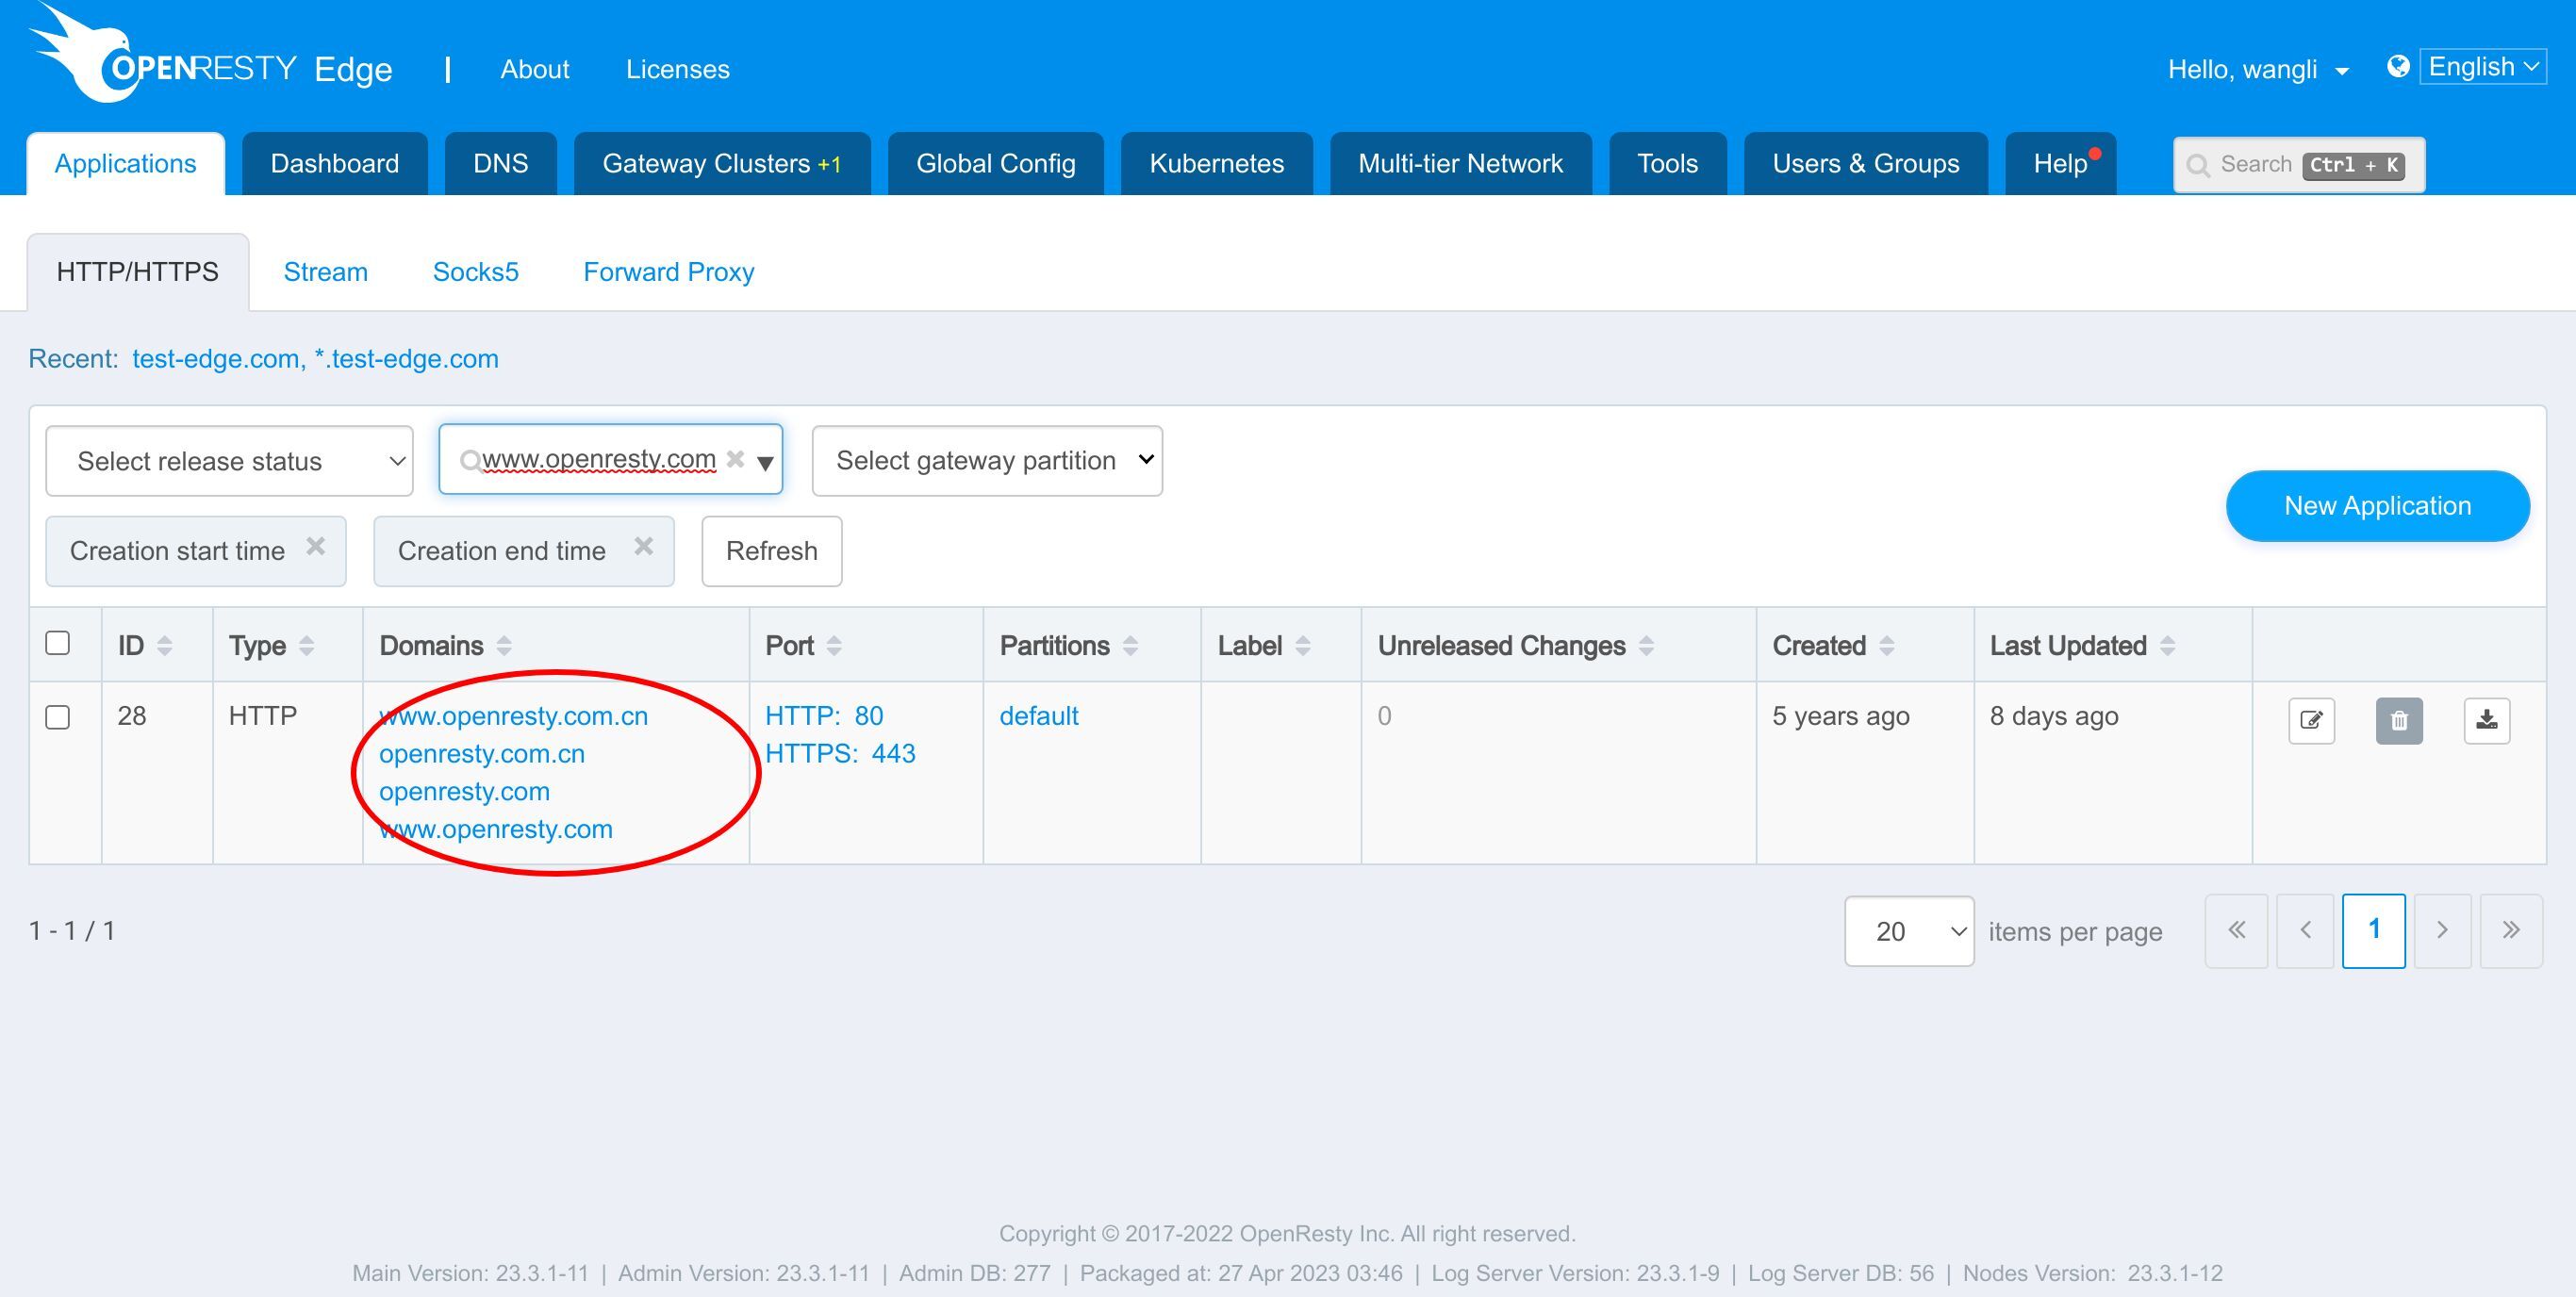
Go to the error logs page. There are more error logs recorded here.
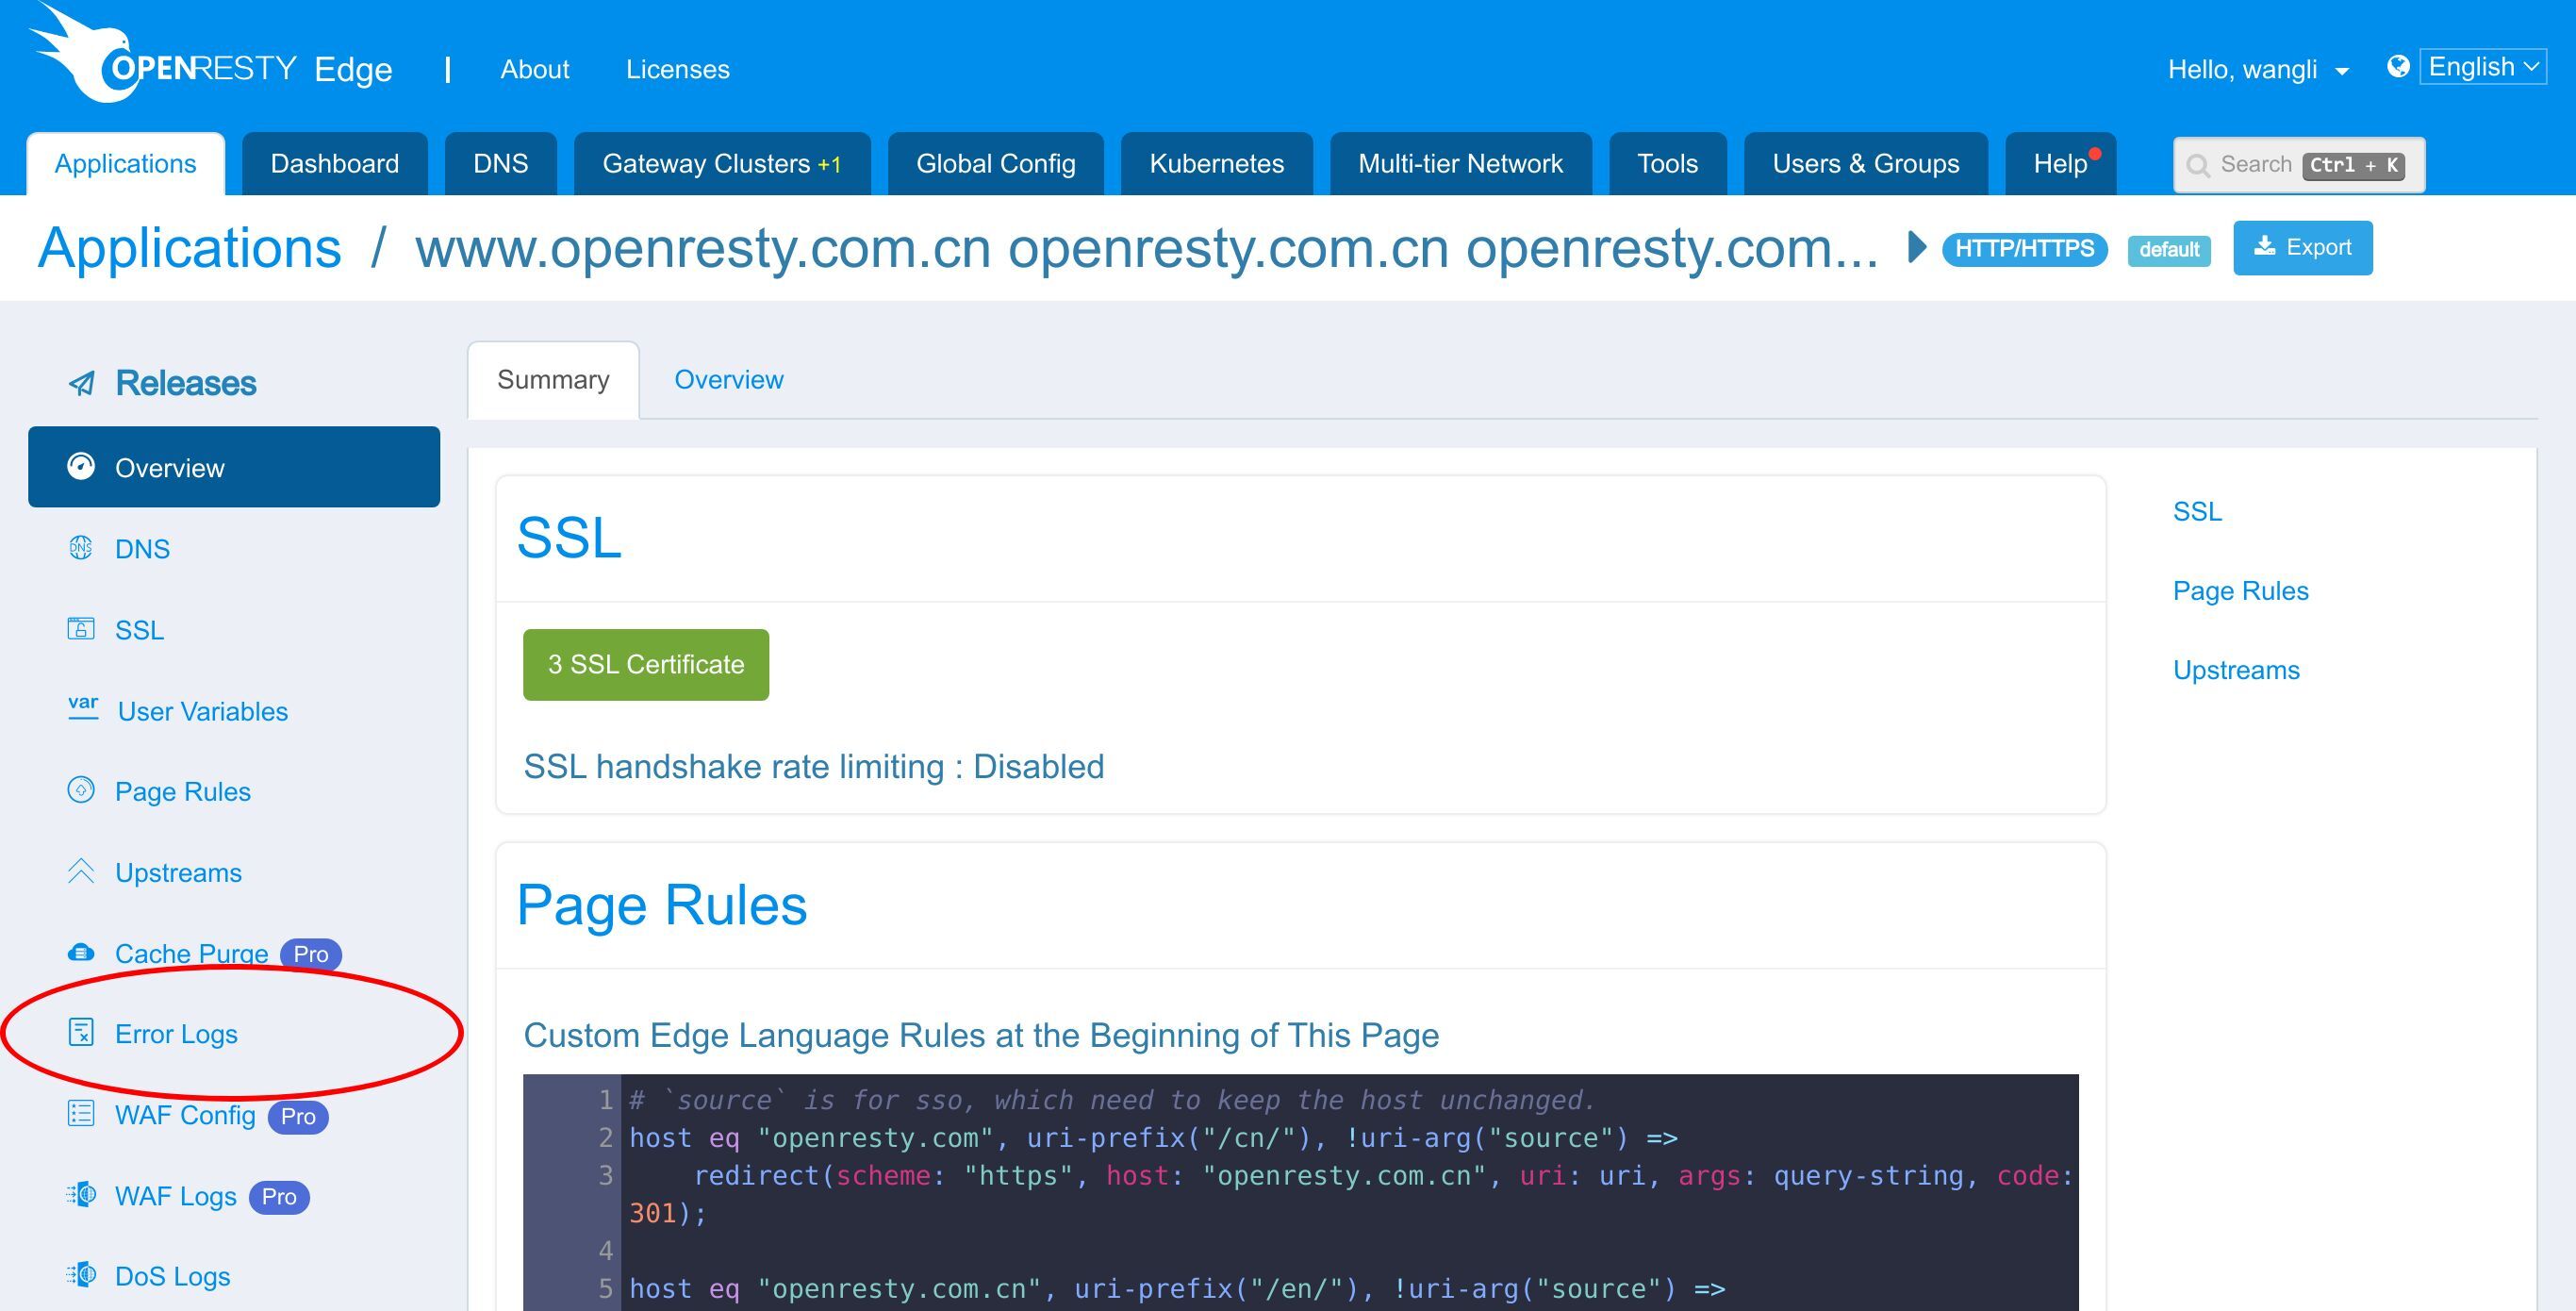
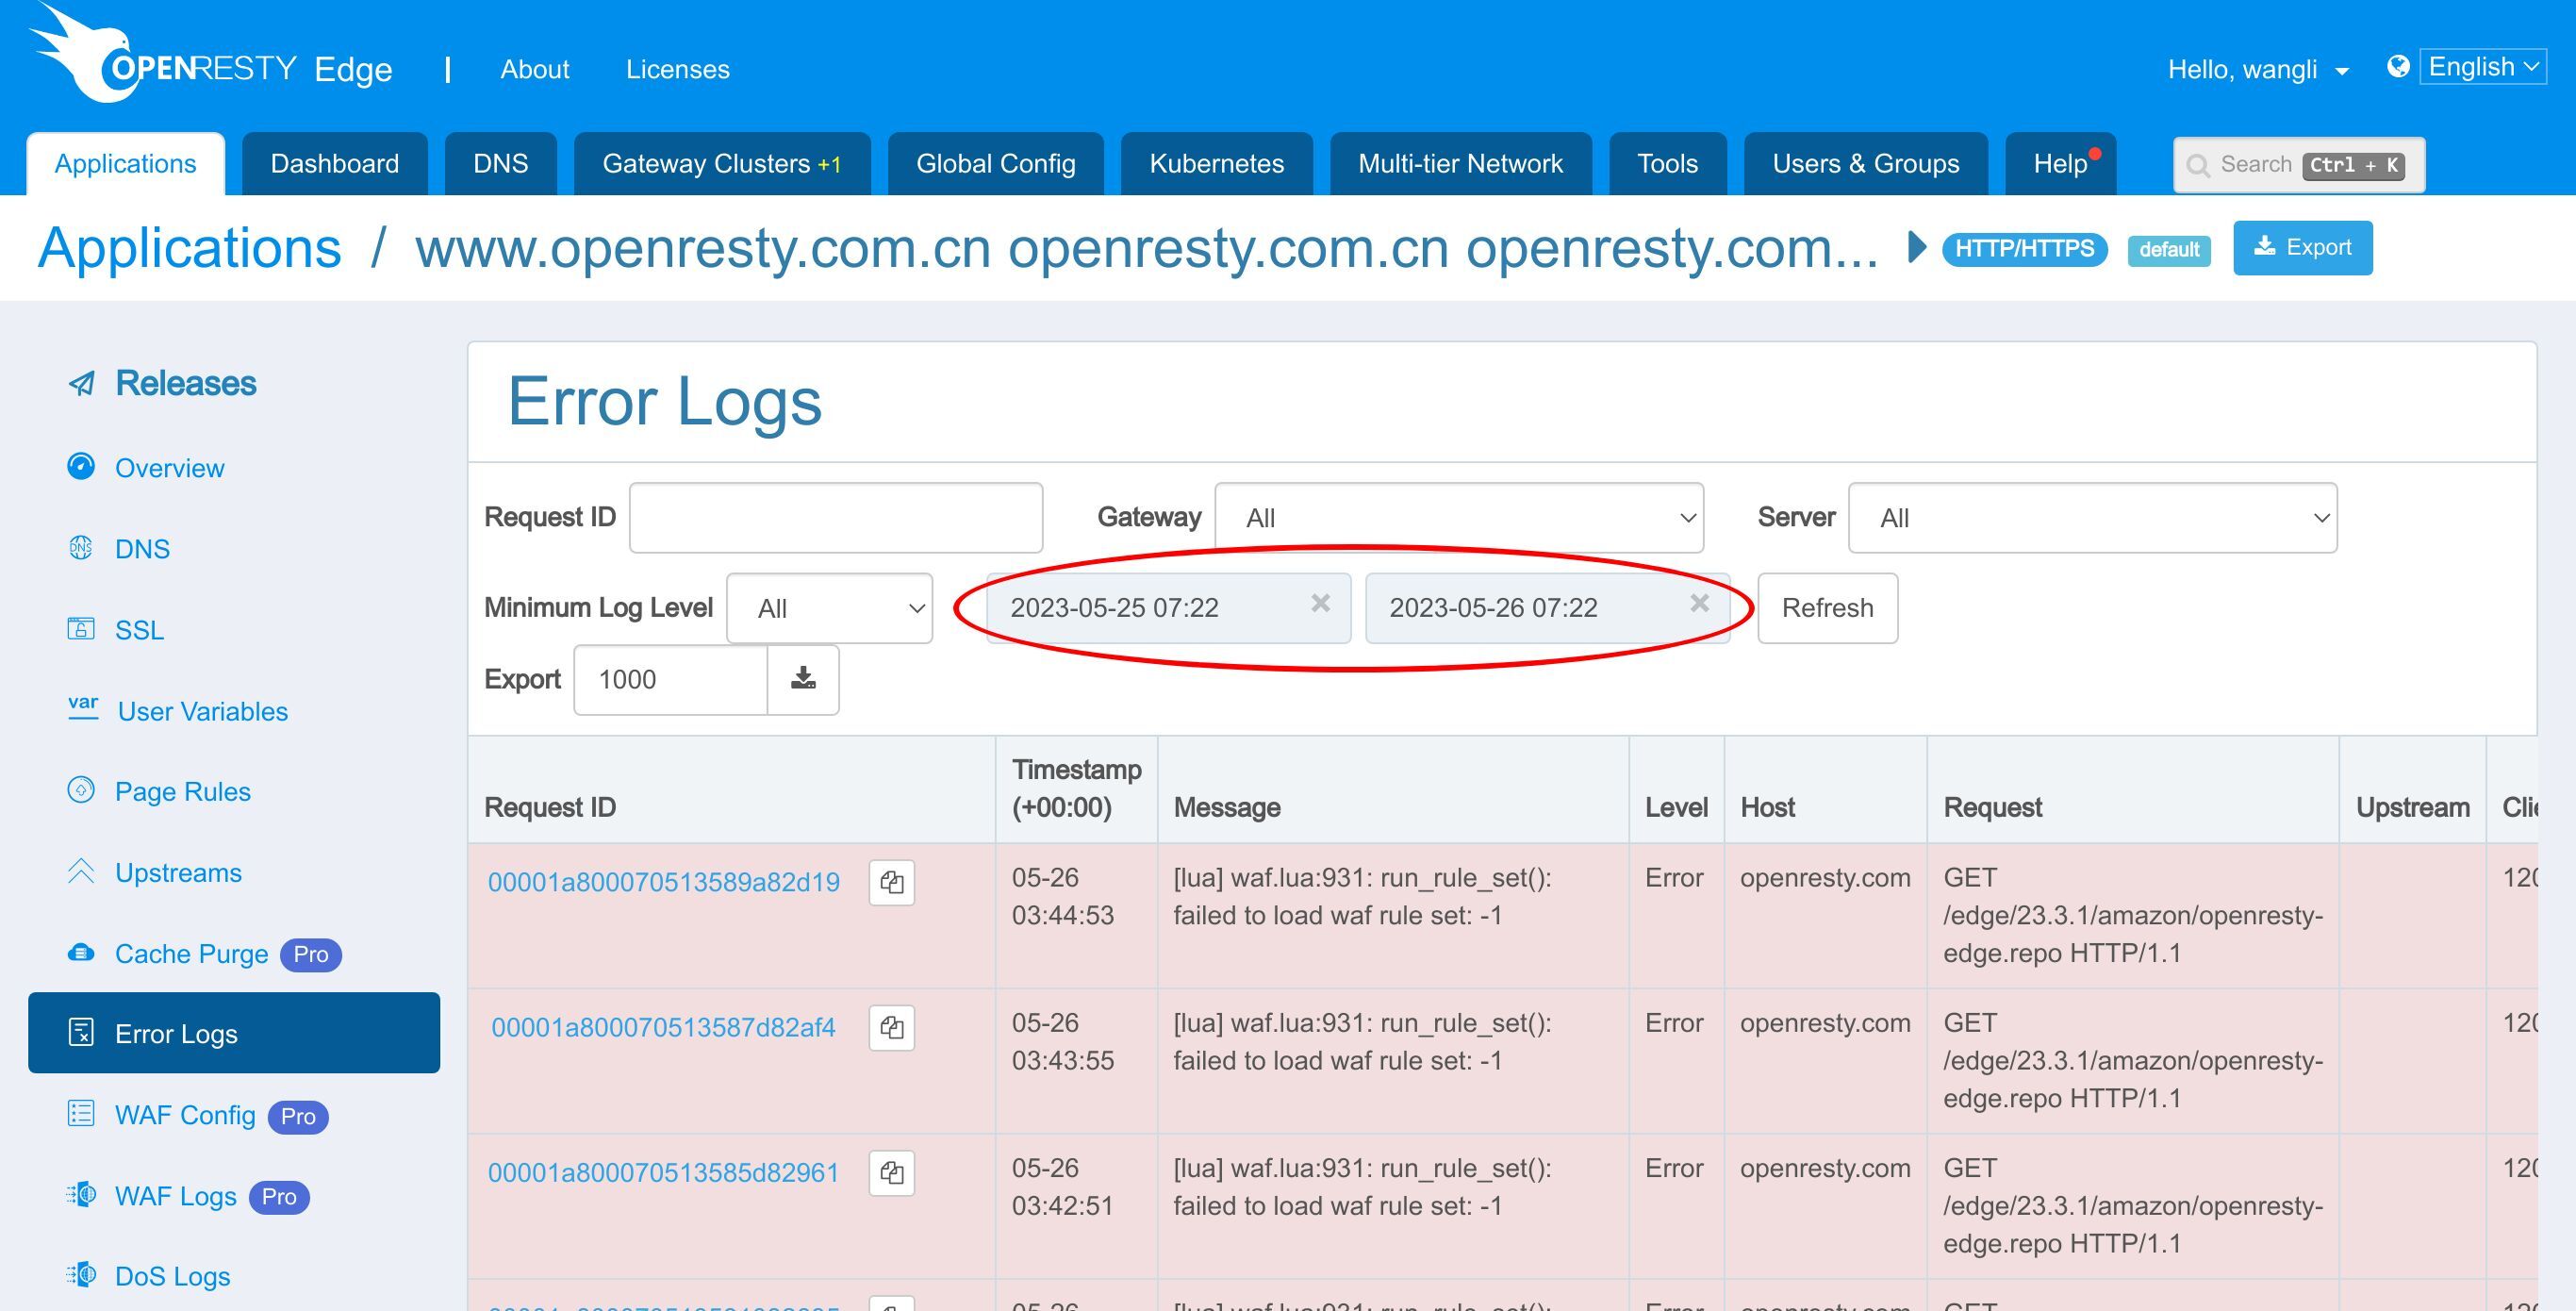
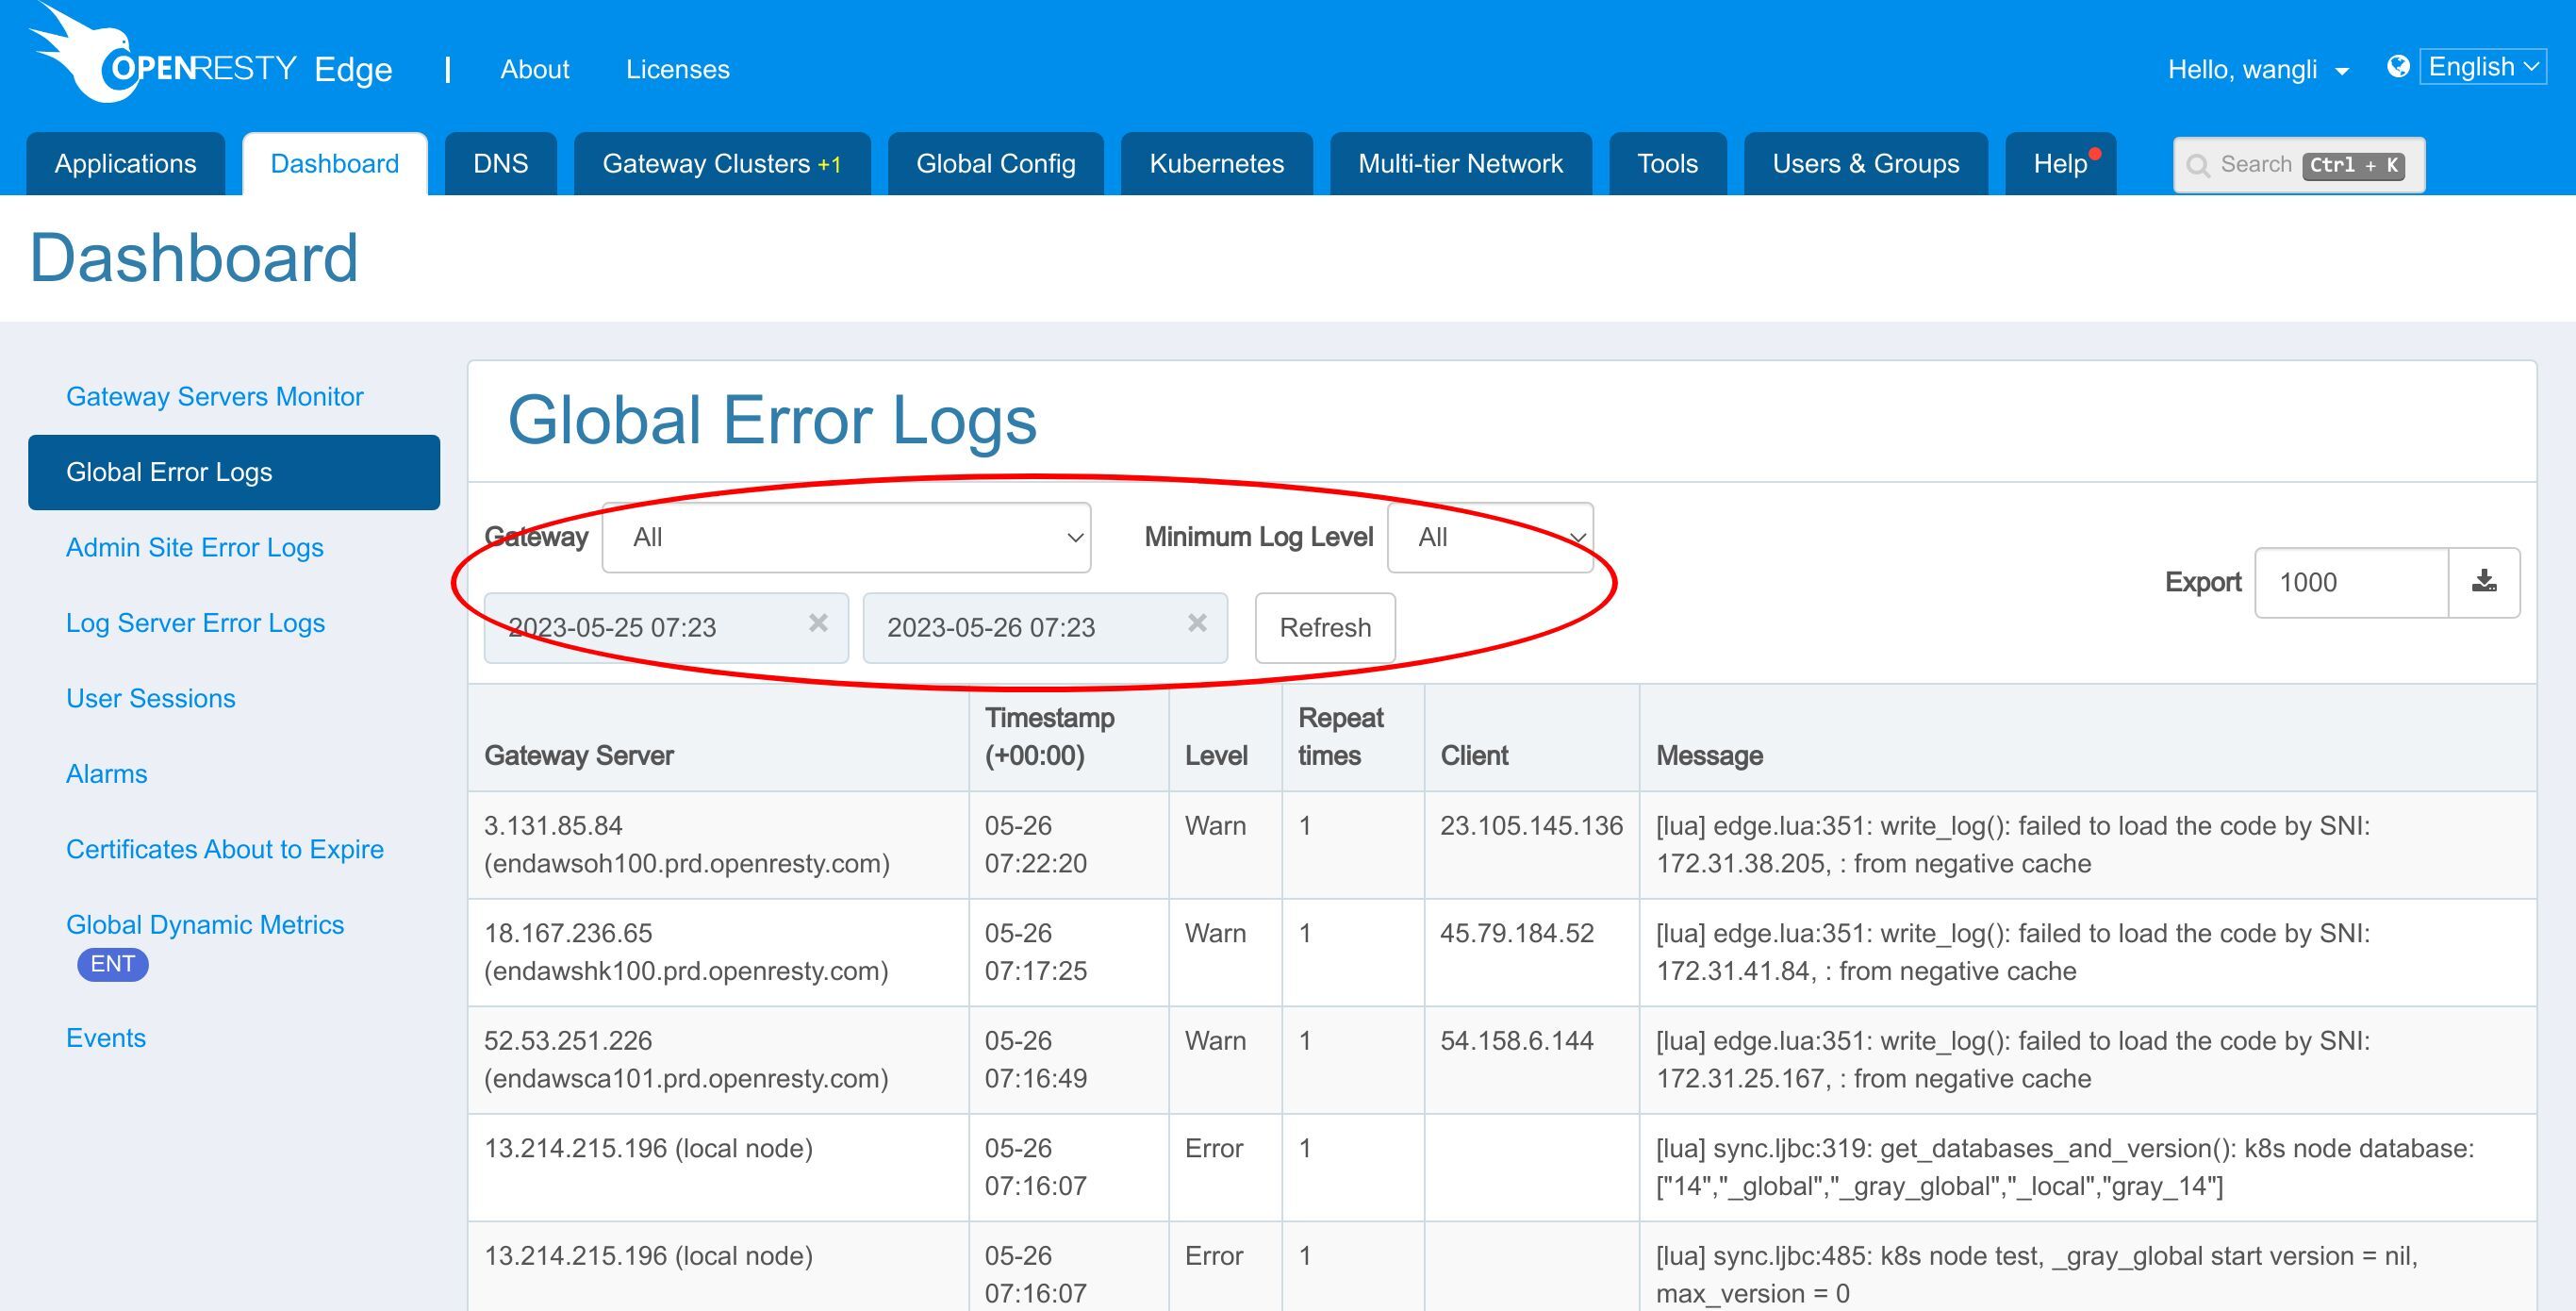
This filtering query condition is conducive to locating the problem.
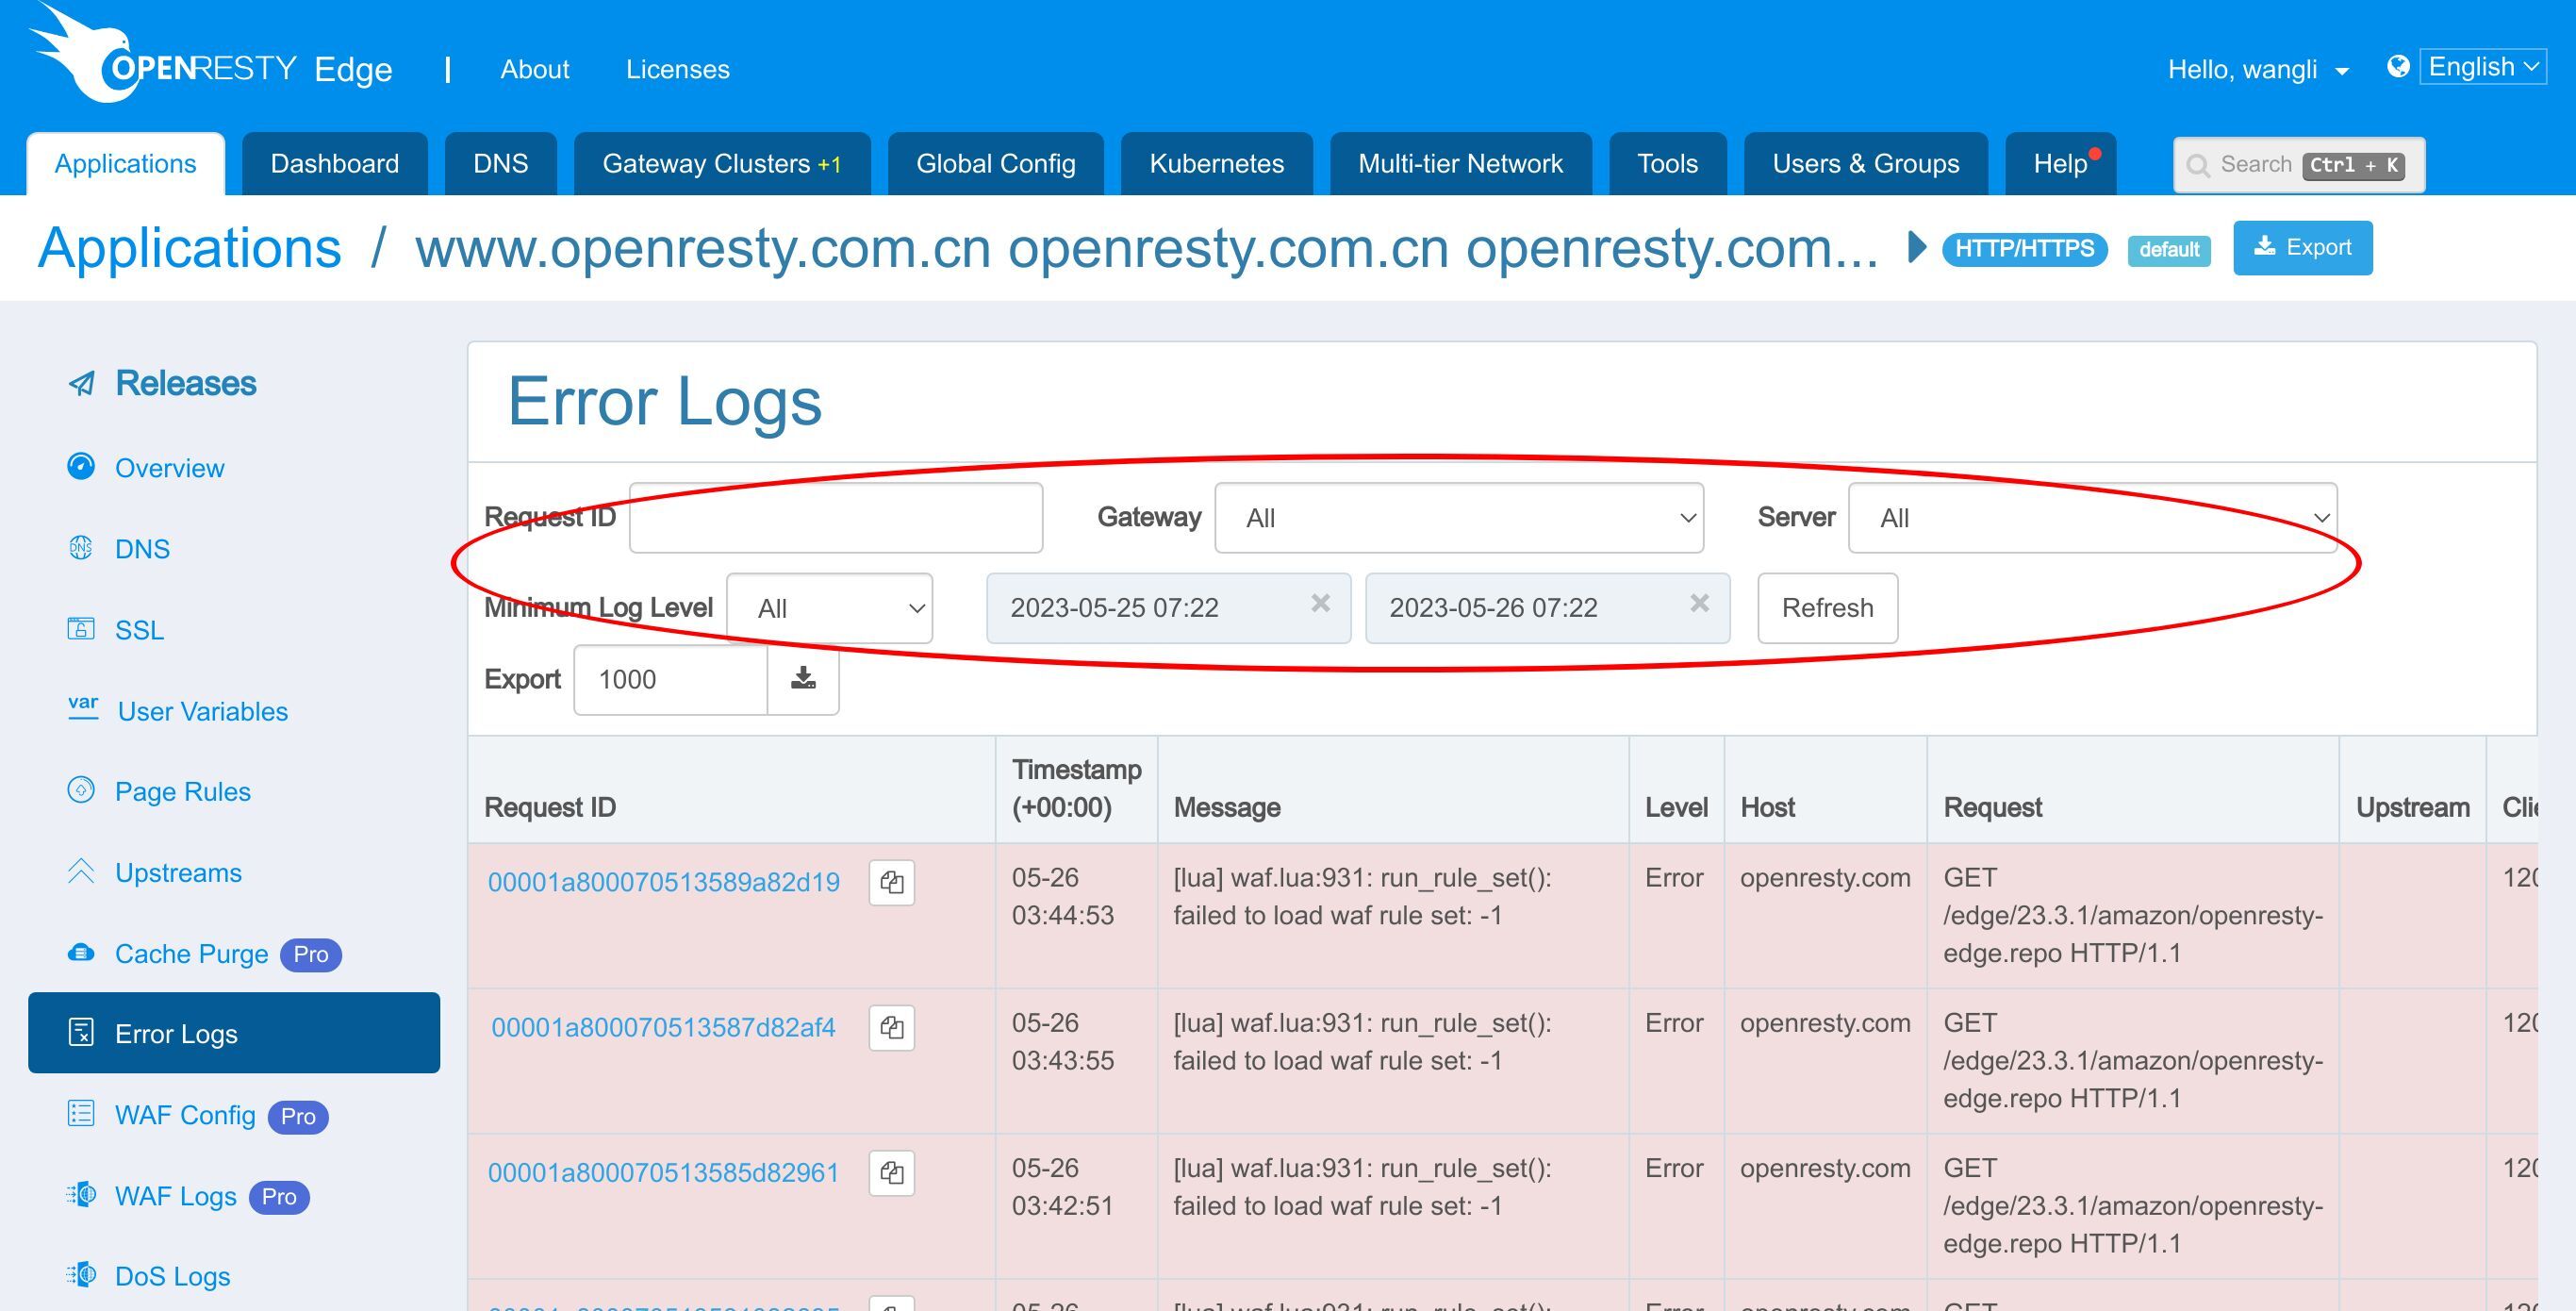
We can filter the messages by request ID.
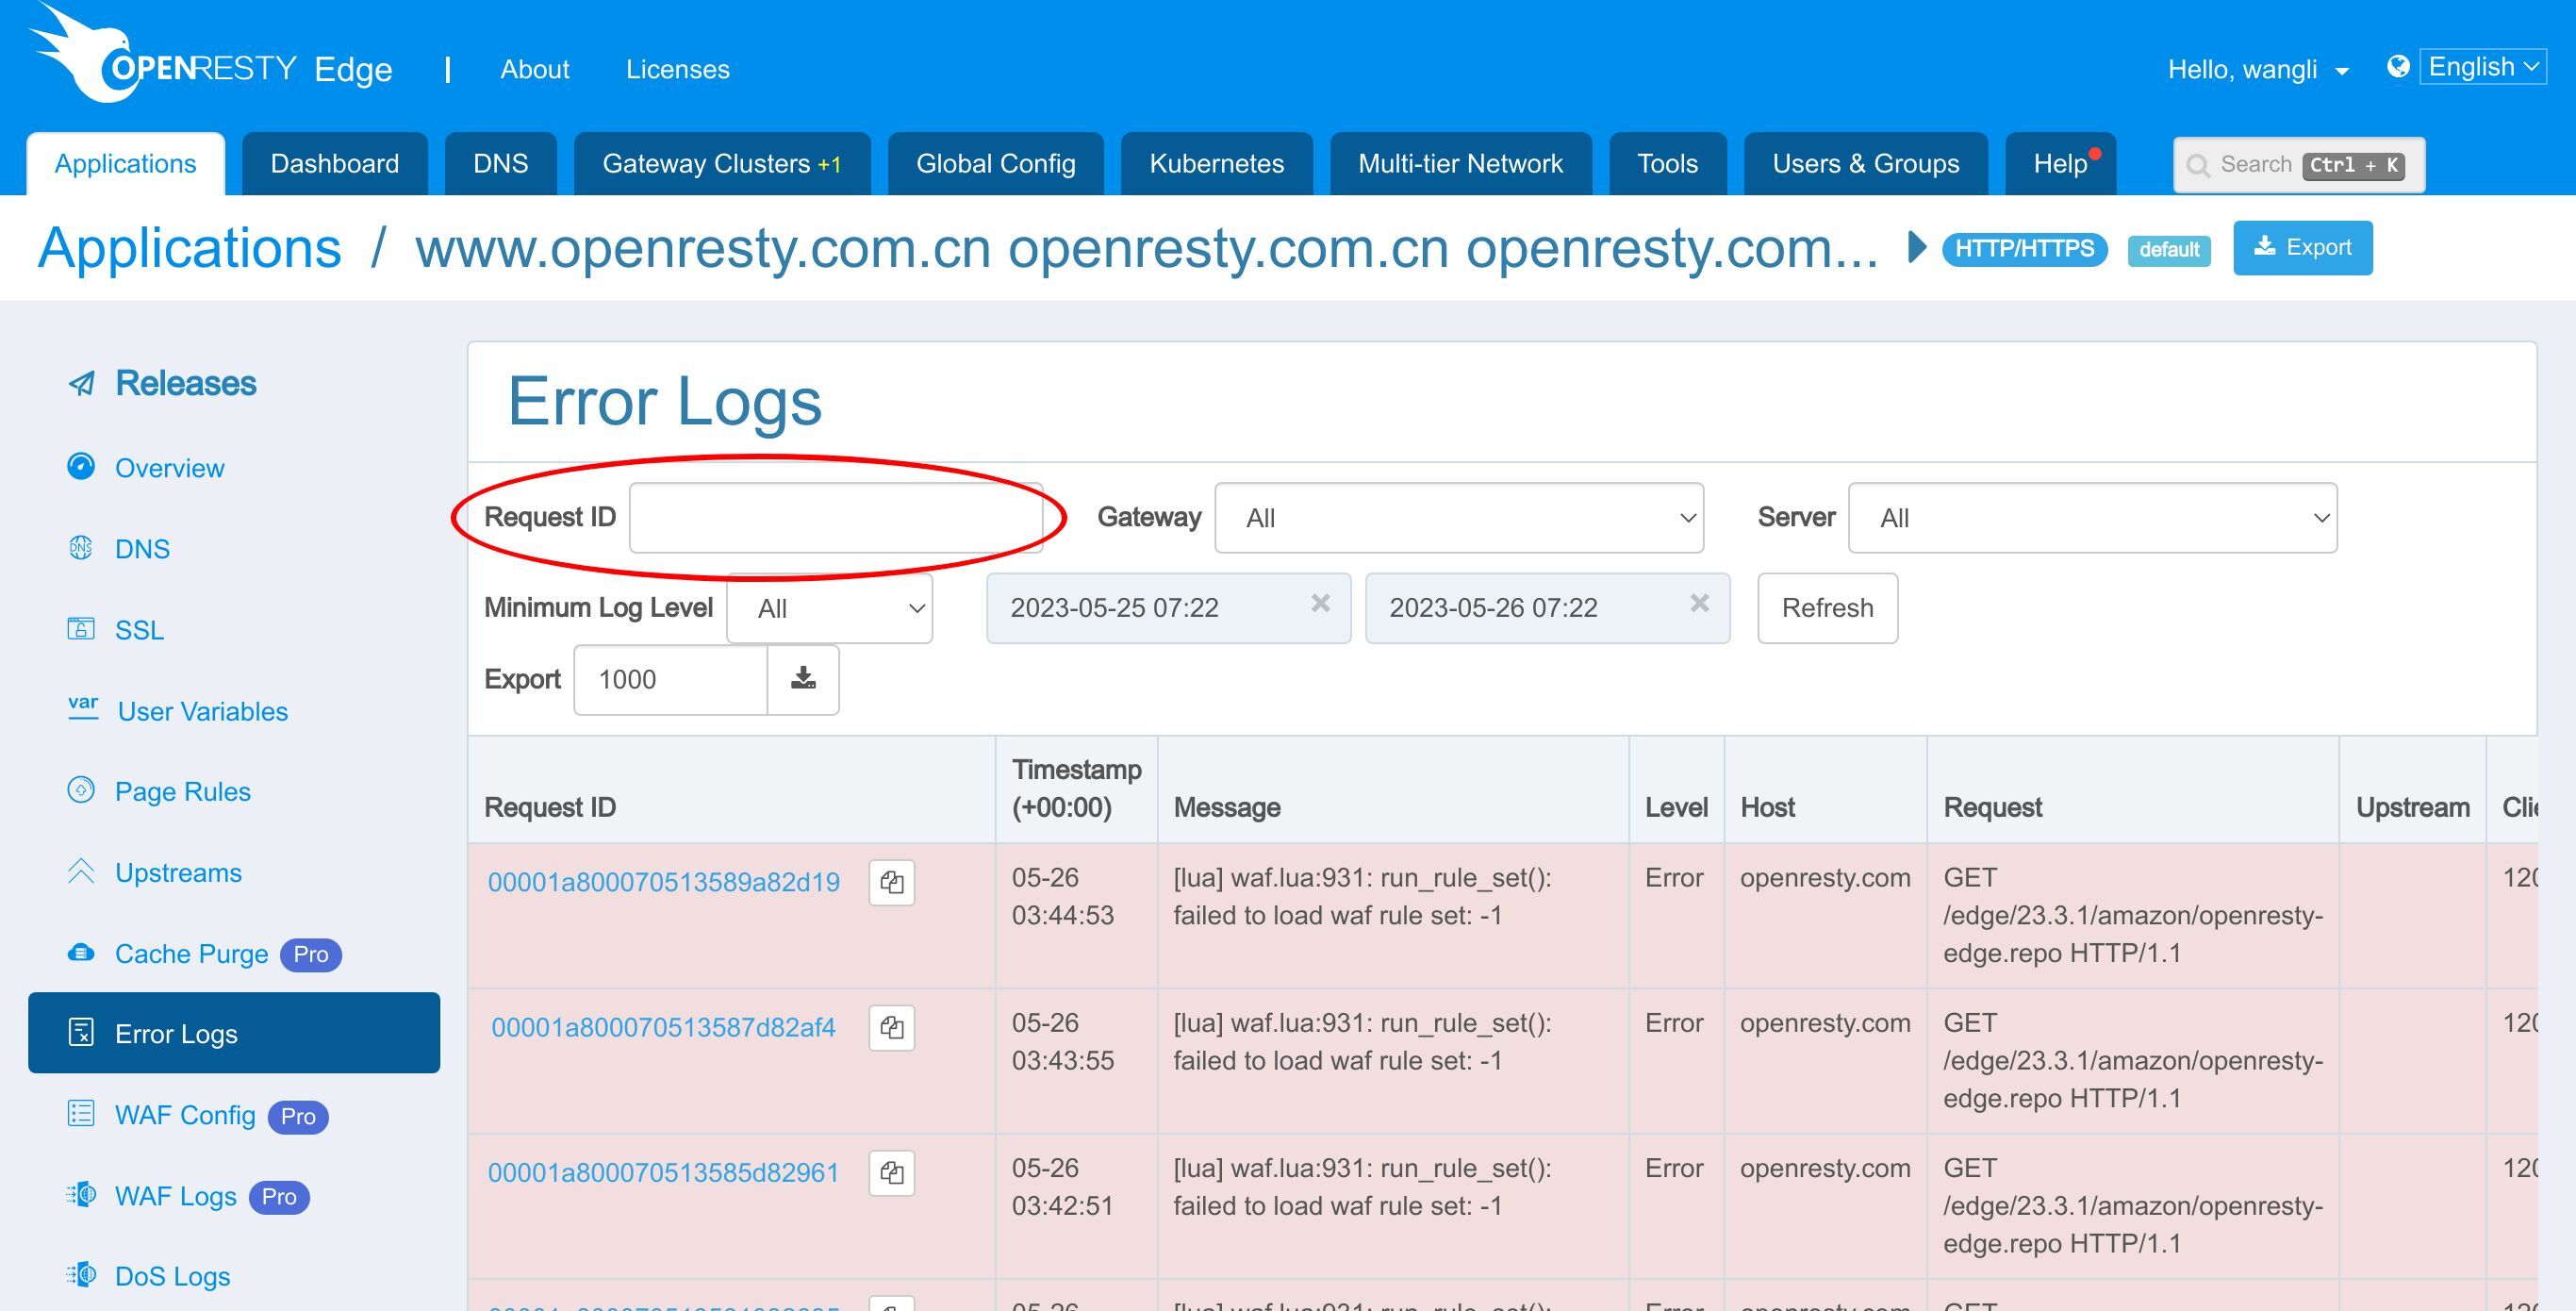
Gateway.
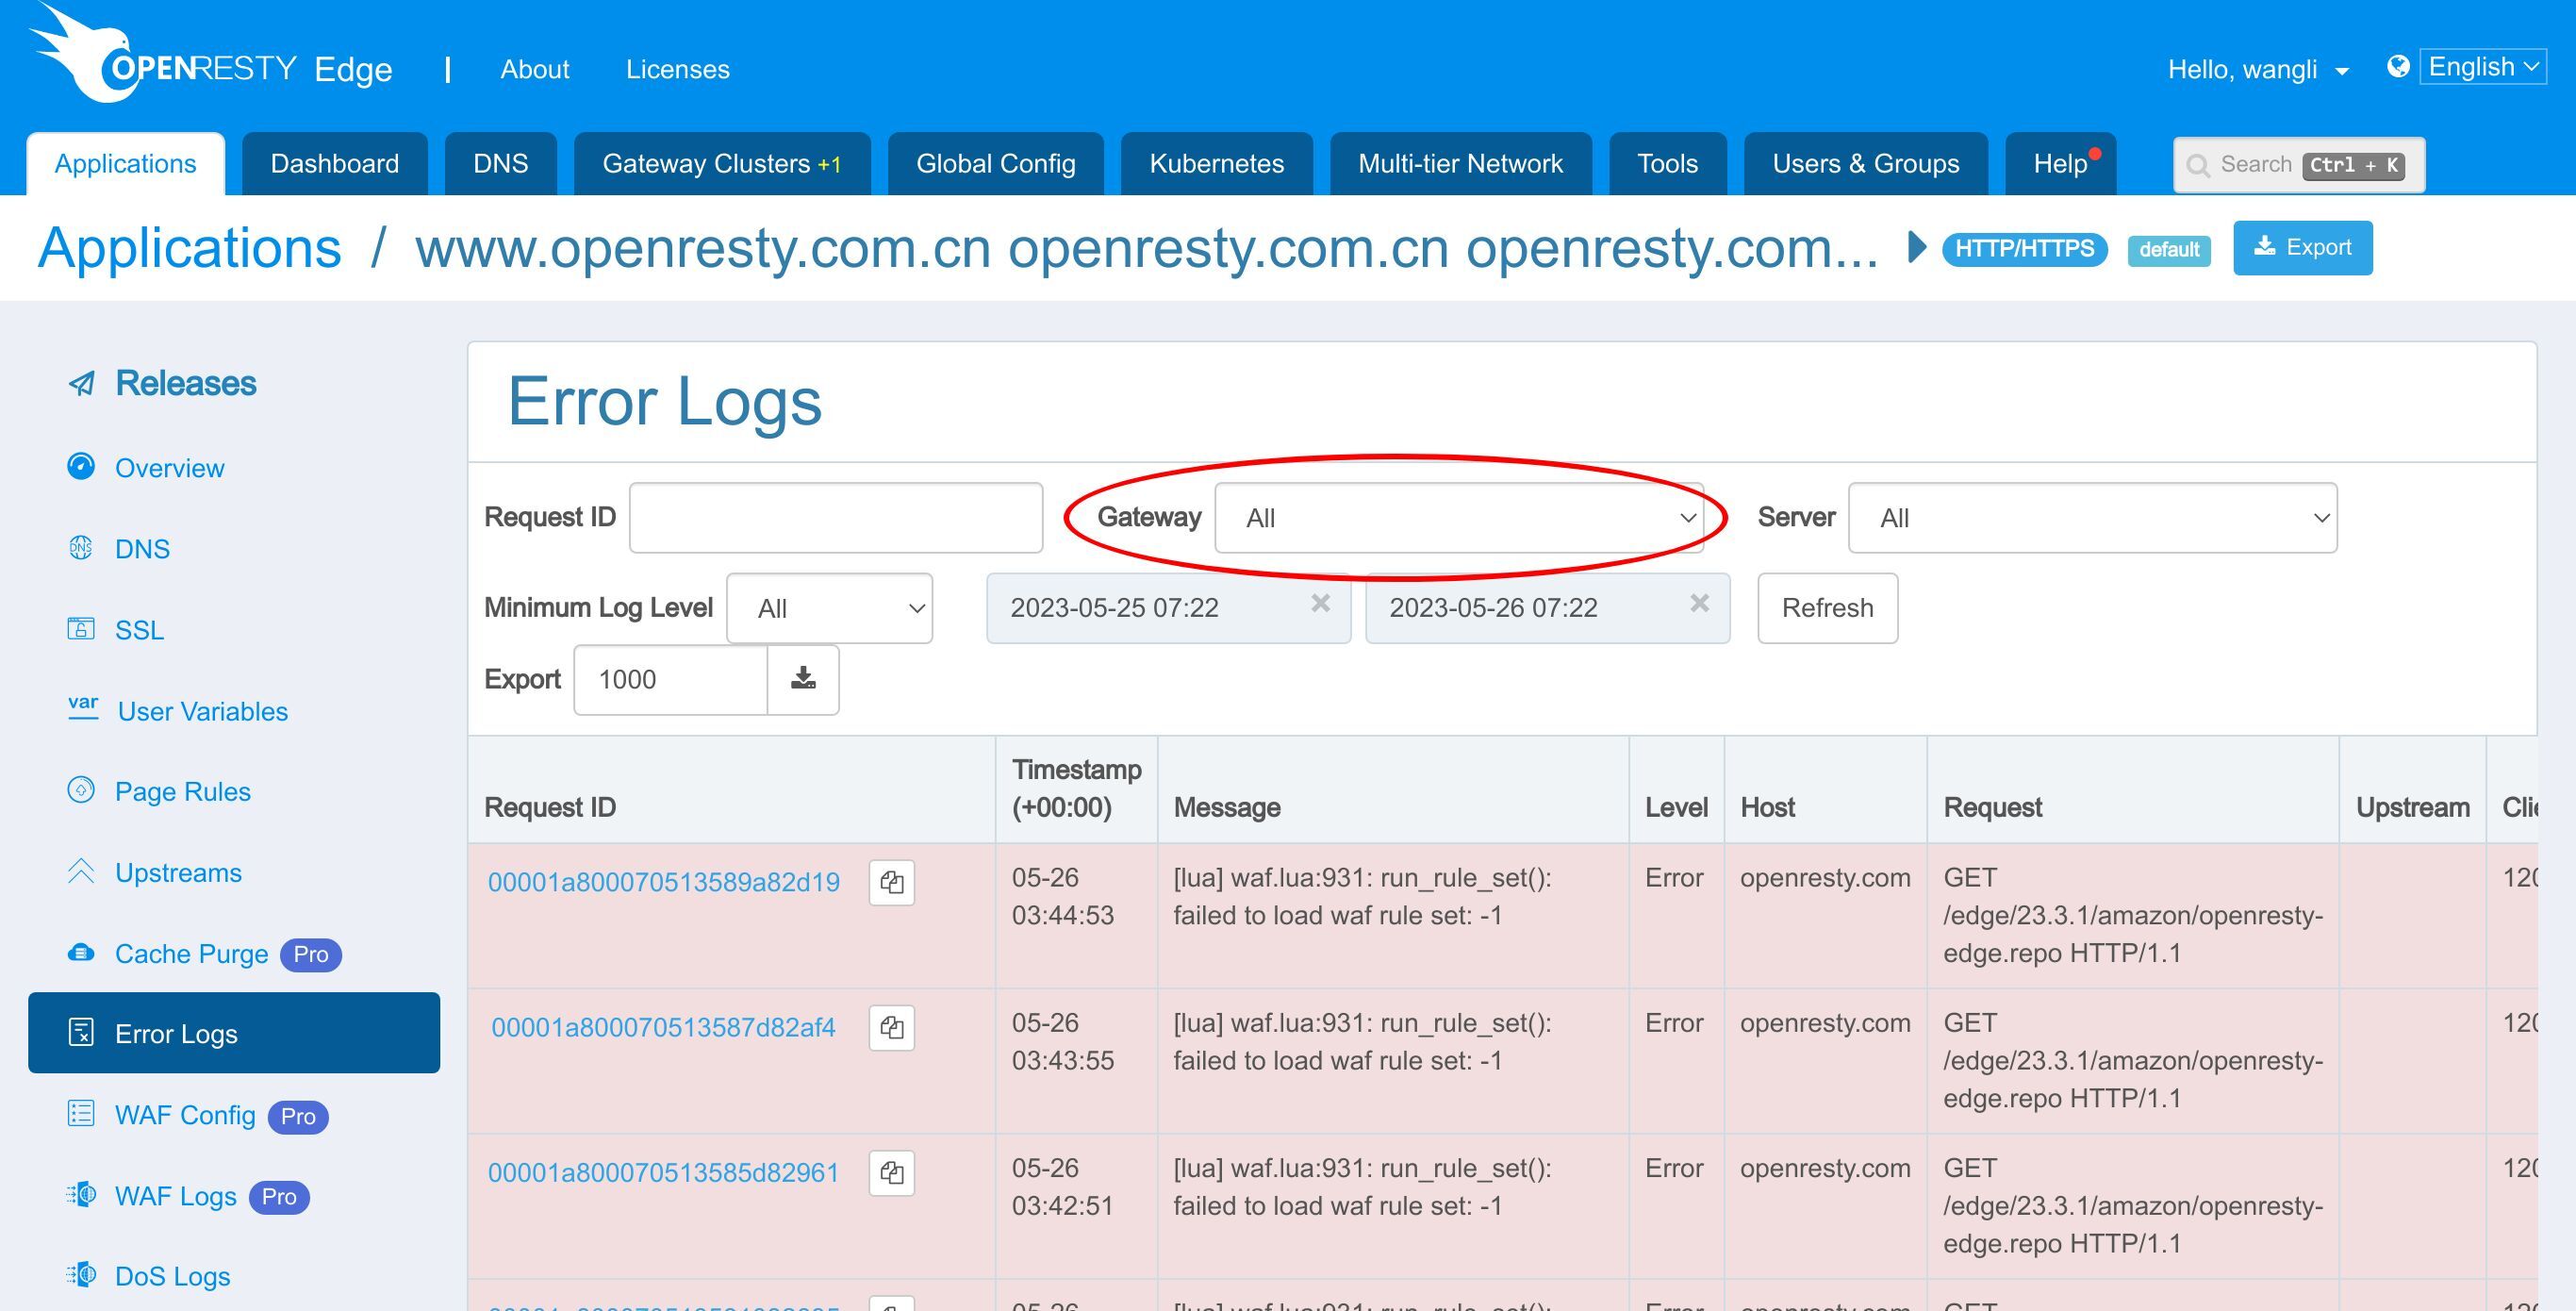
Server.
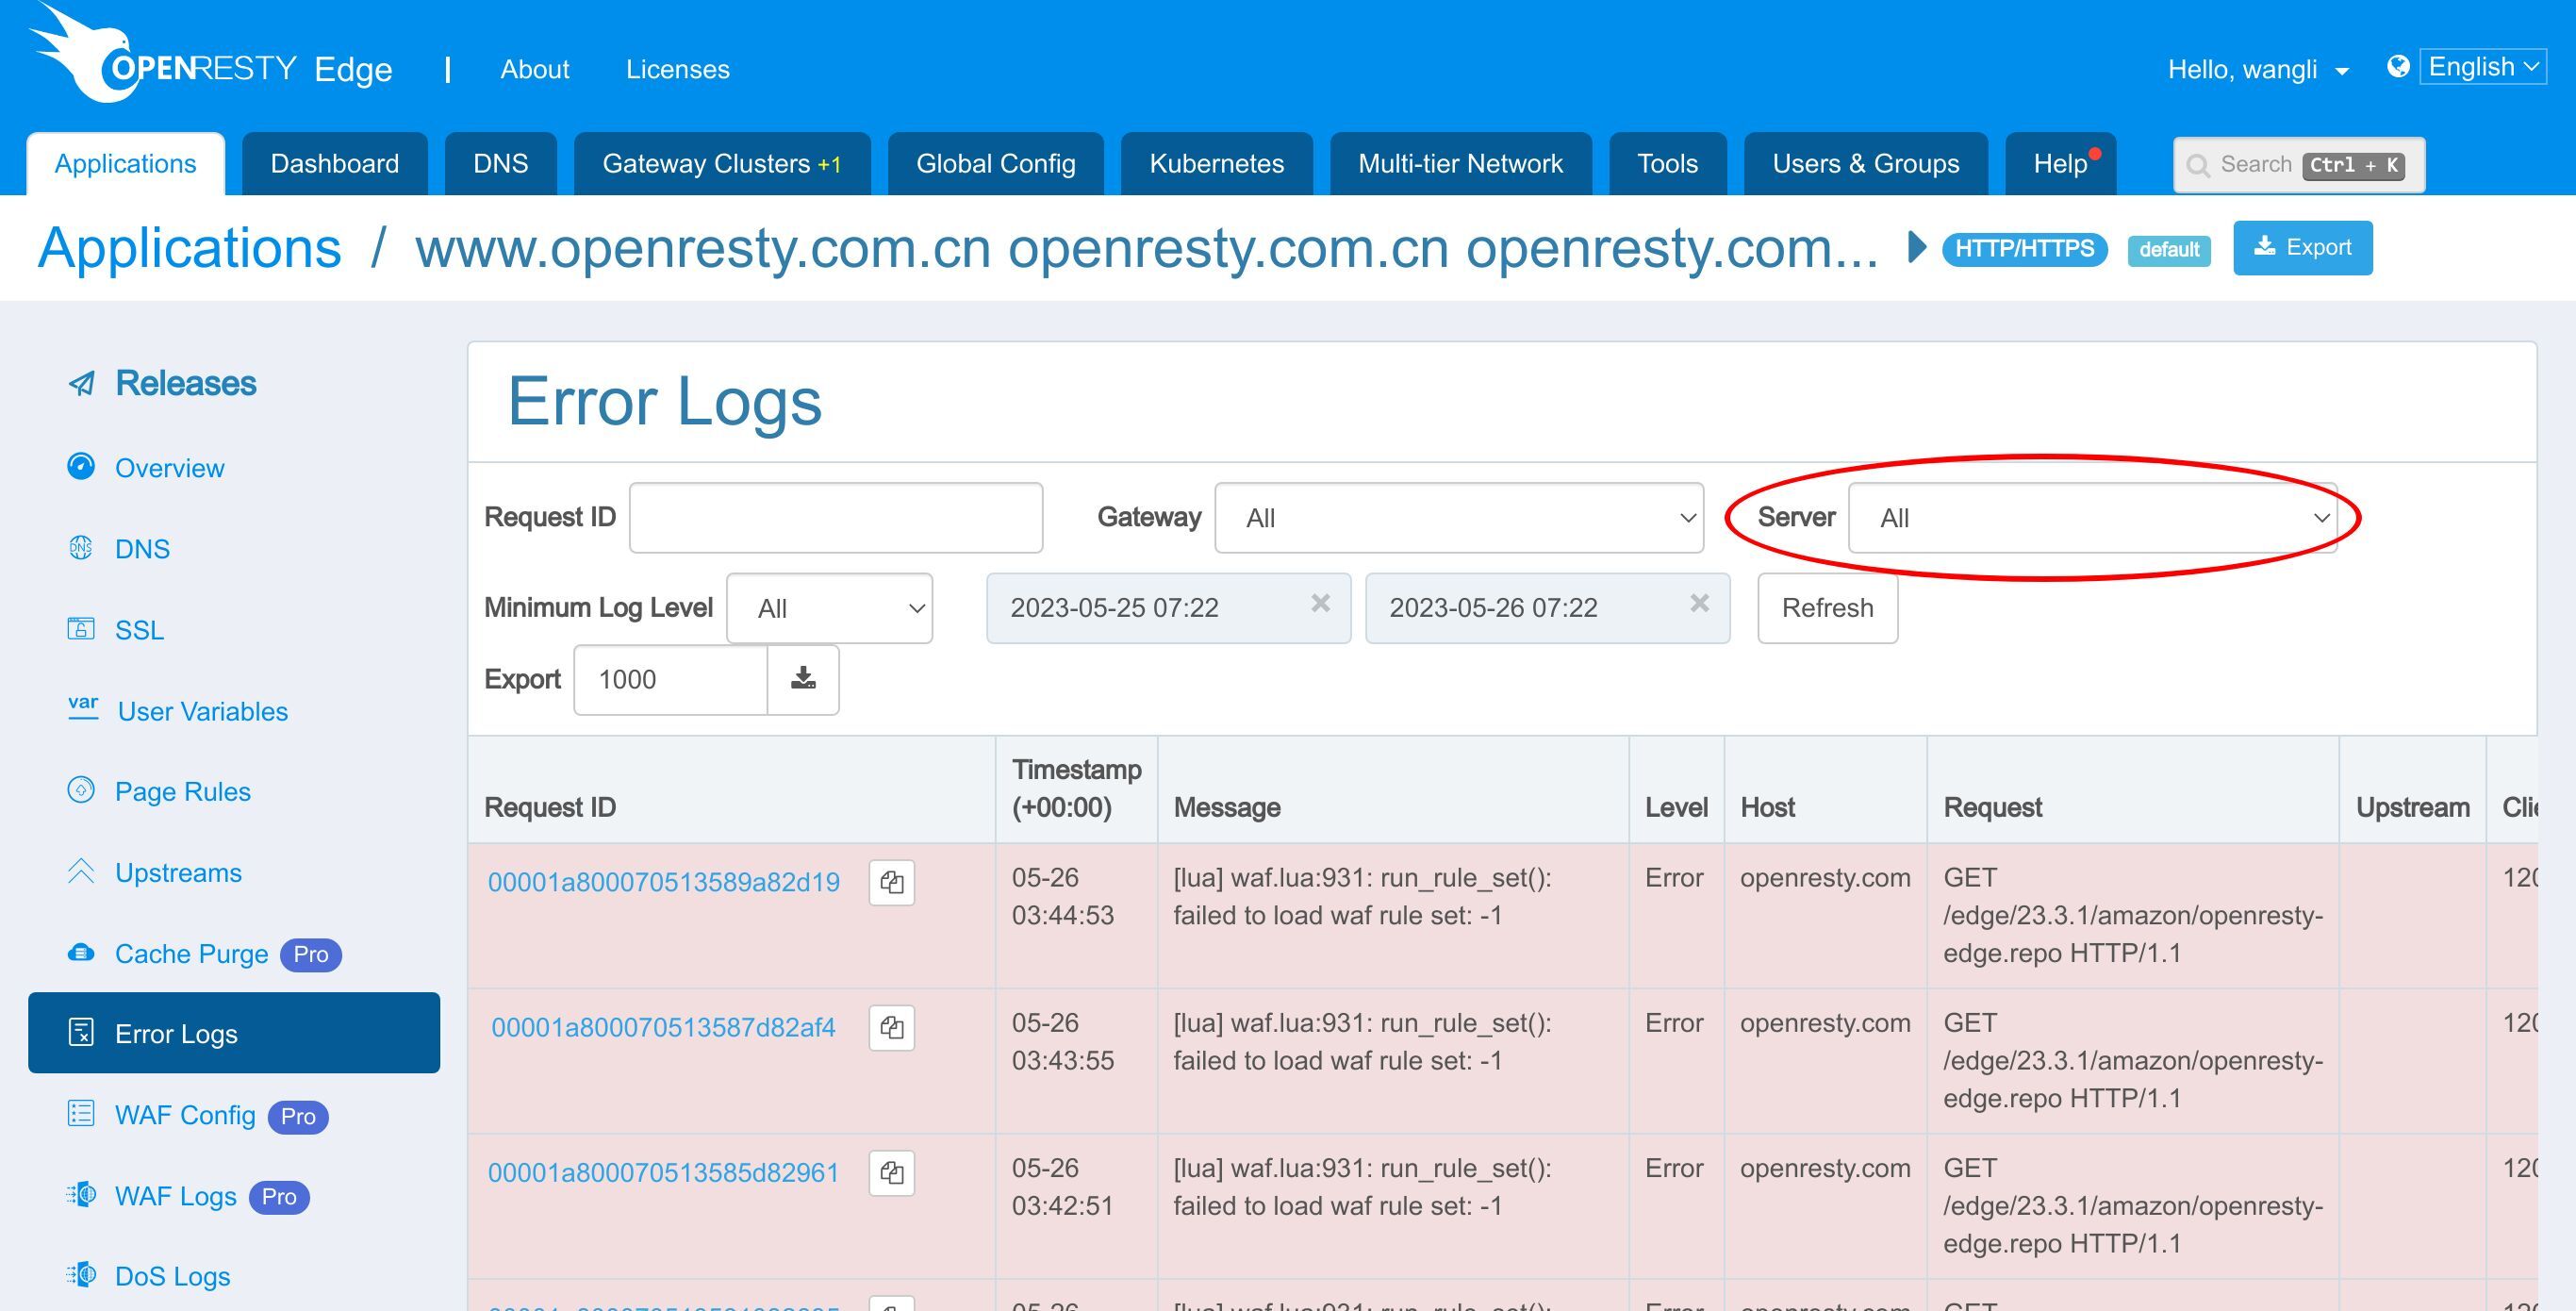
Error log level.
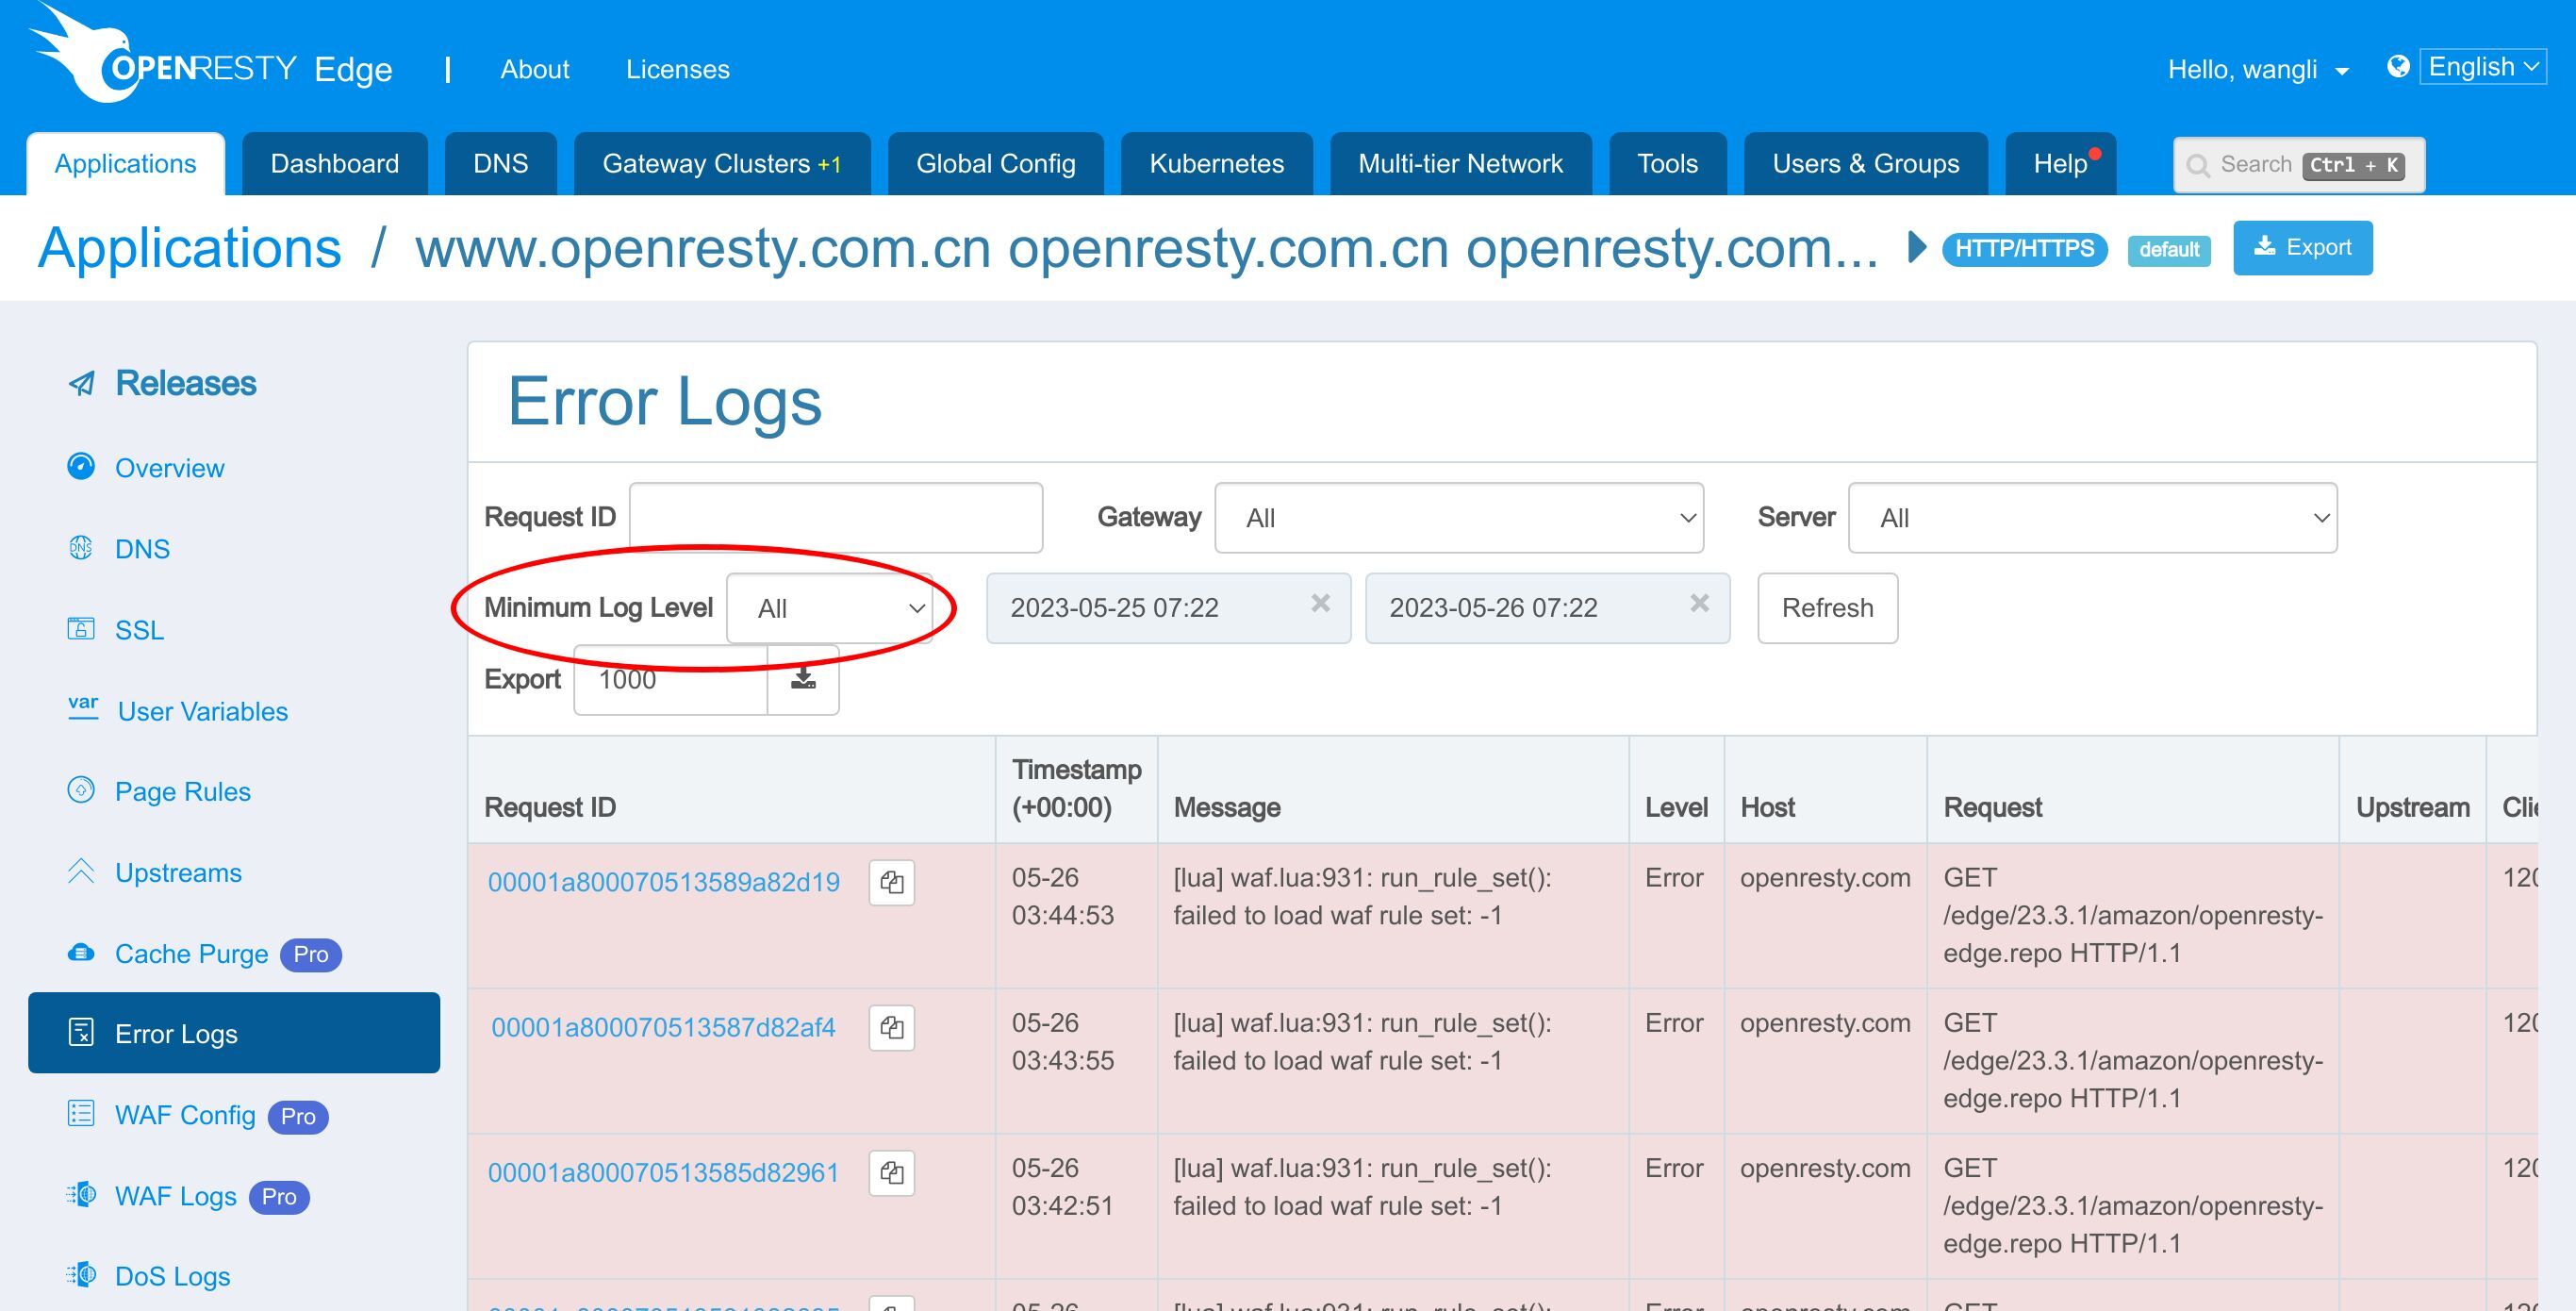
And time interval.
Let’s try filtering messages by a gateway.
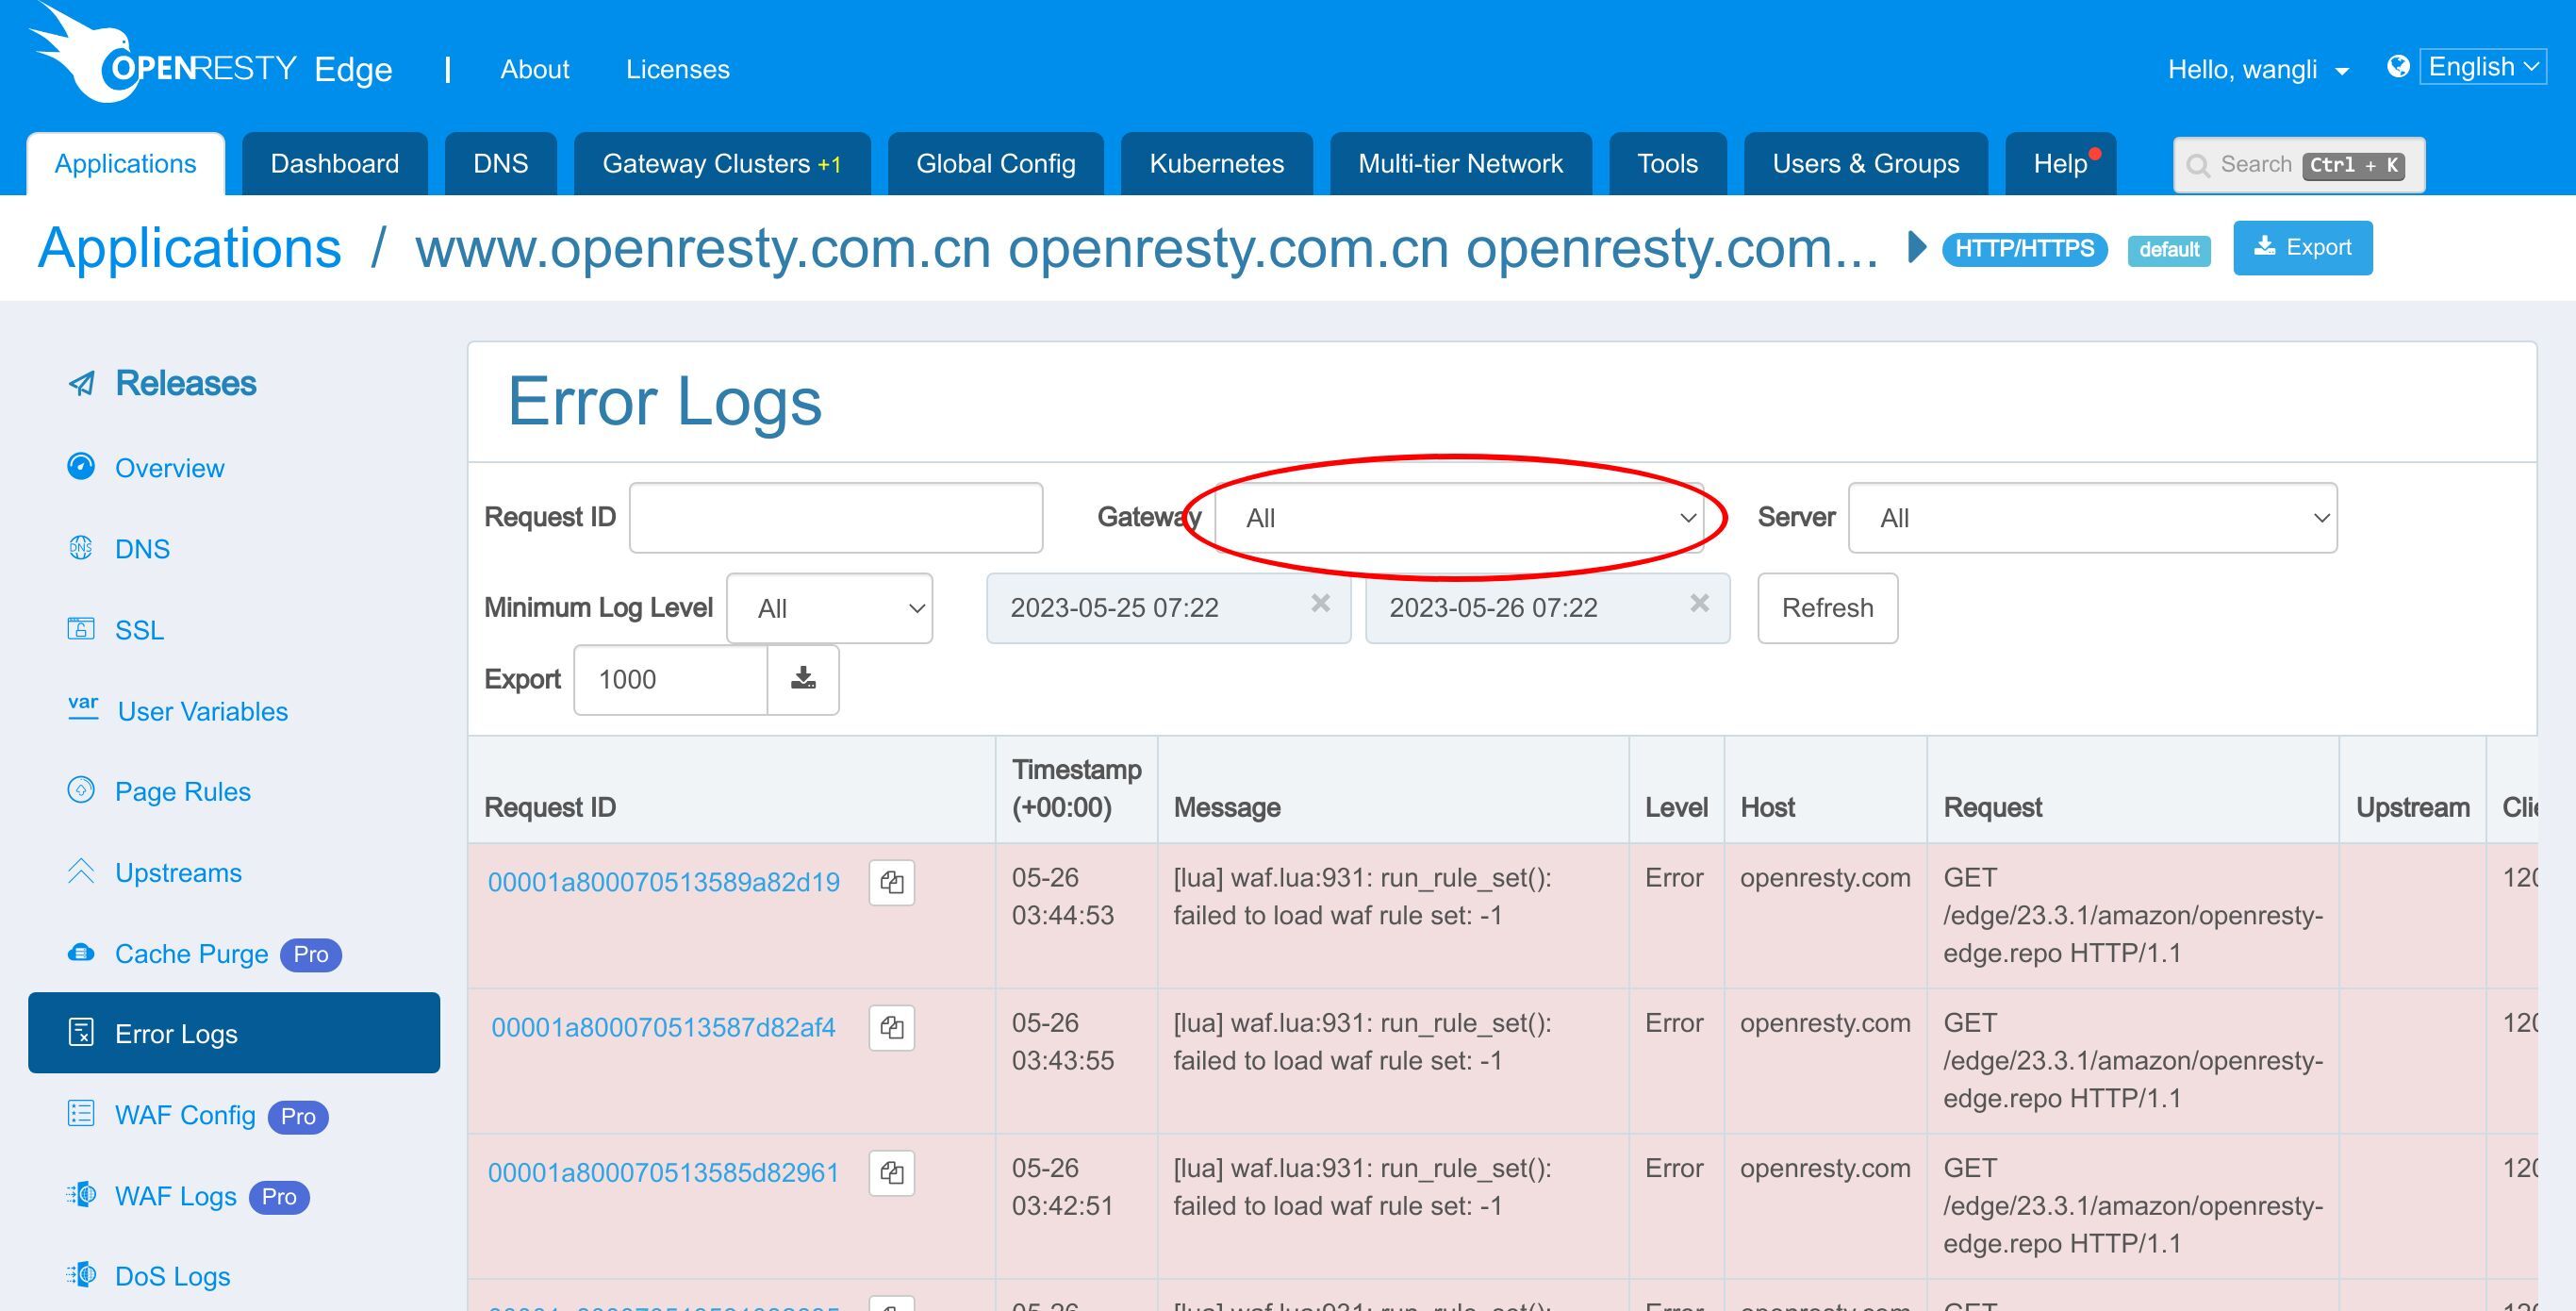
We select the aws-us-west gateway.
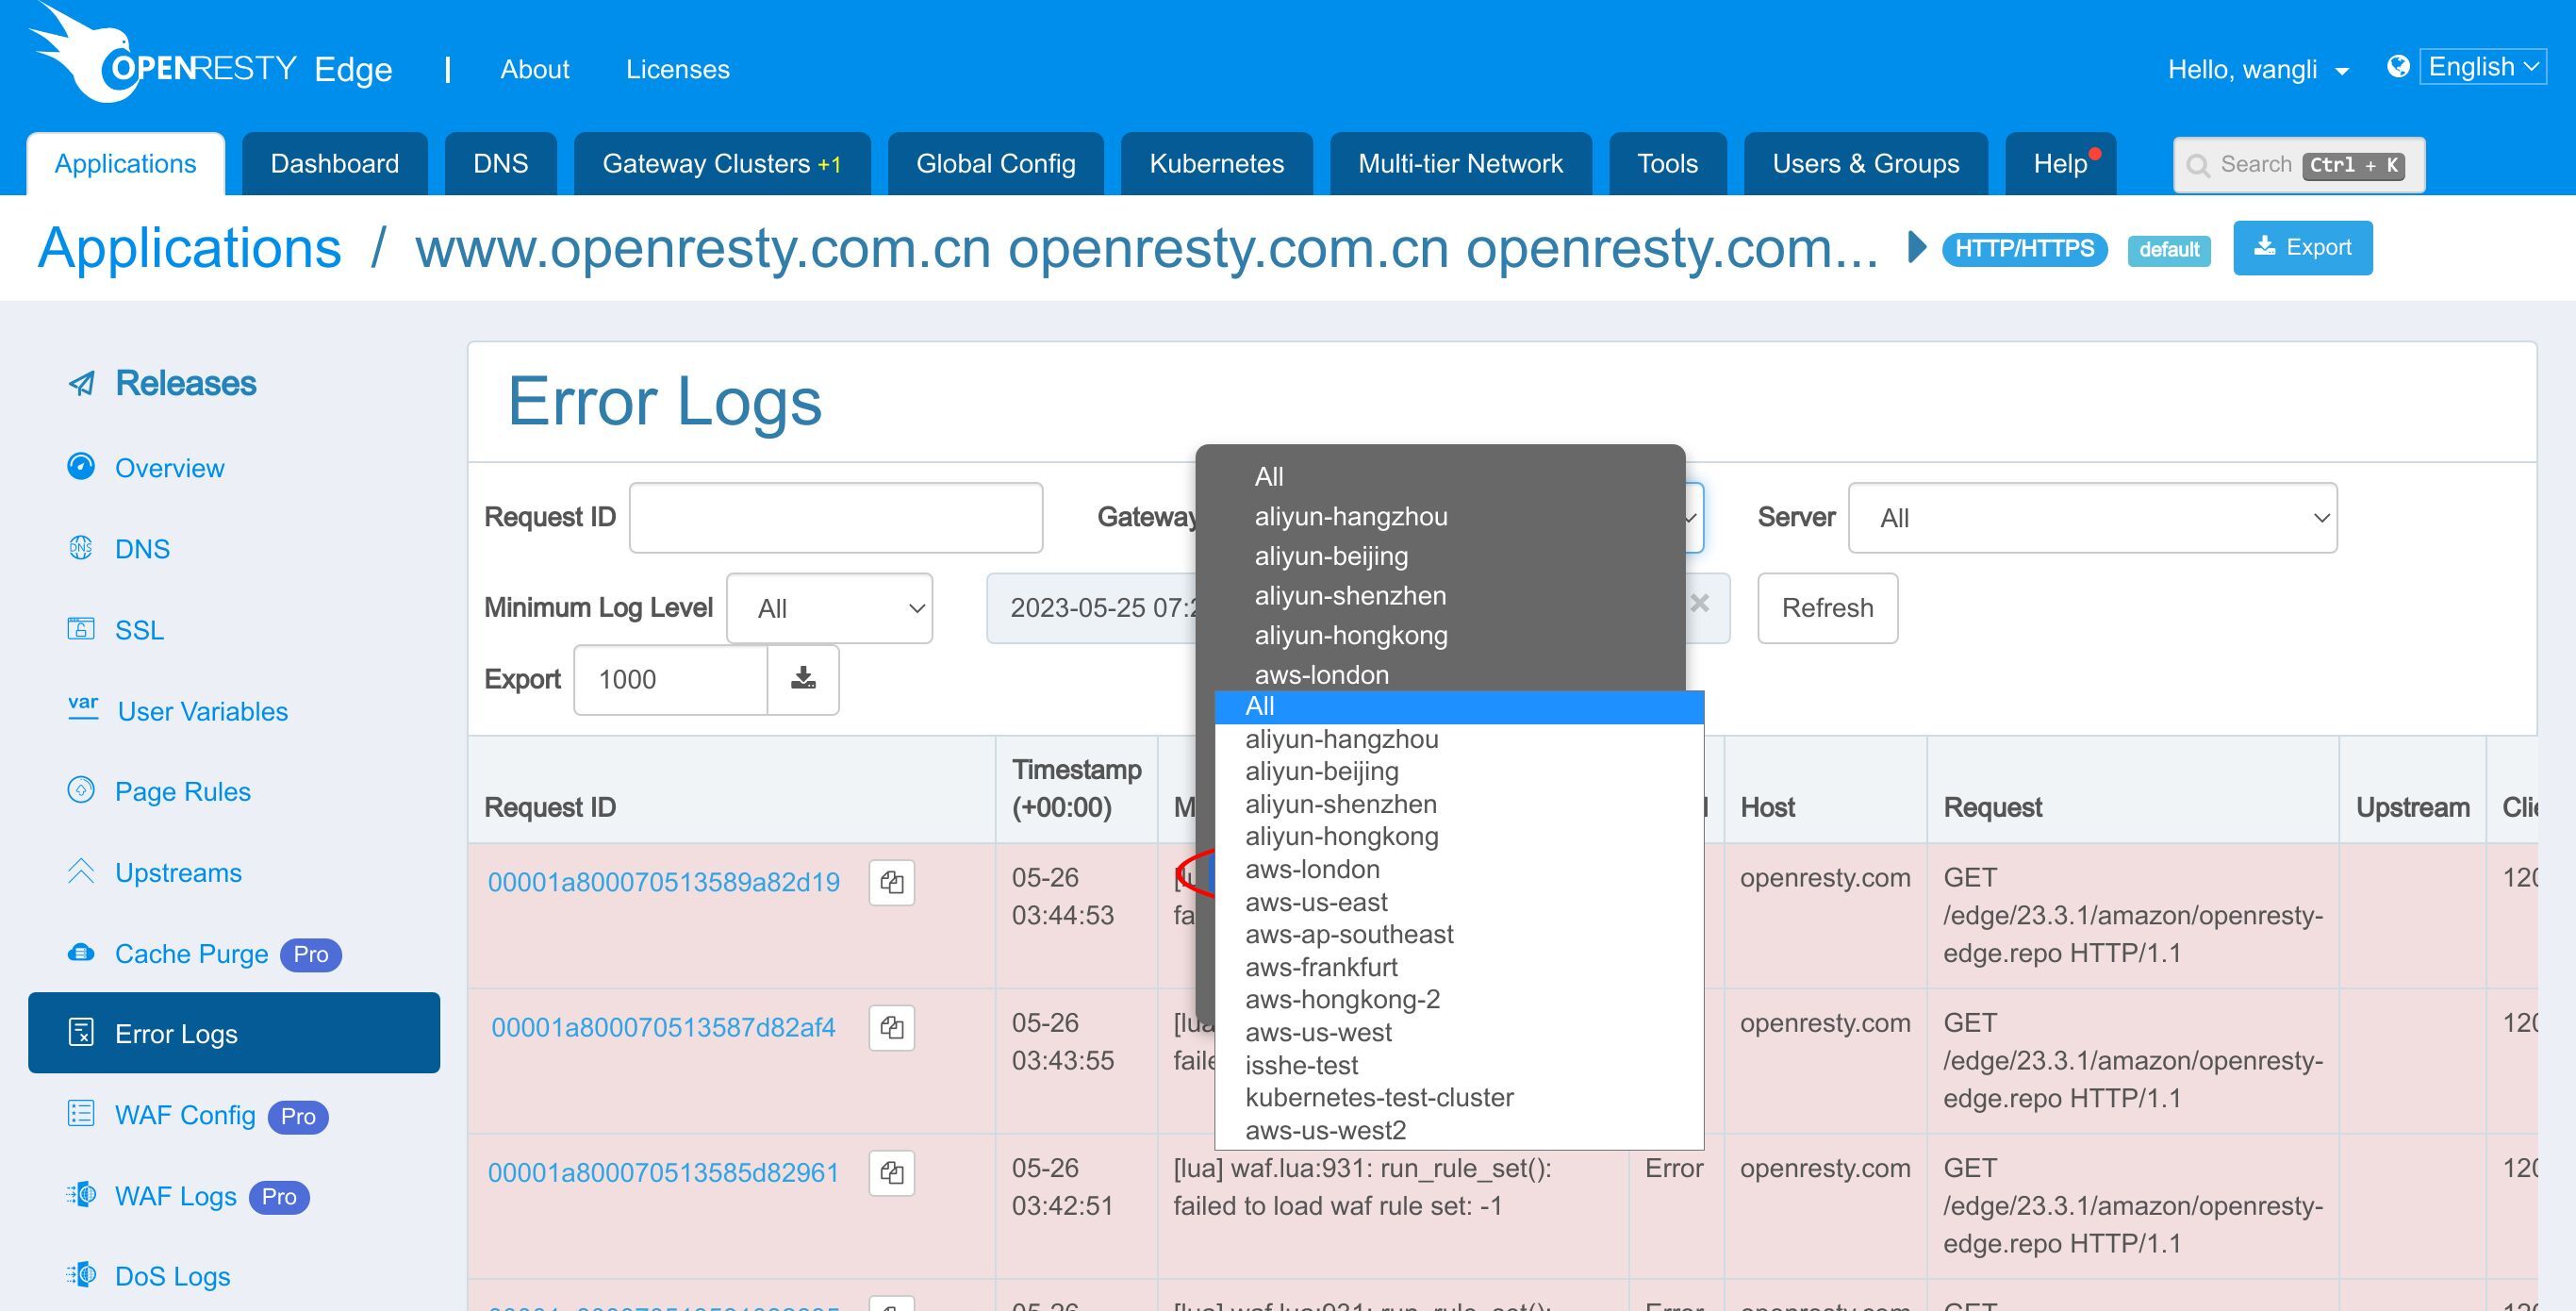
We can see that there is no error log under the aws-us-west gateway.
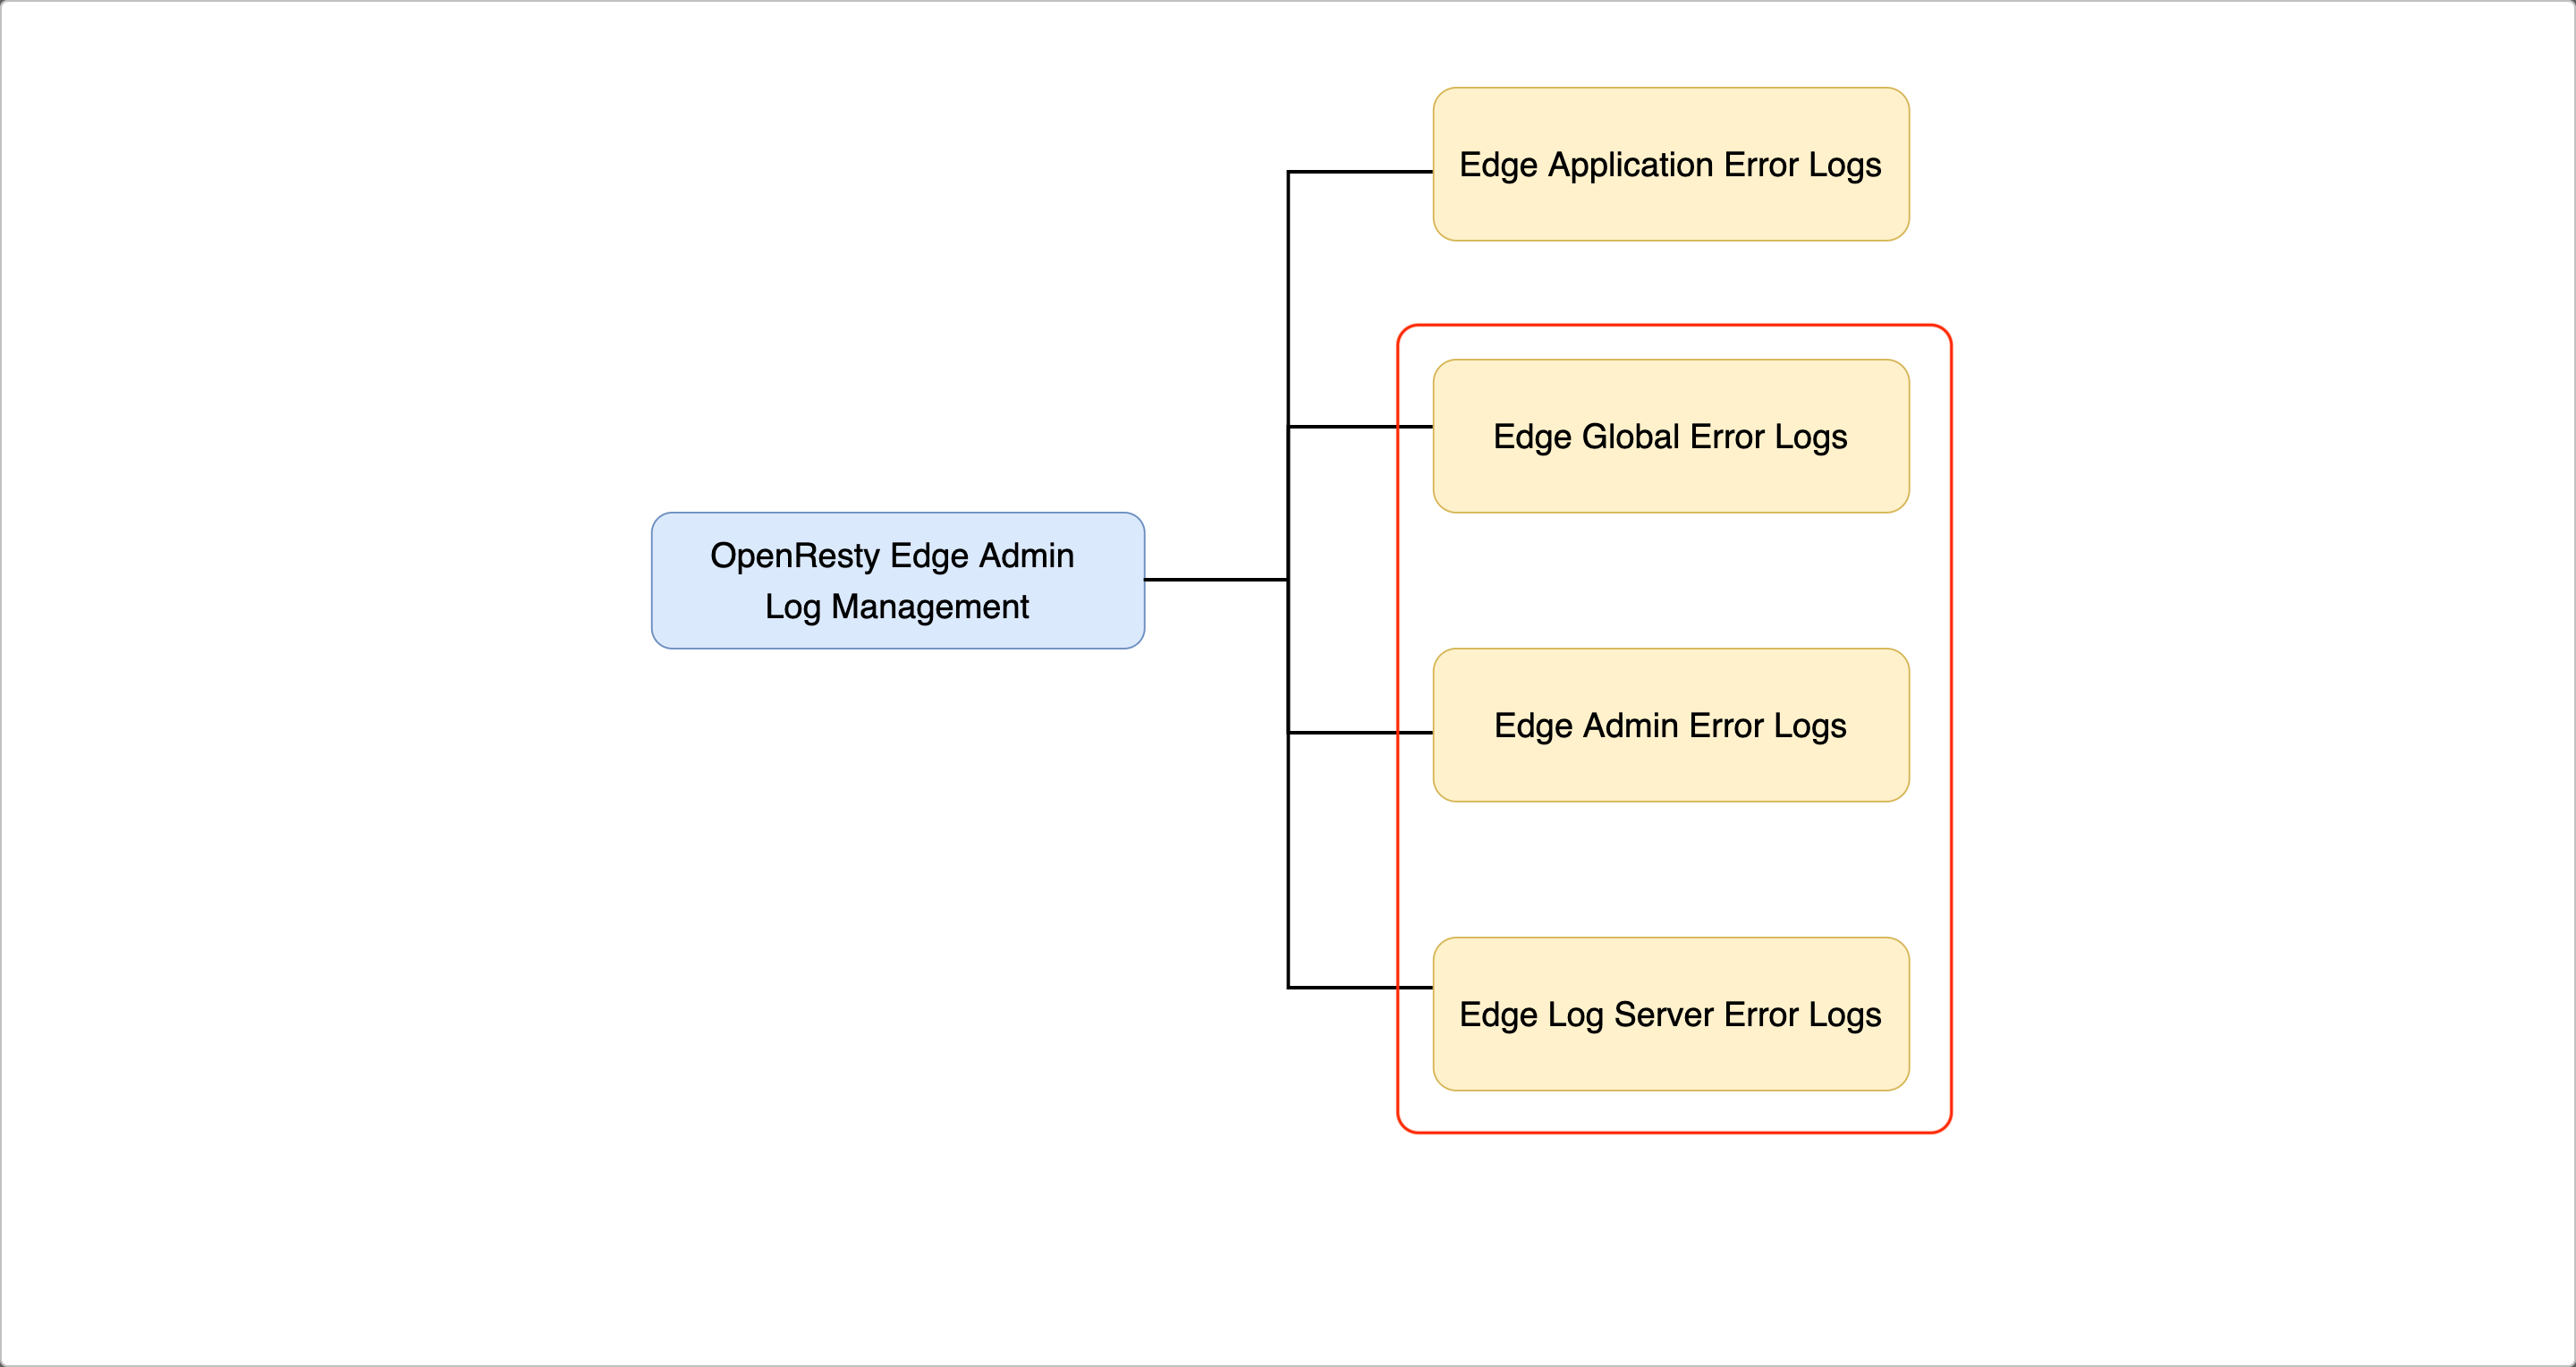
The three types of global error logs in OpenResty Edge
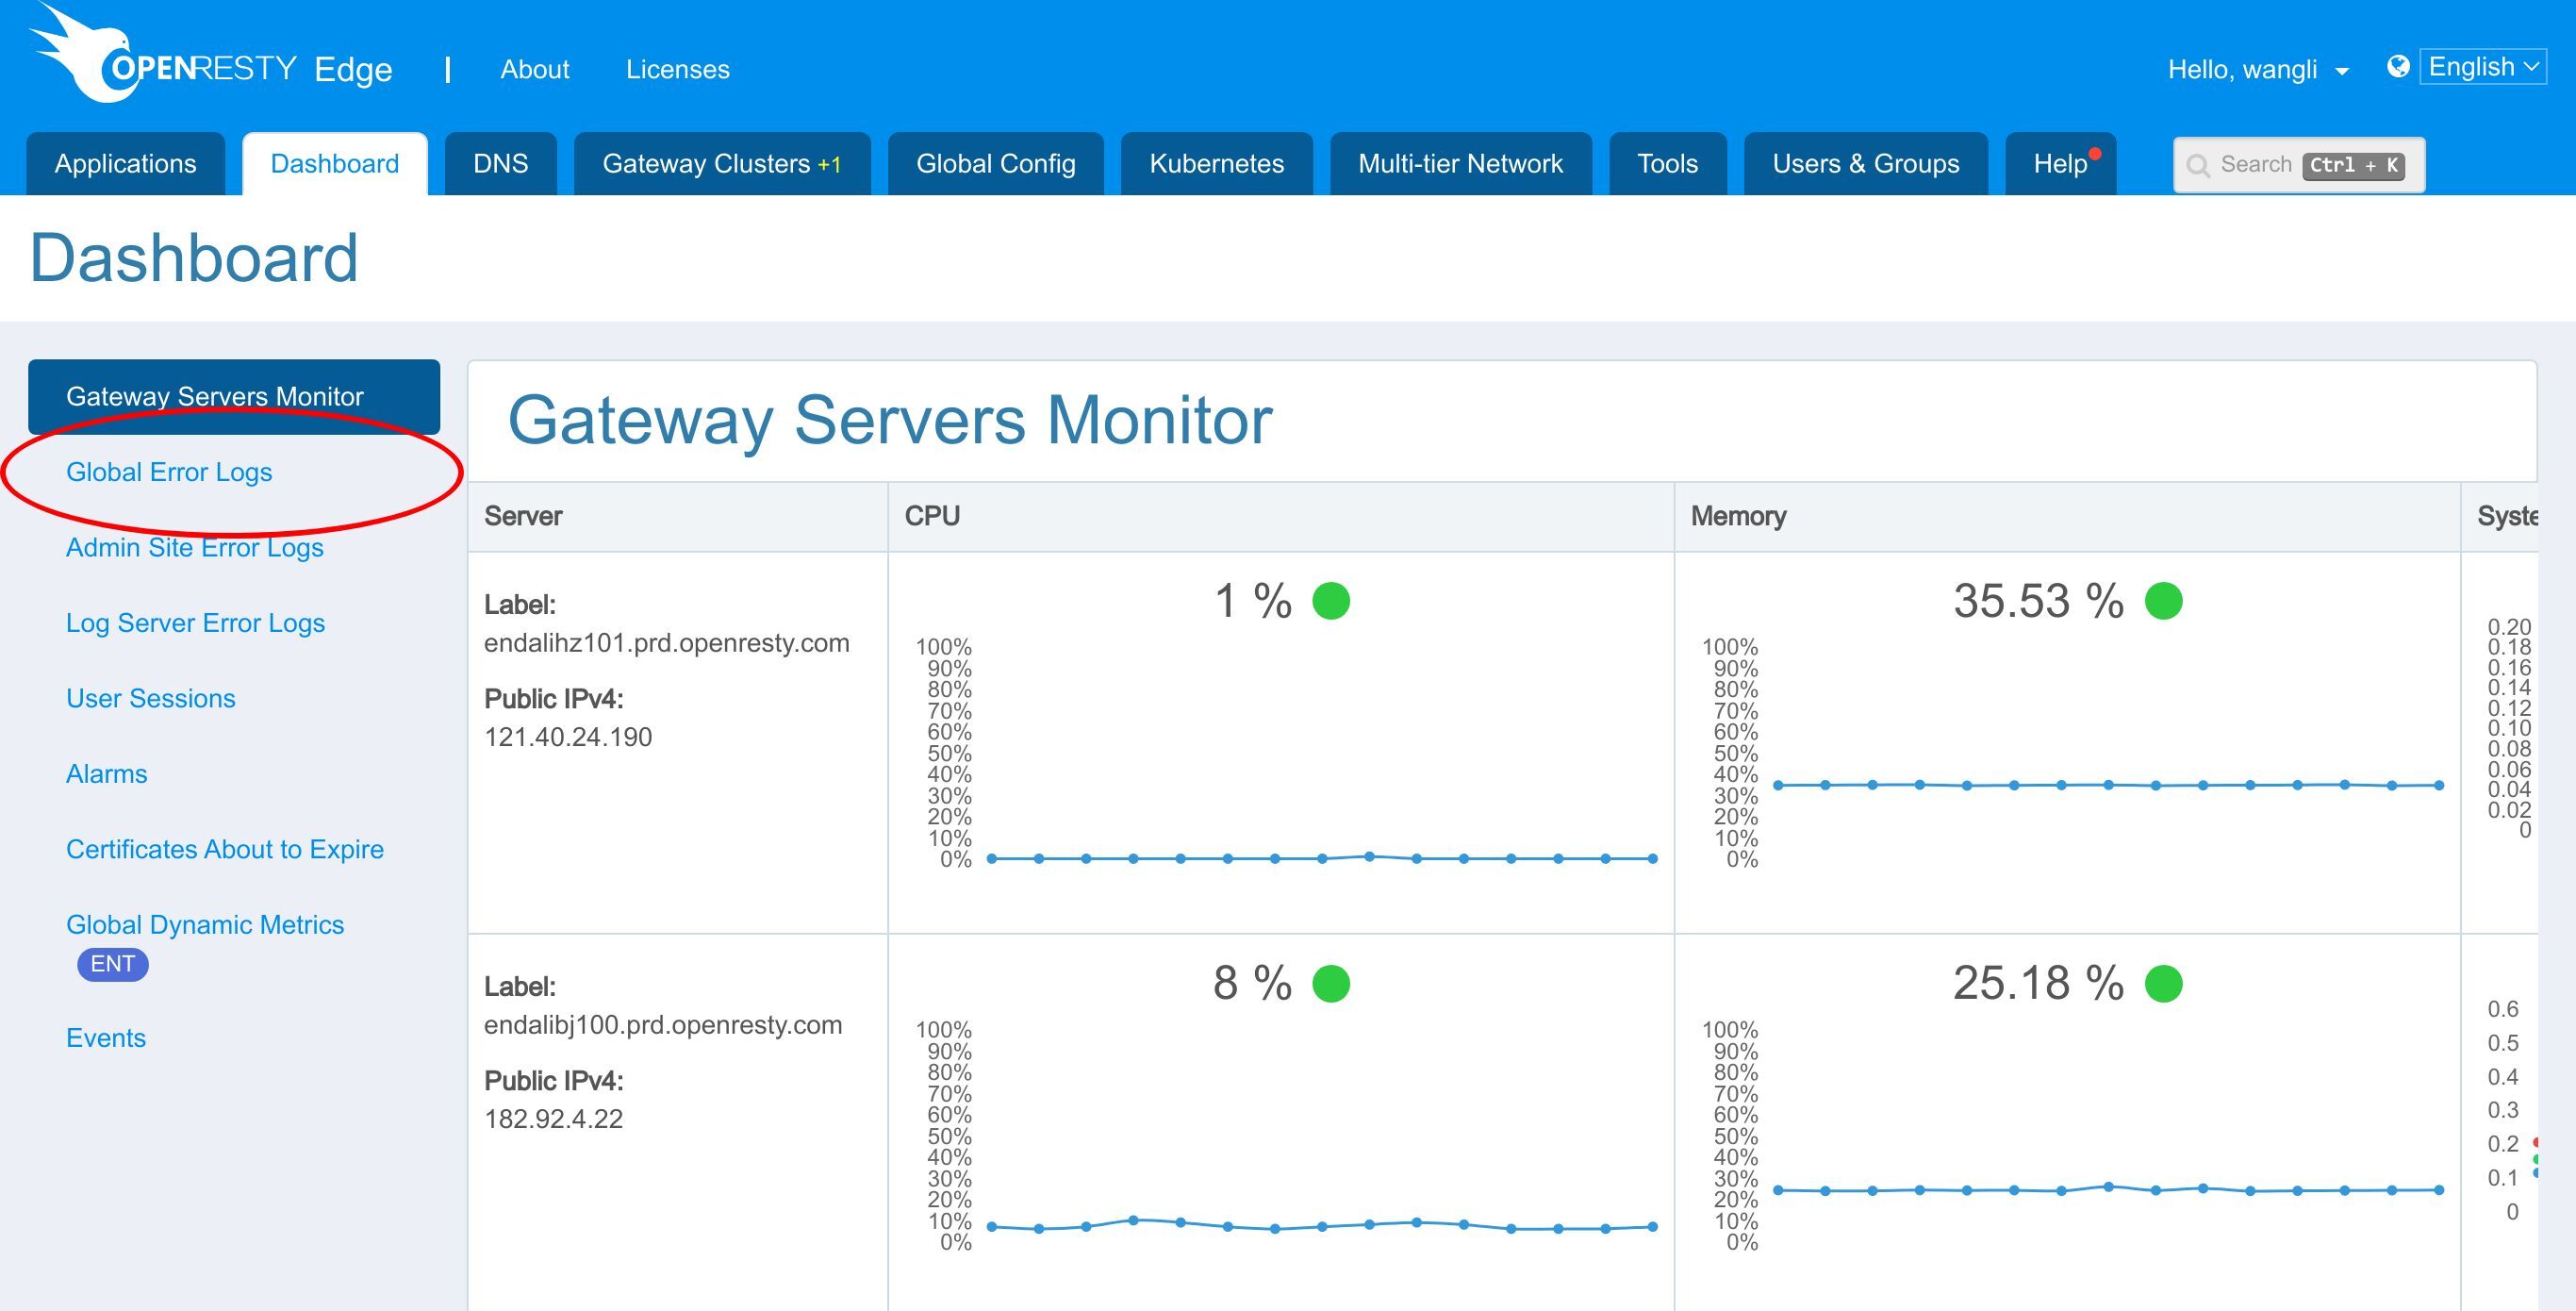
After understanding the application’s error logs, let’s see the global error logs. The global error logs are displayed on the dashboard page.
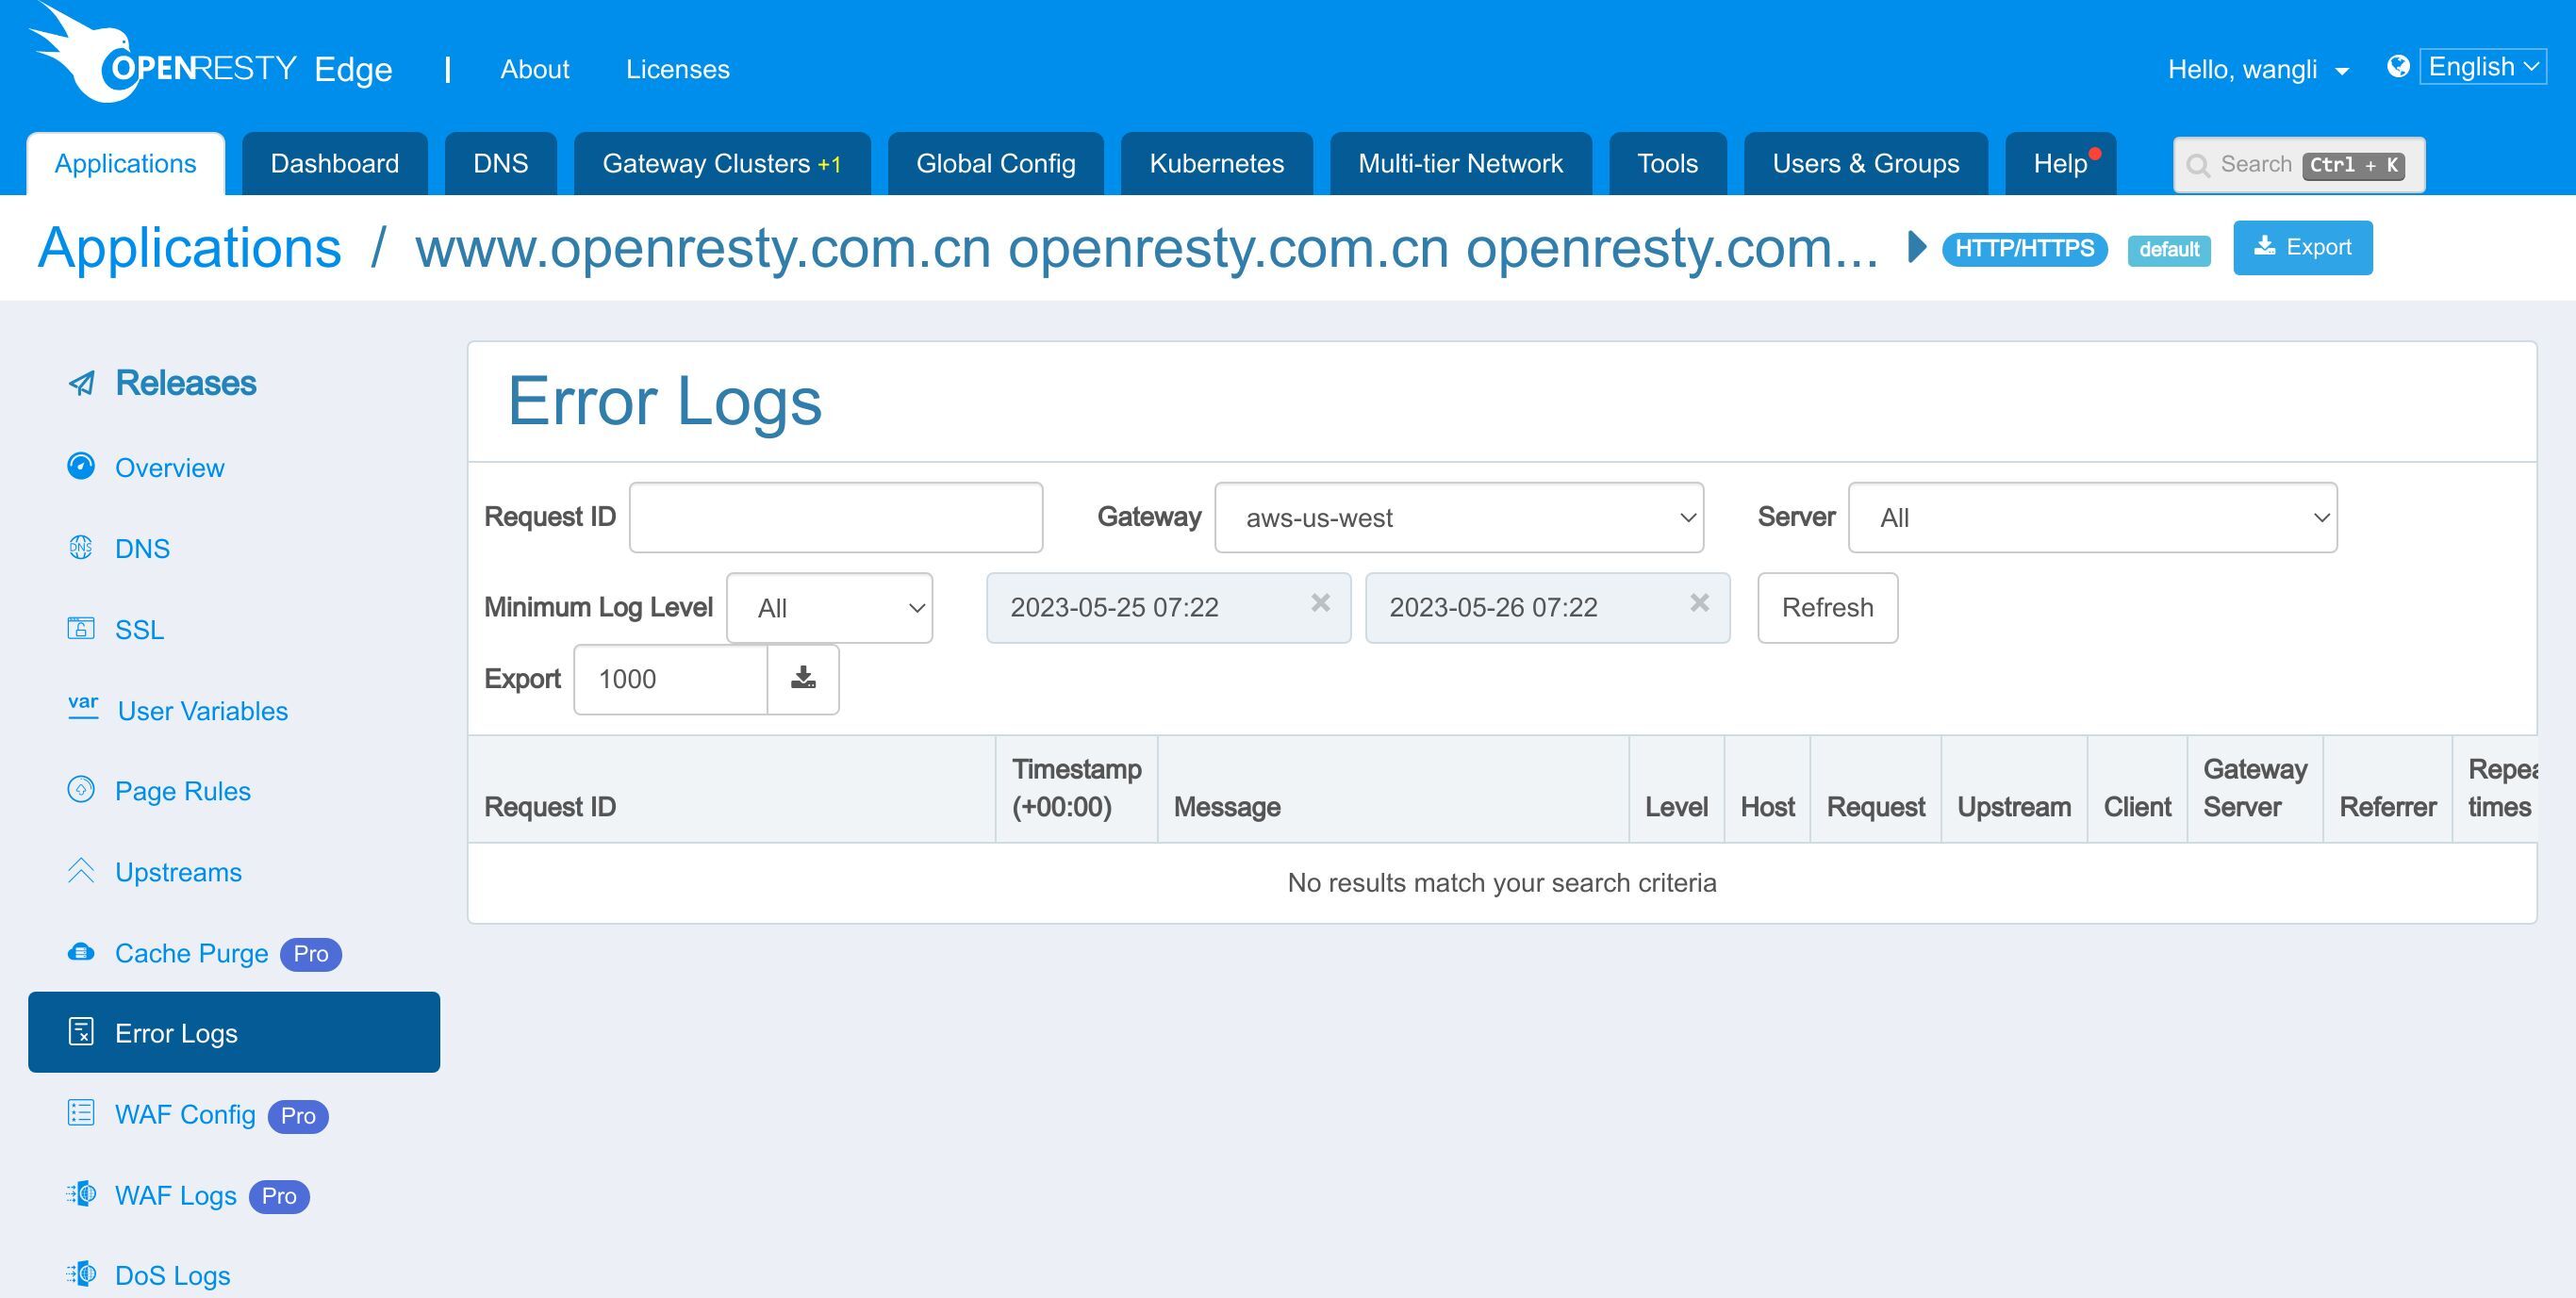
Let’s go to the dashboard page to see the global error logs.
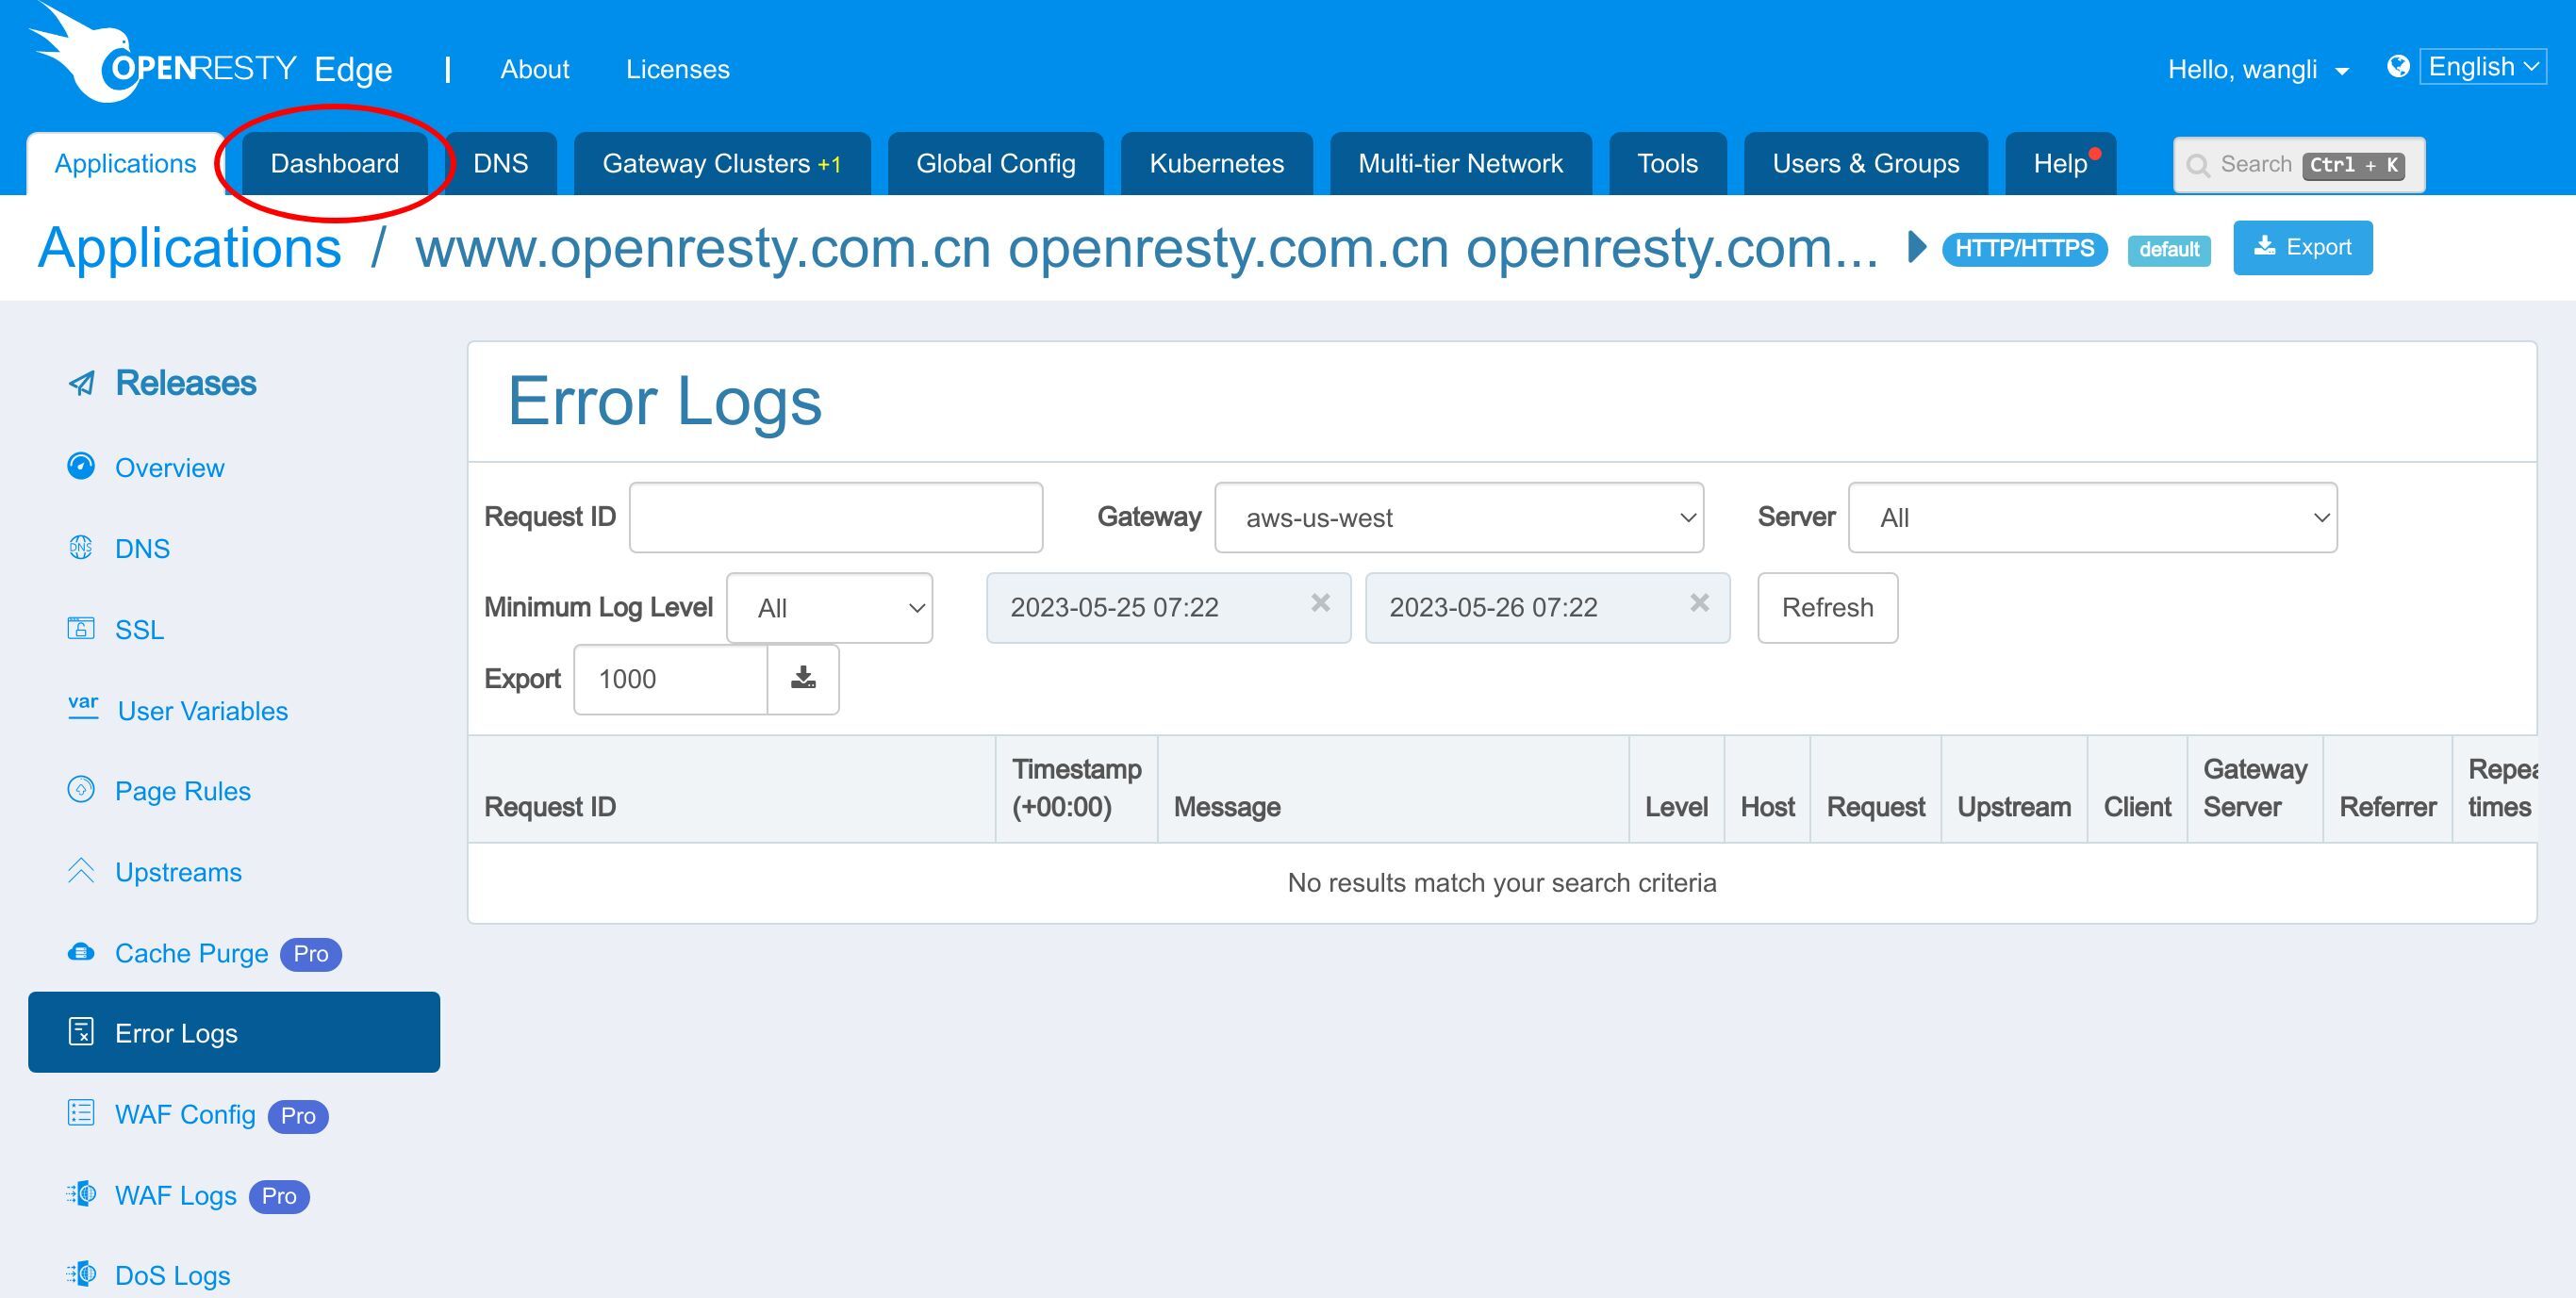
There are three types of global error logs.
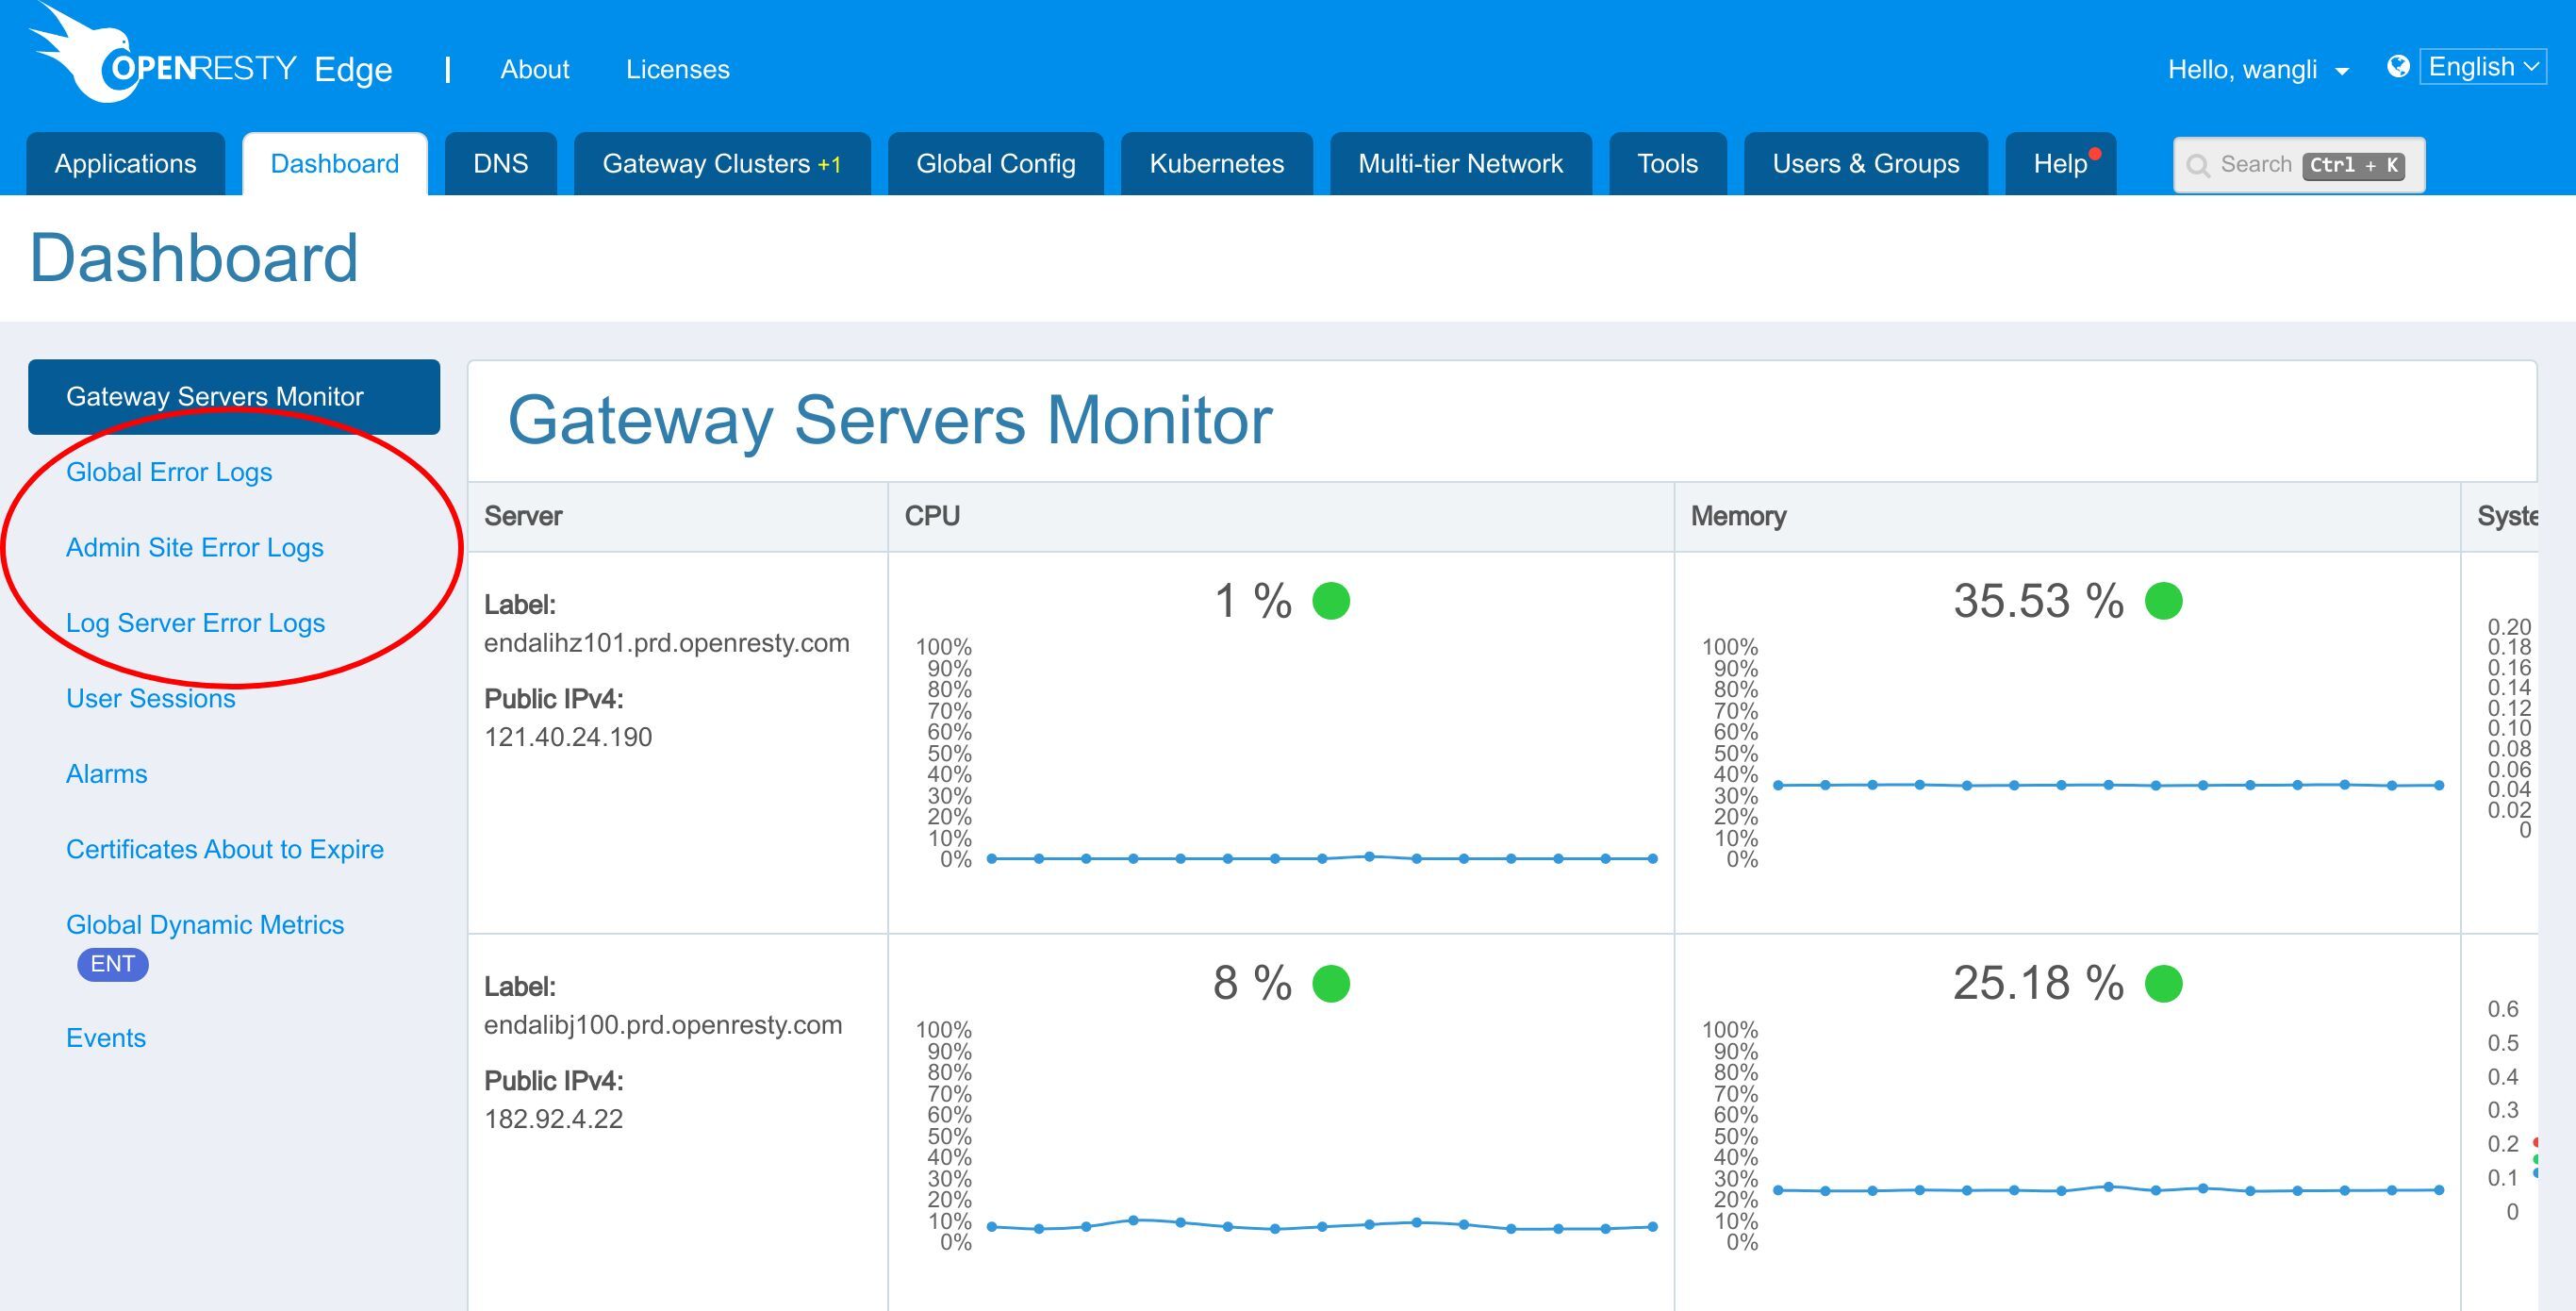
Global Error Logs.
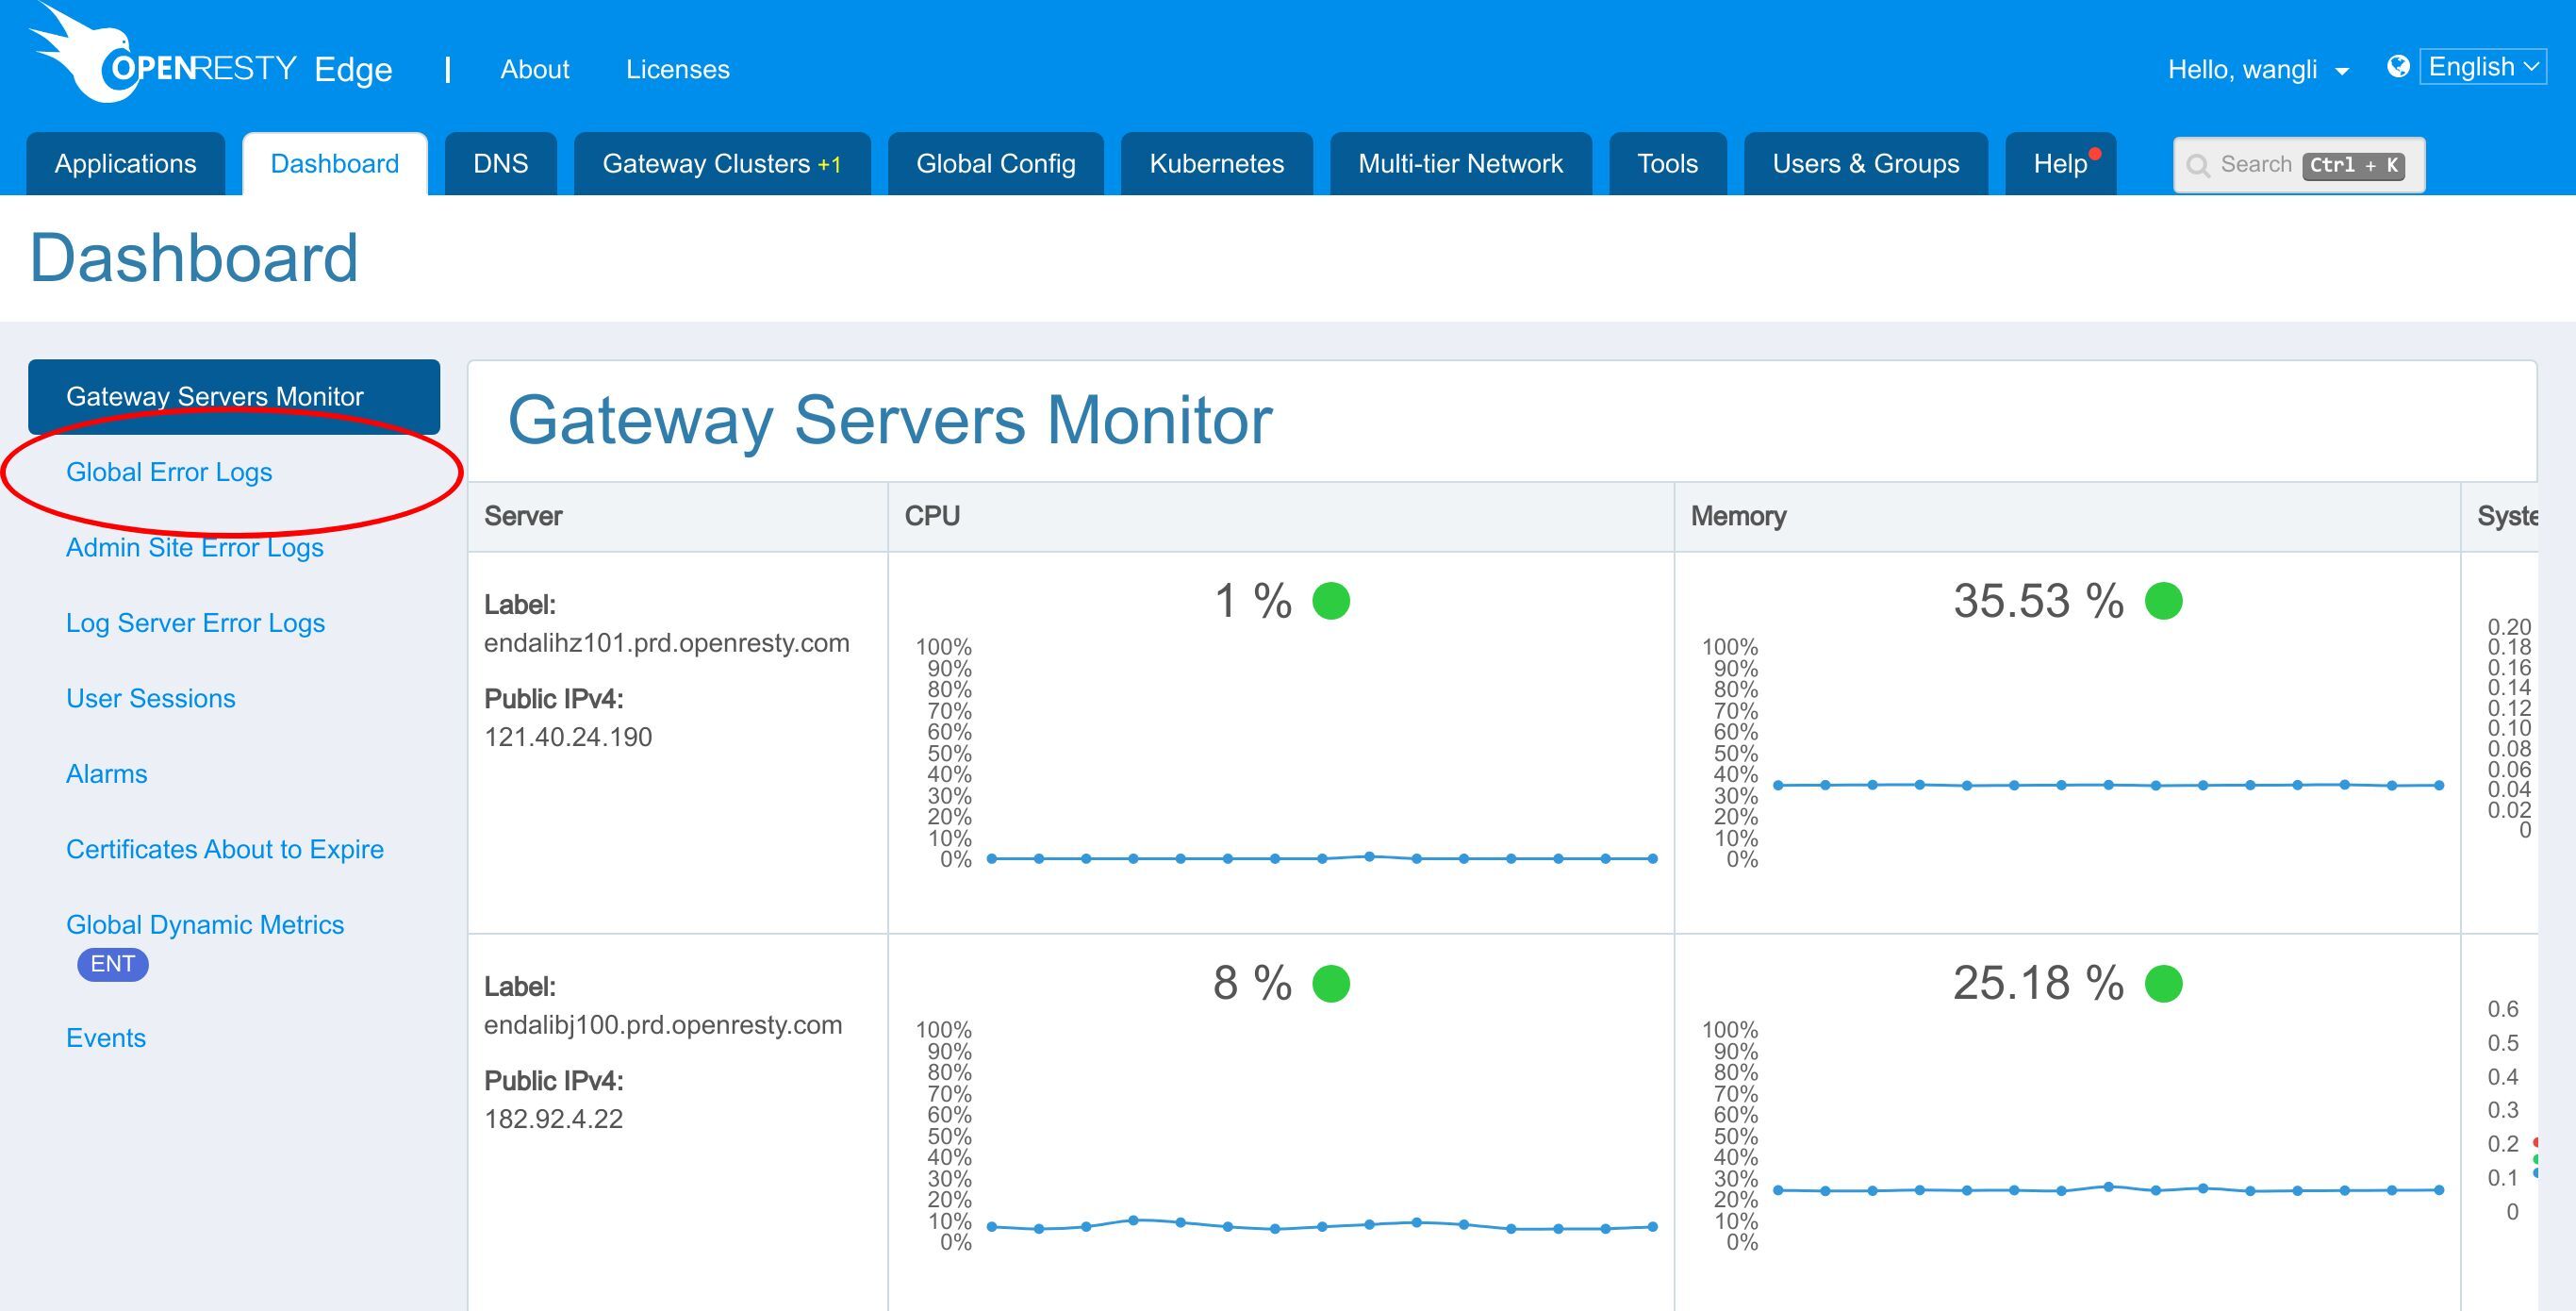
Admin Site Error Logs.
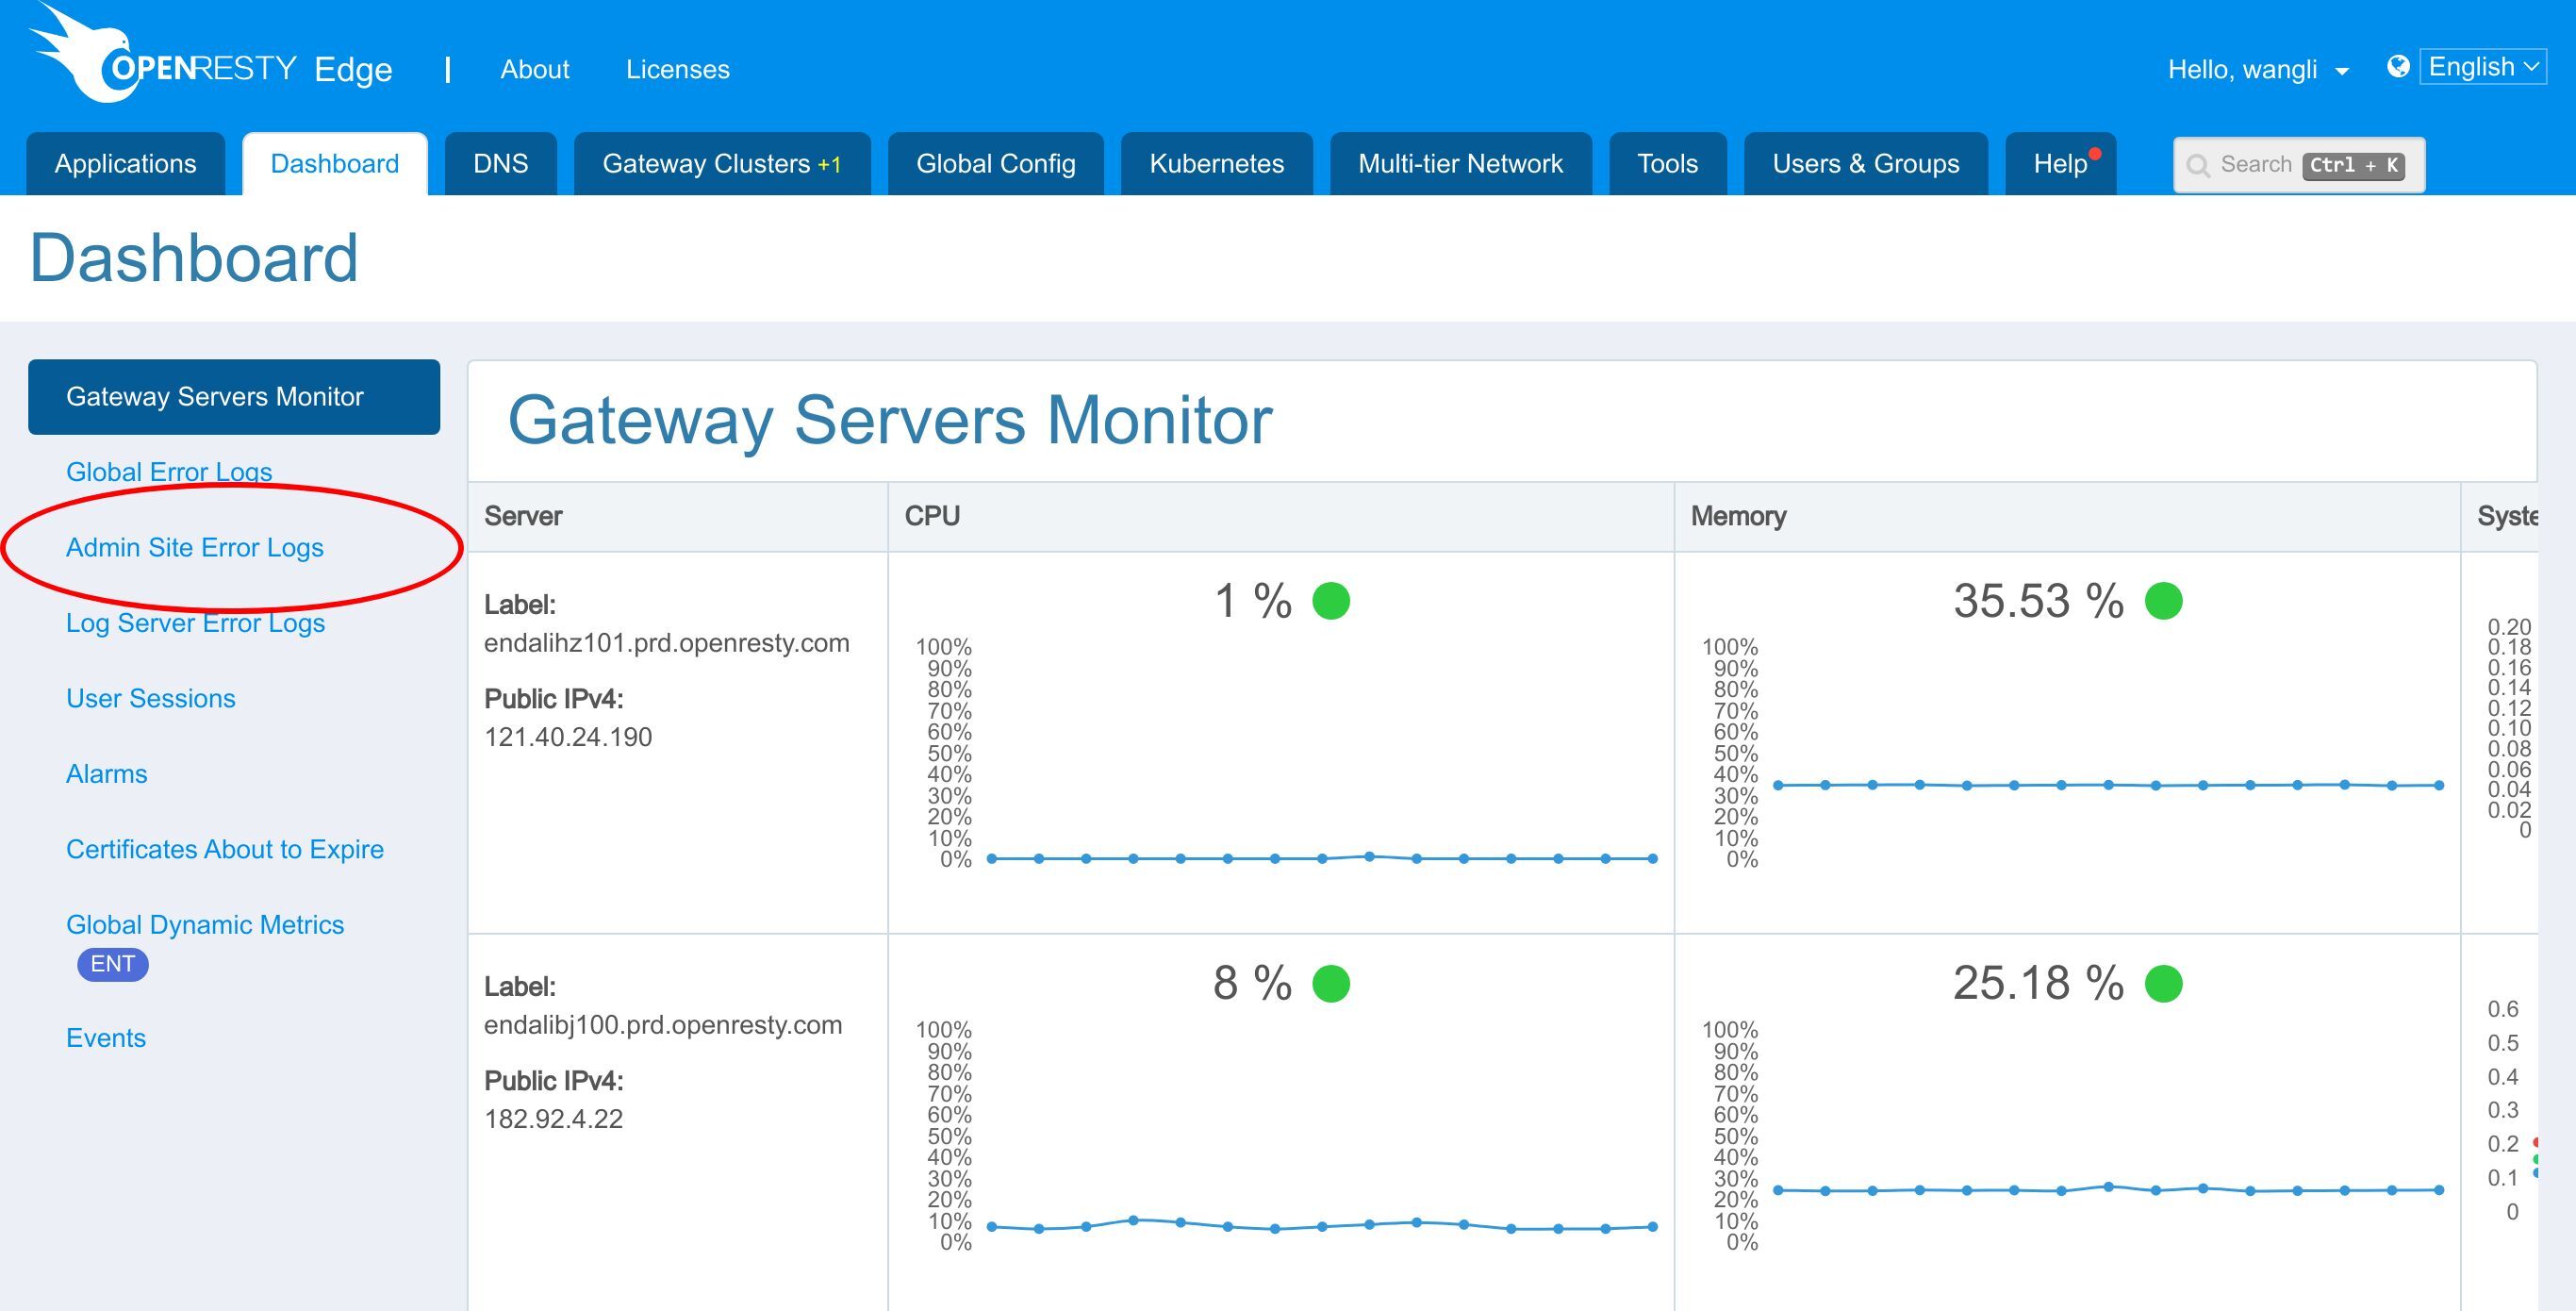
Log Server Error Logs.
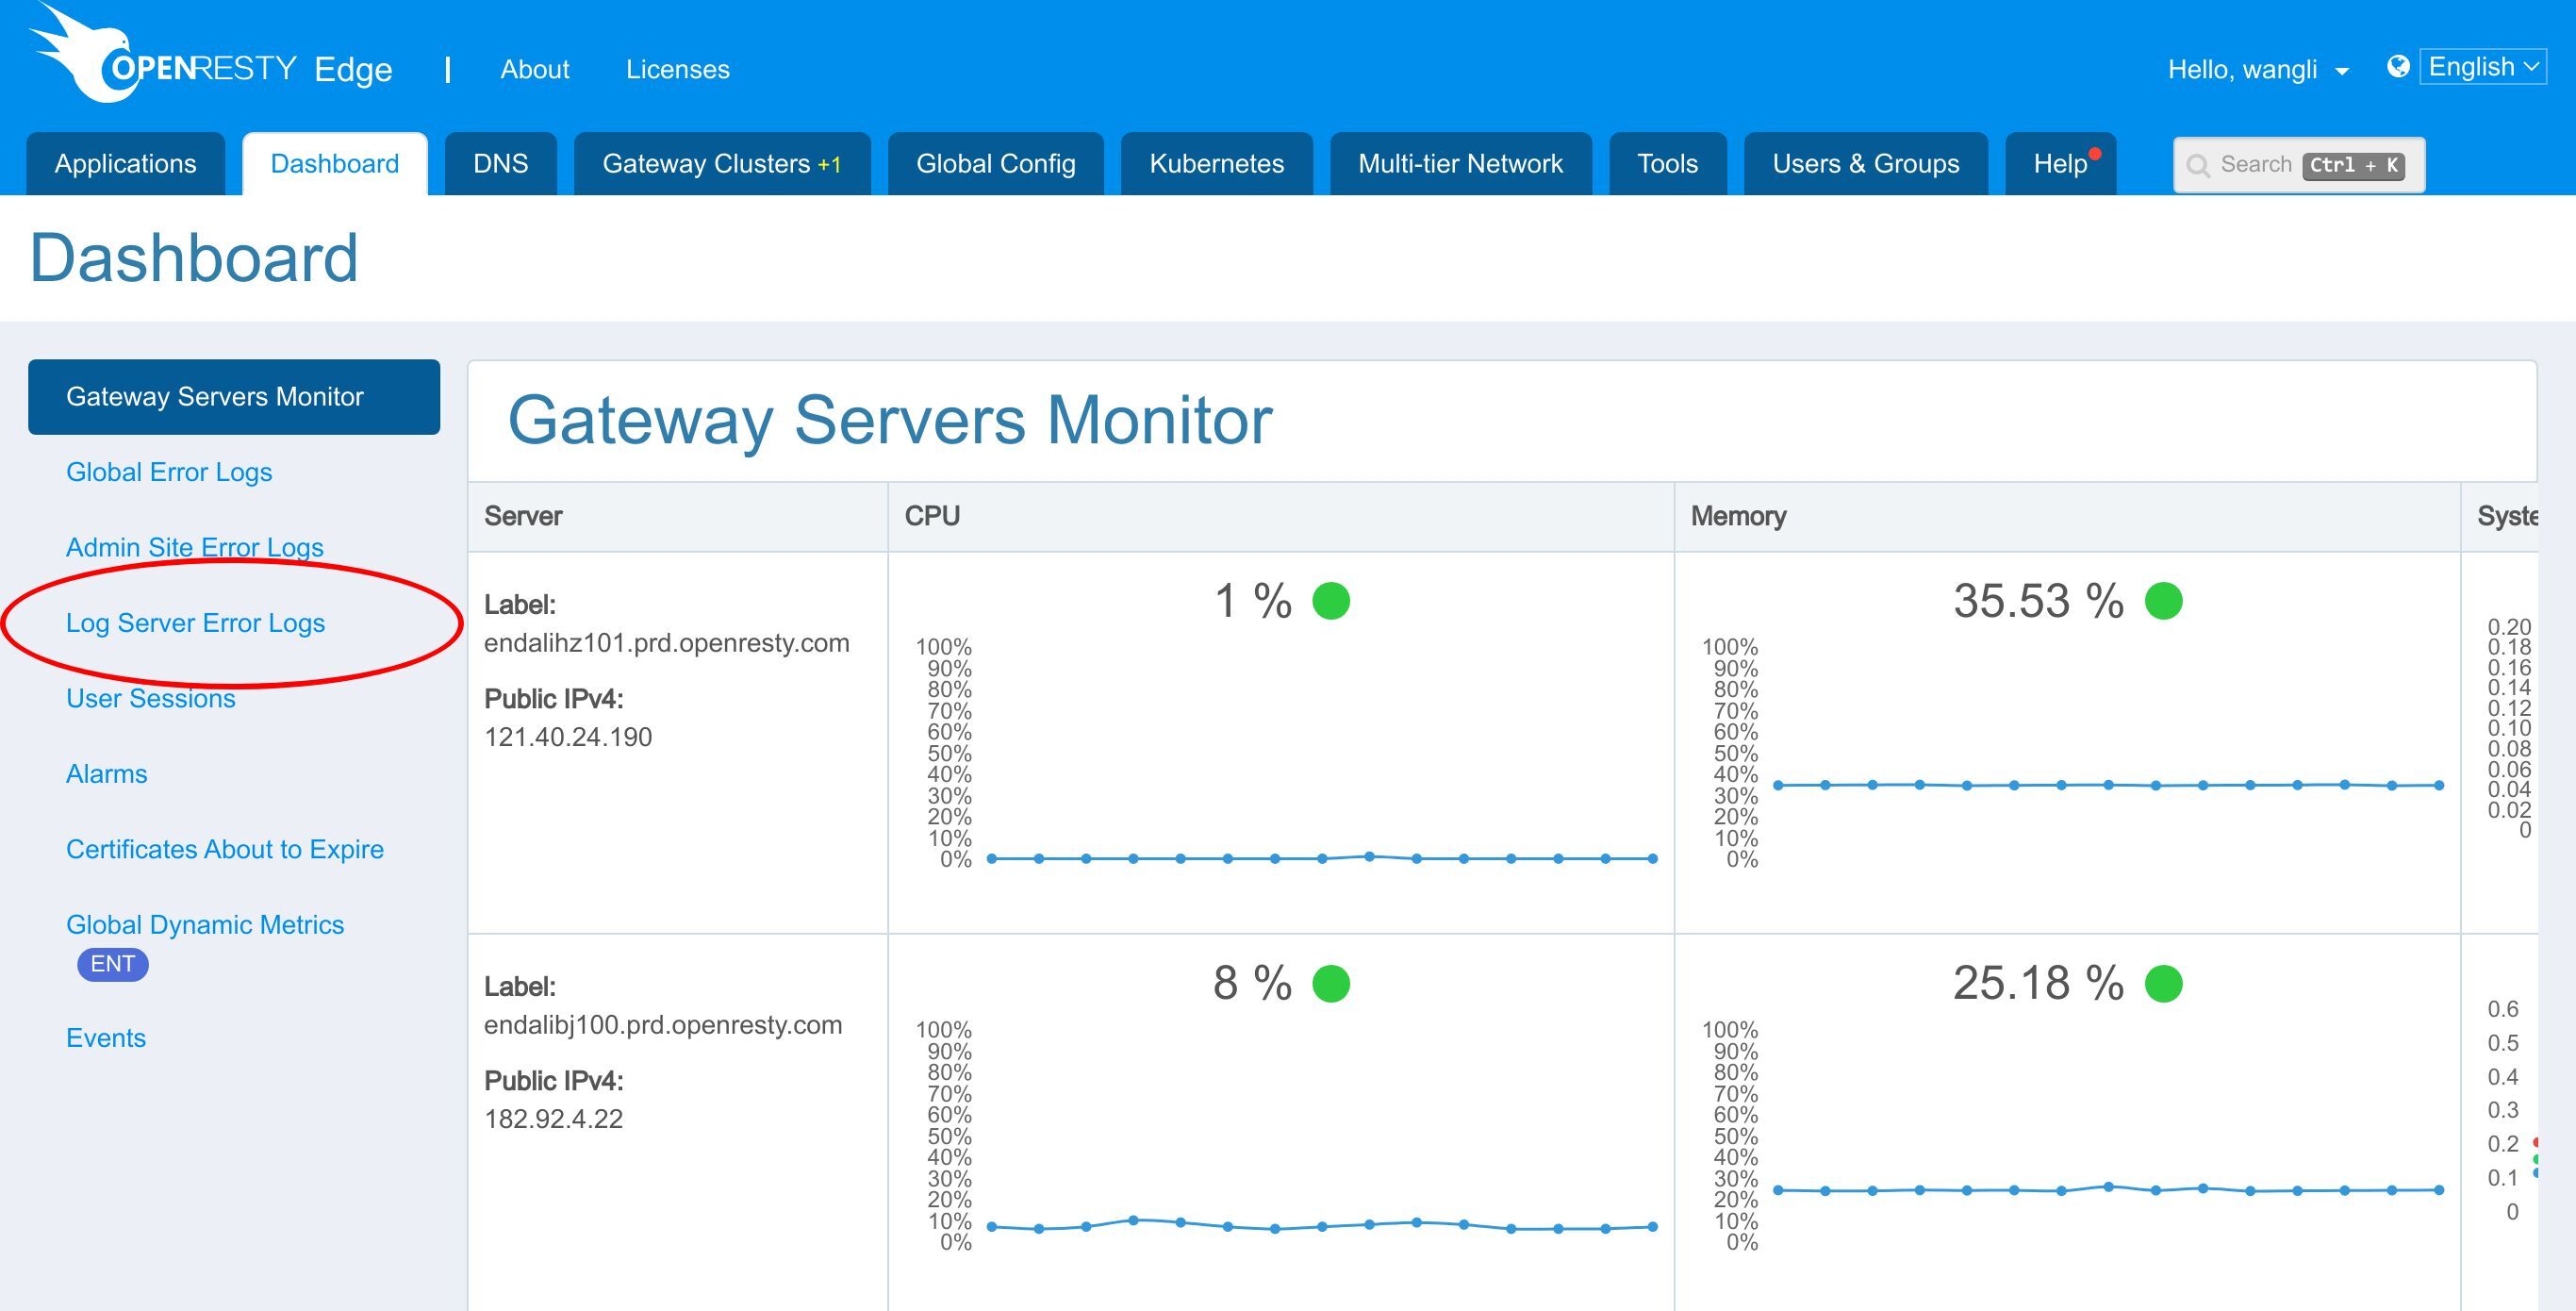
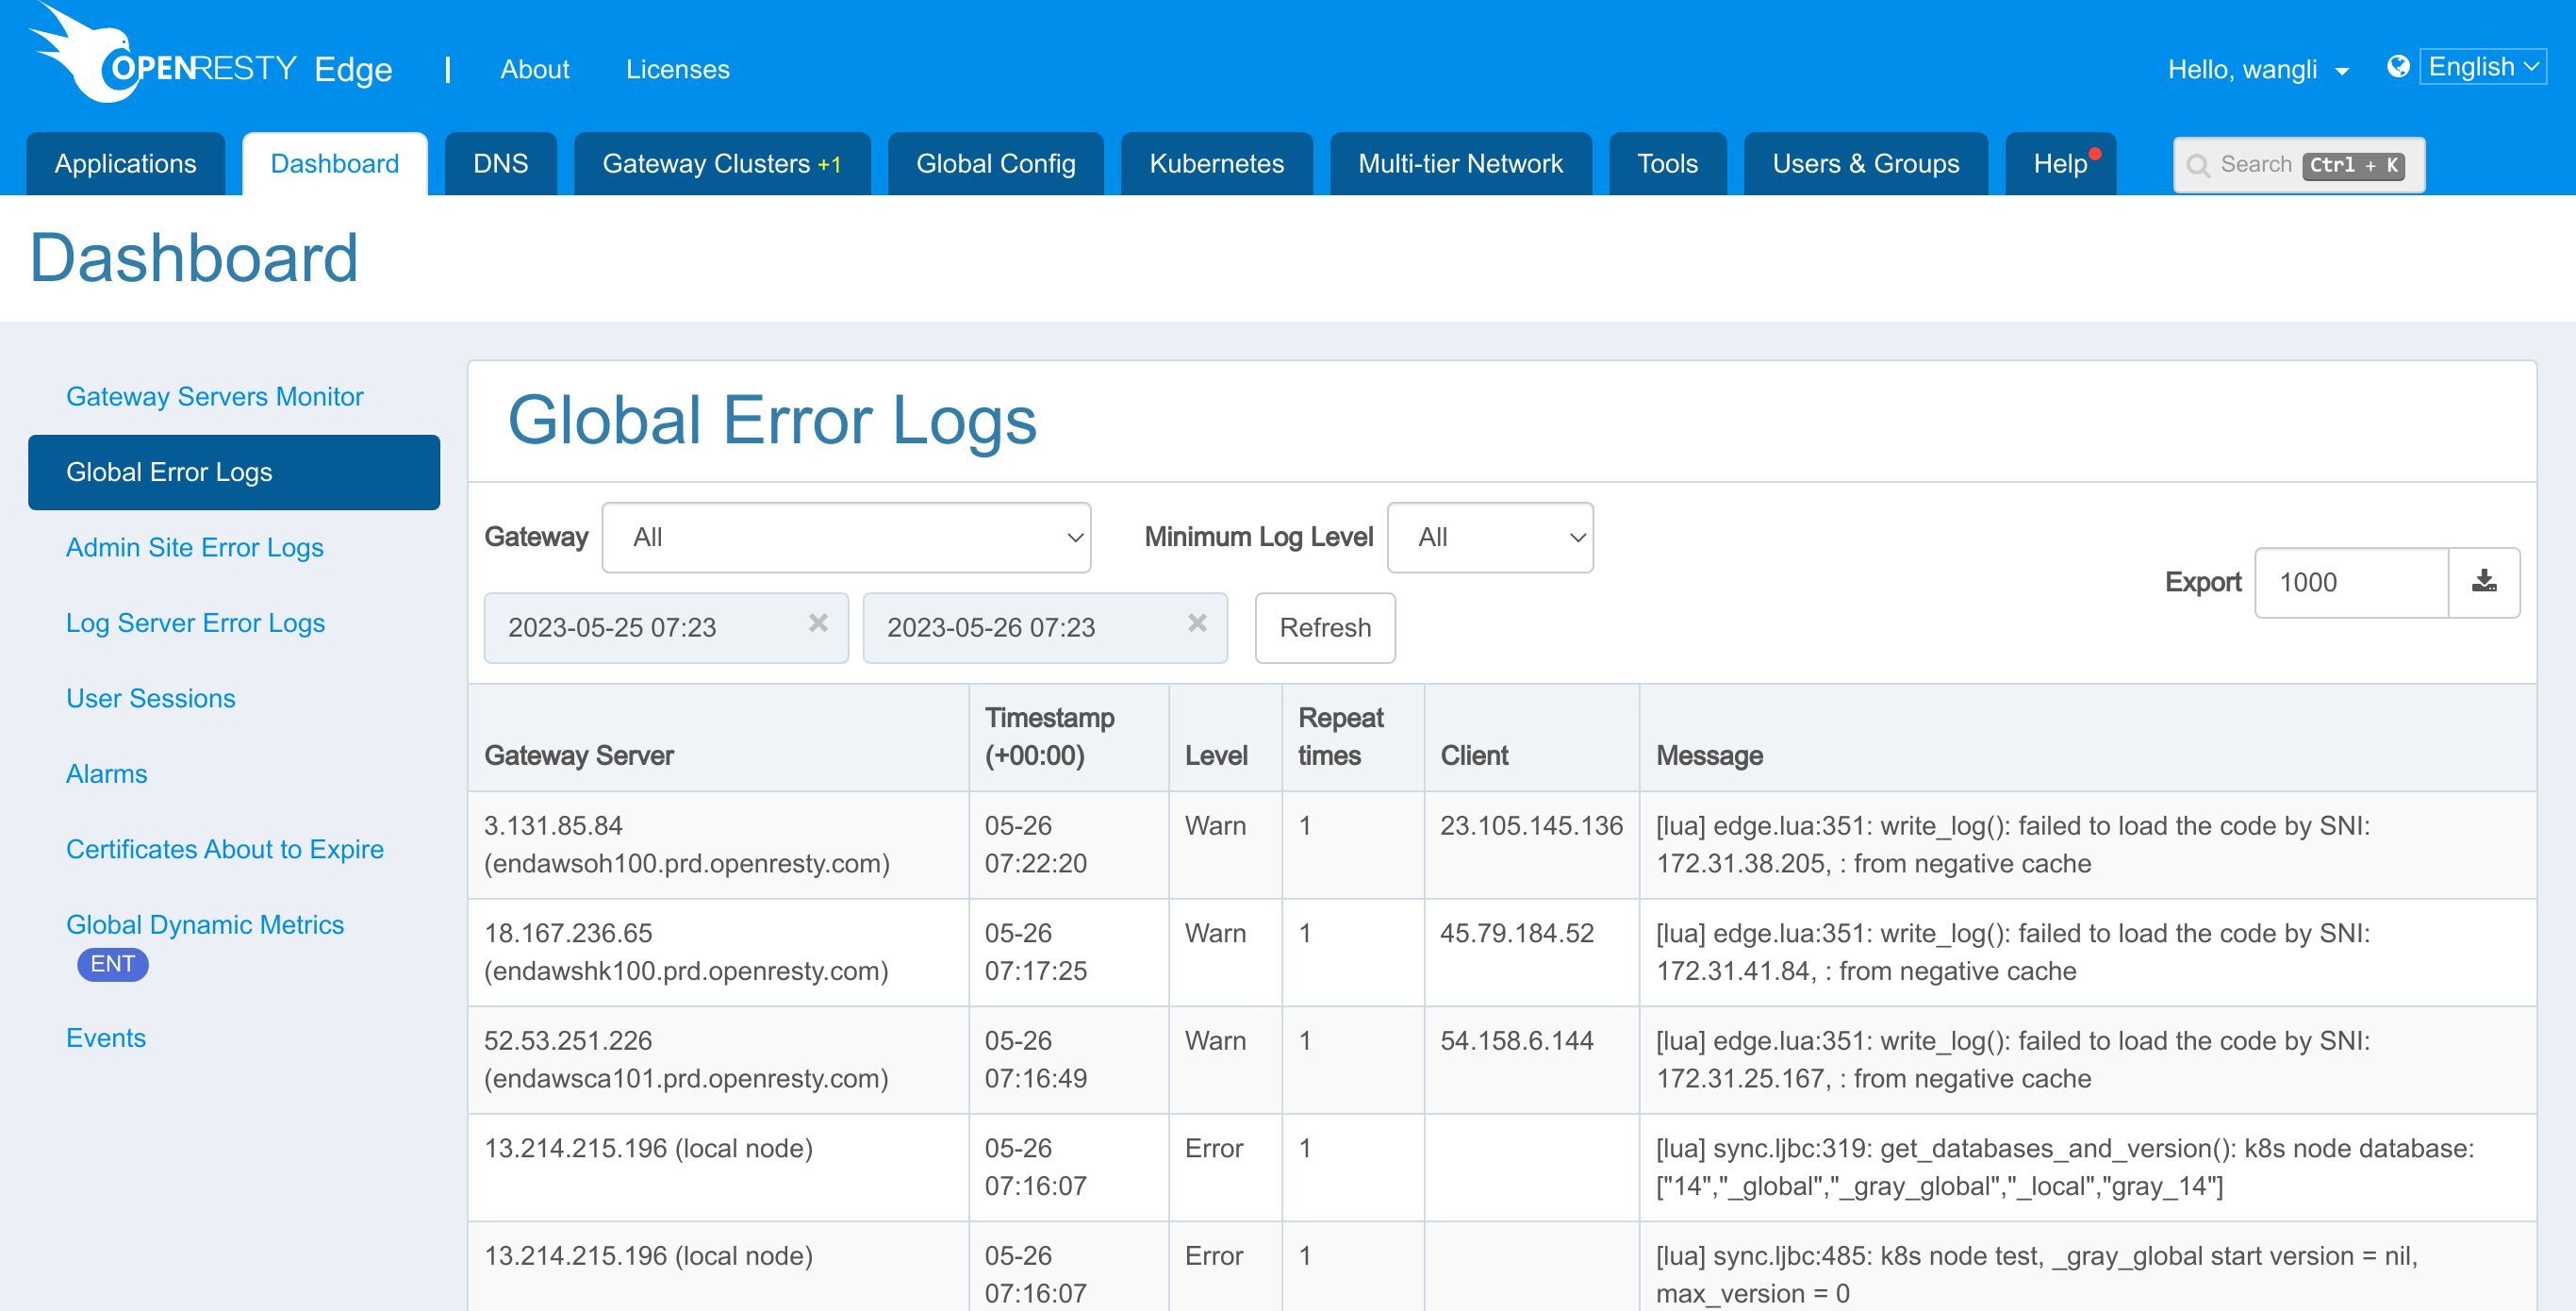
Let’s first look at global error logs.
Global error logs are collected from gateway servers and do not belong to any applications.
We can filter the error logs.
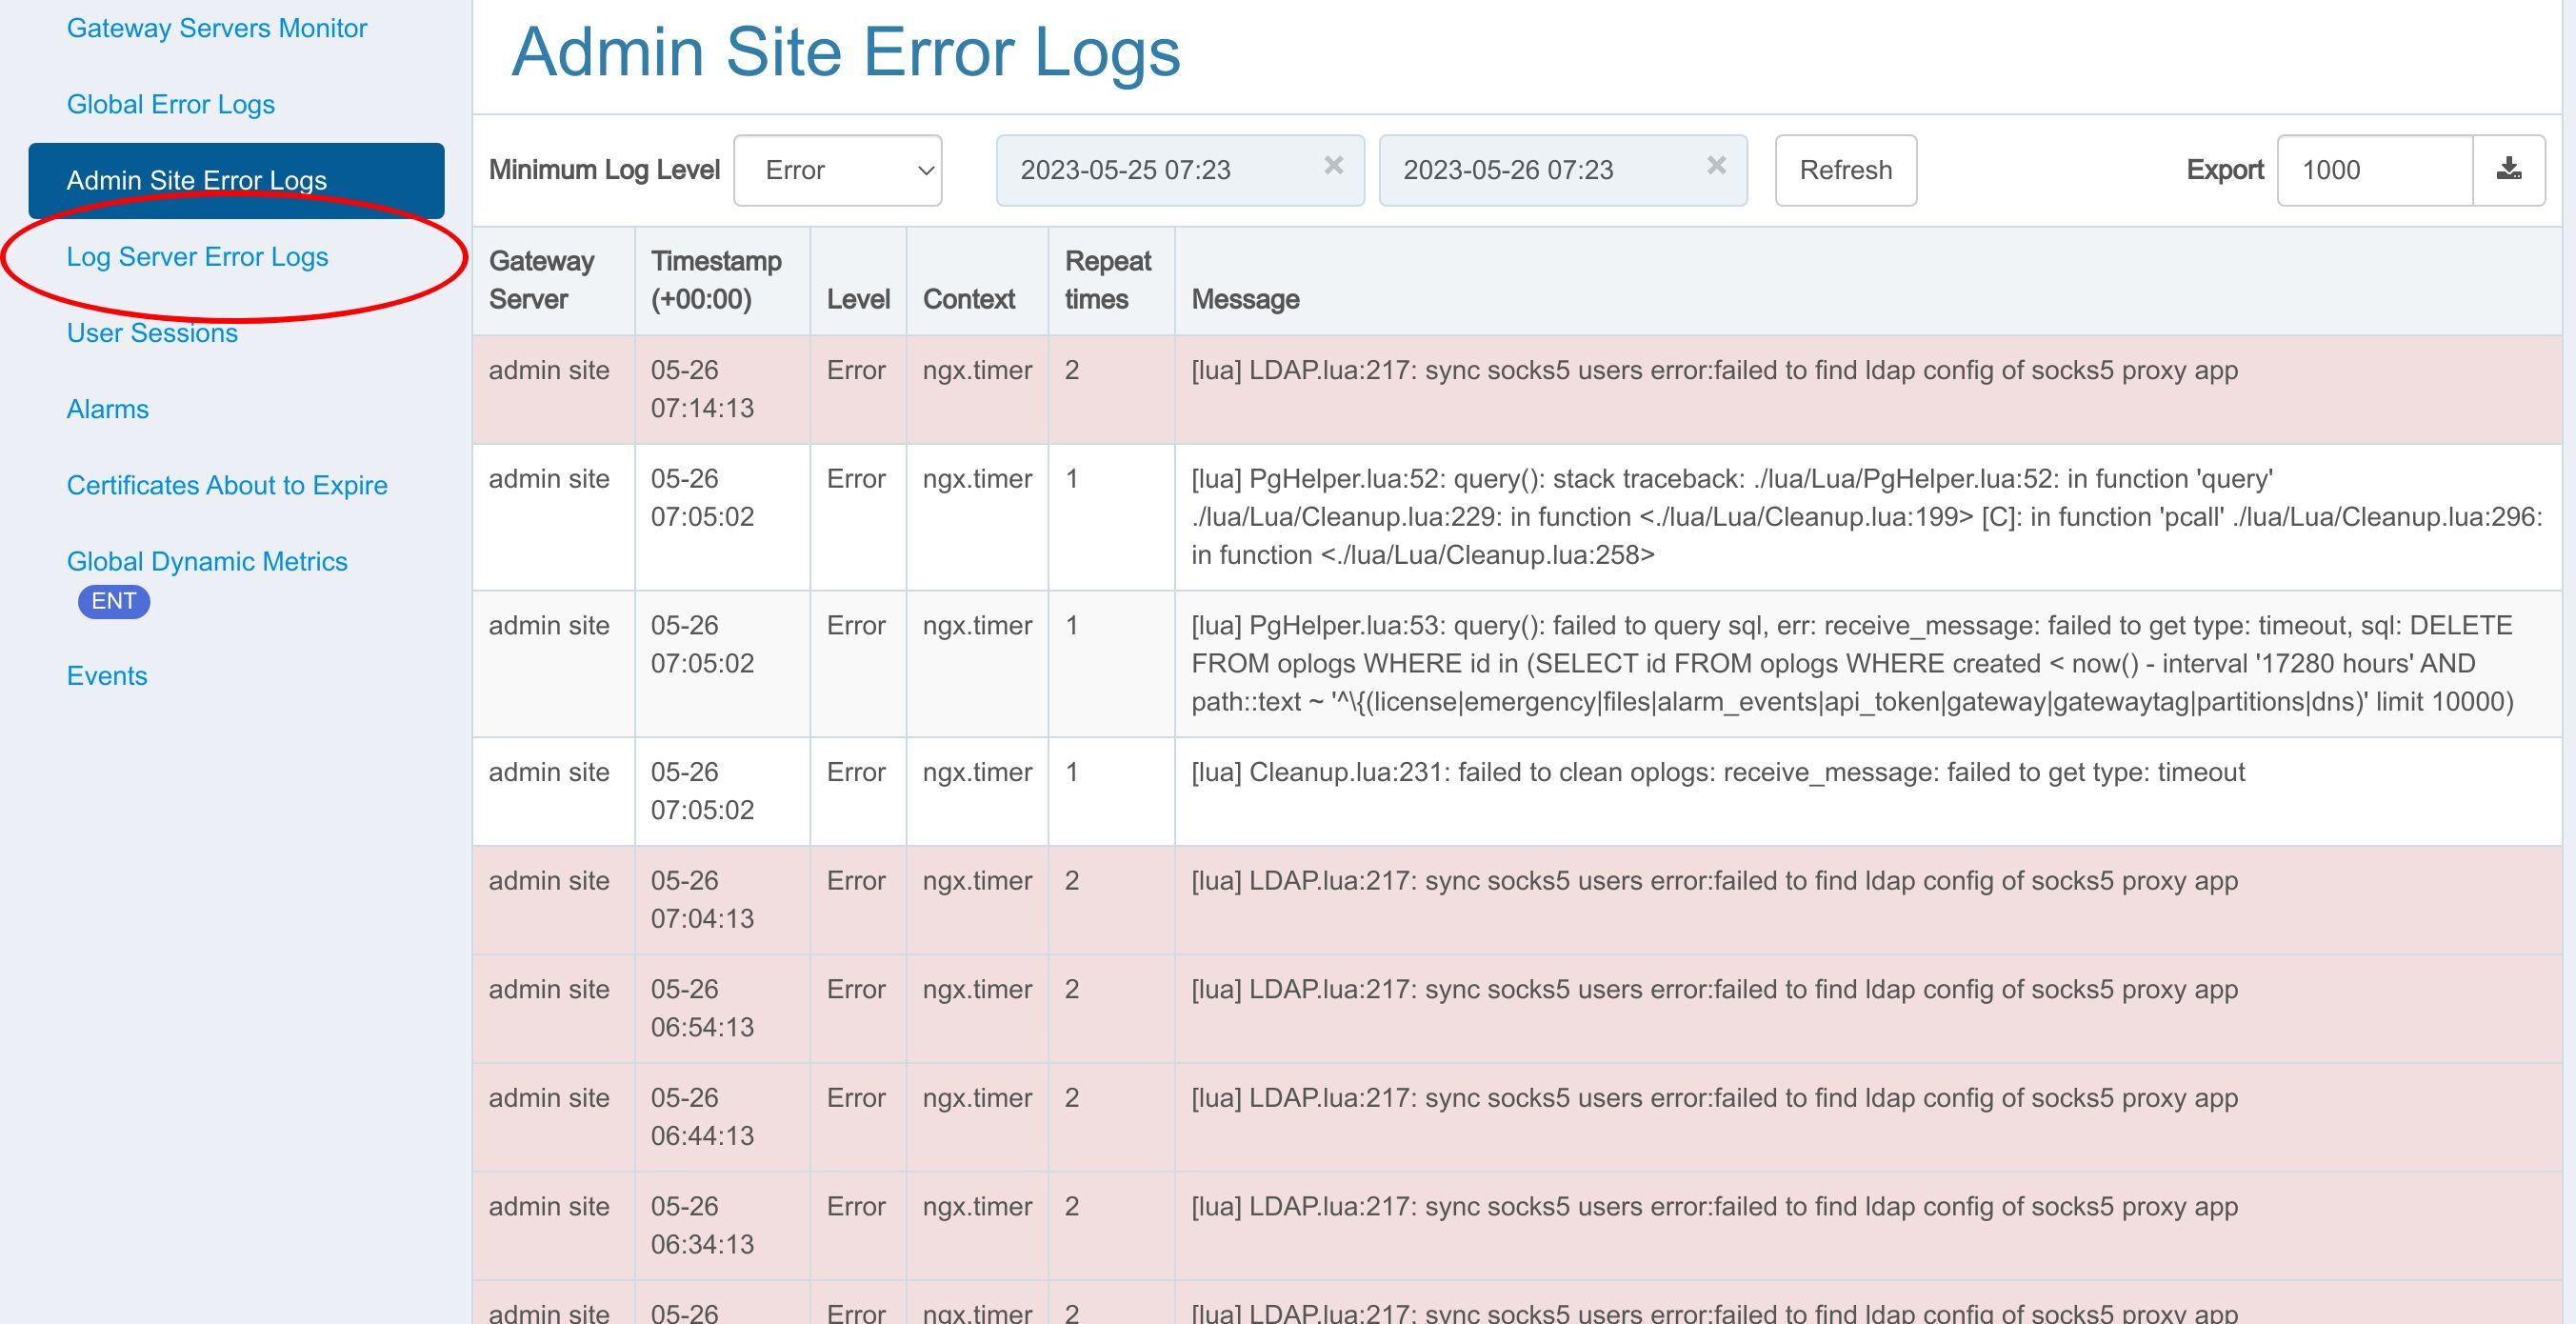
Let’s continue to see the Admin Site Error logs.
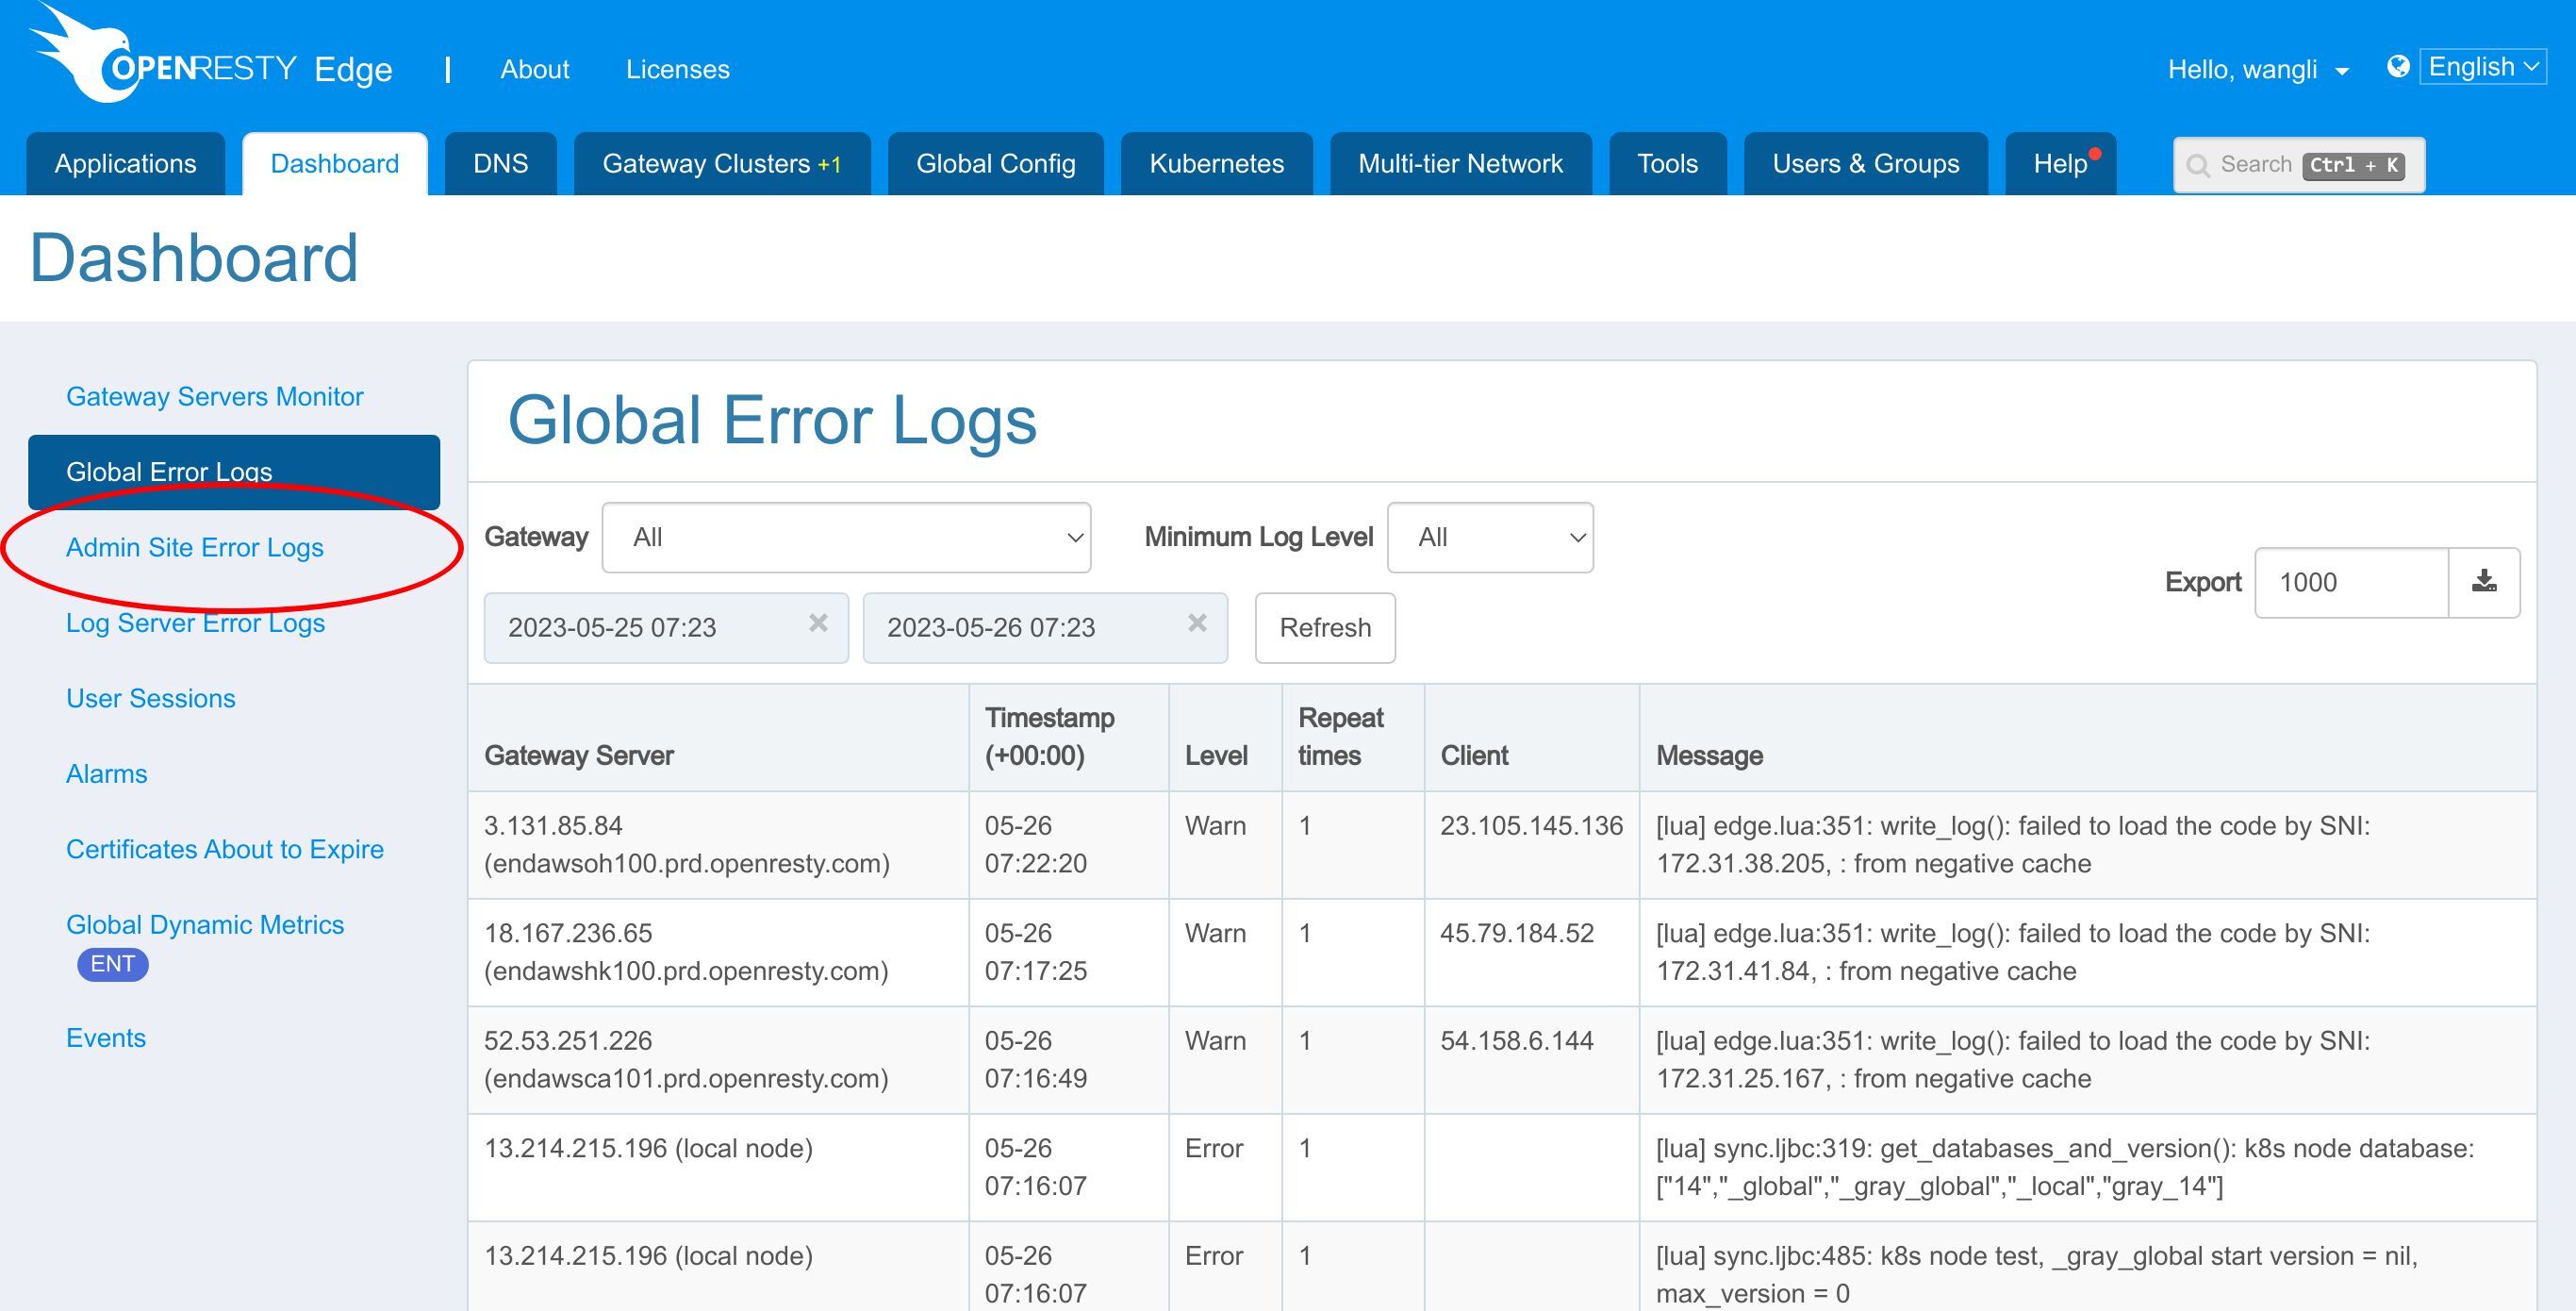
These error logs are collected from the Admin console.
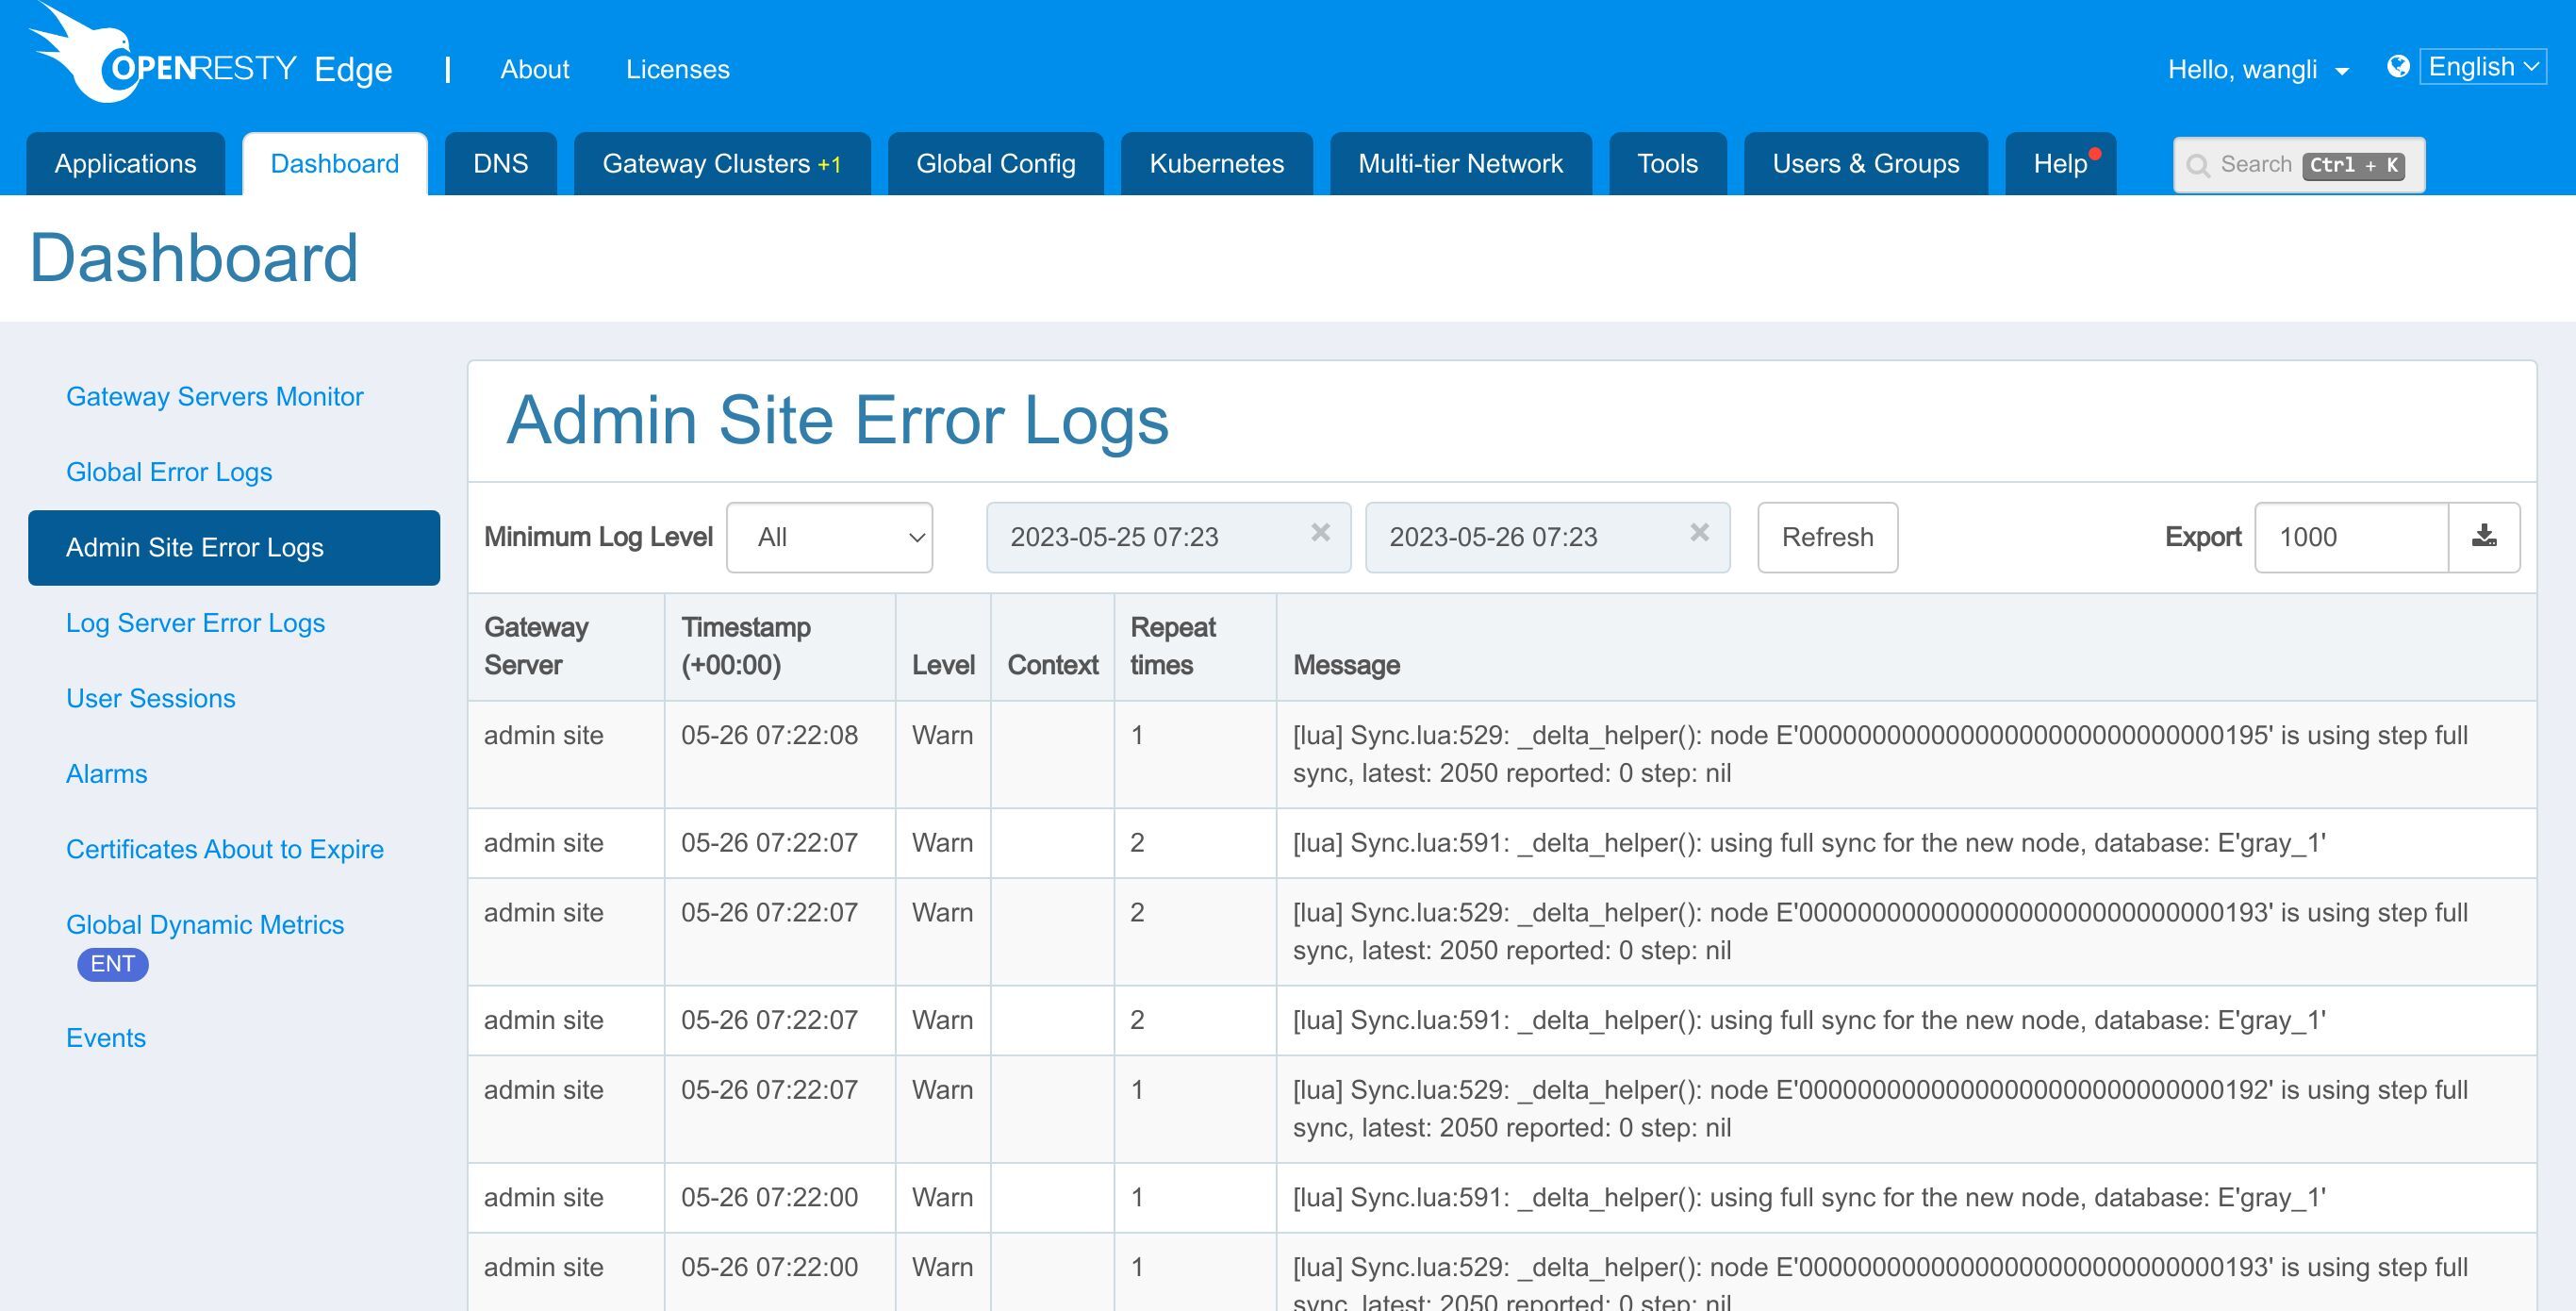
We also support conditional filtering of logs.
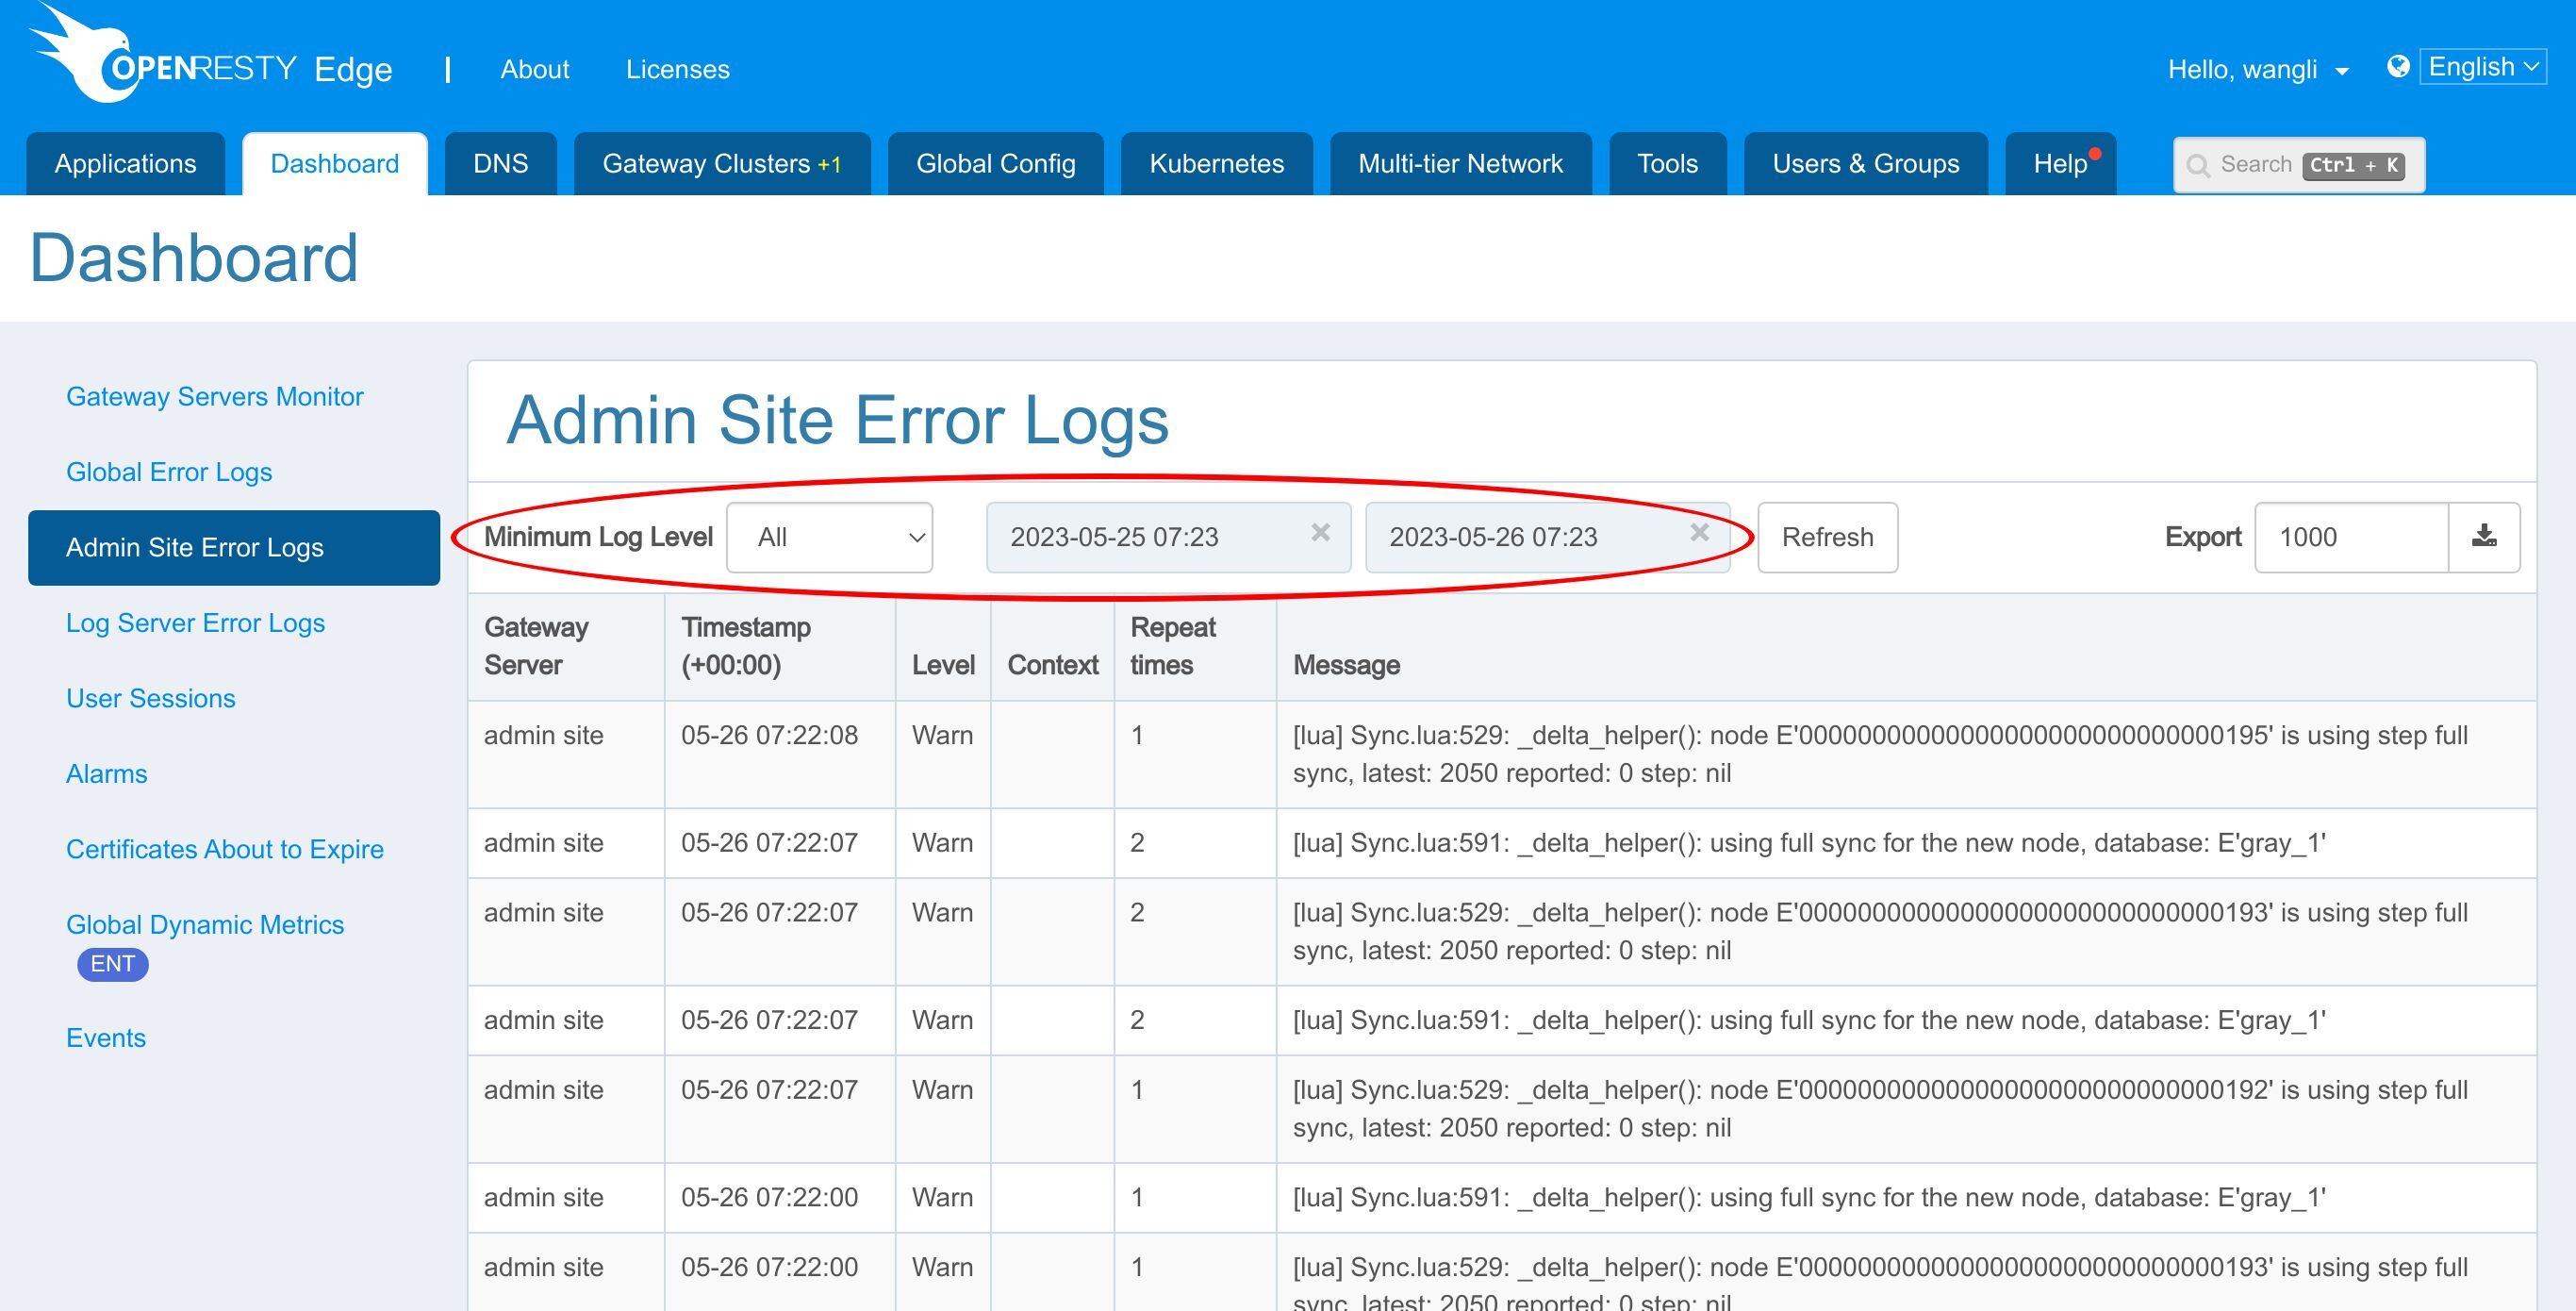
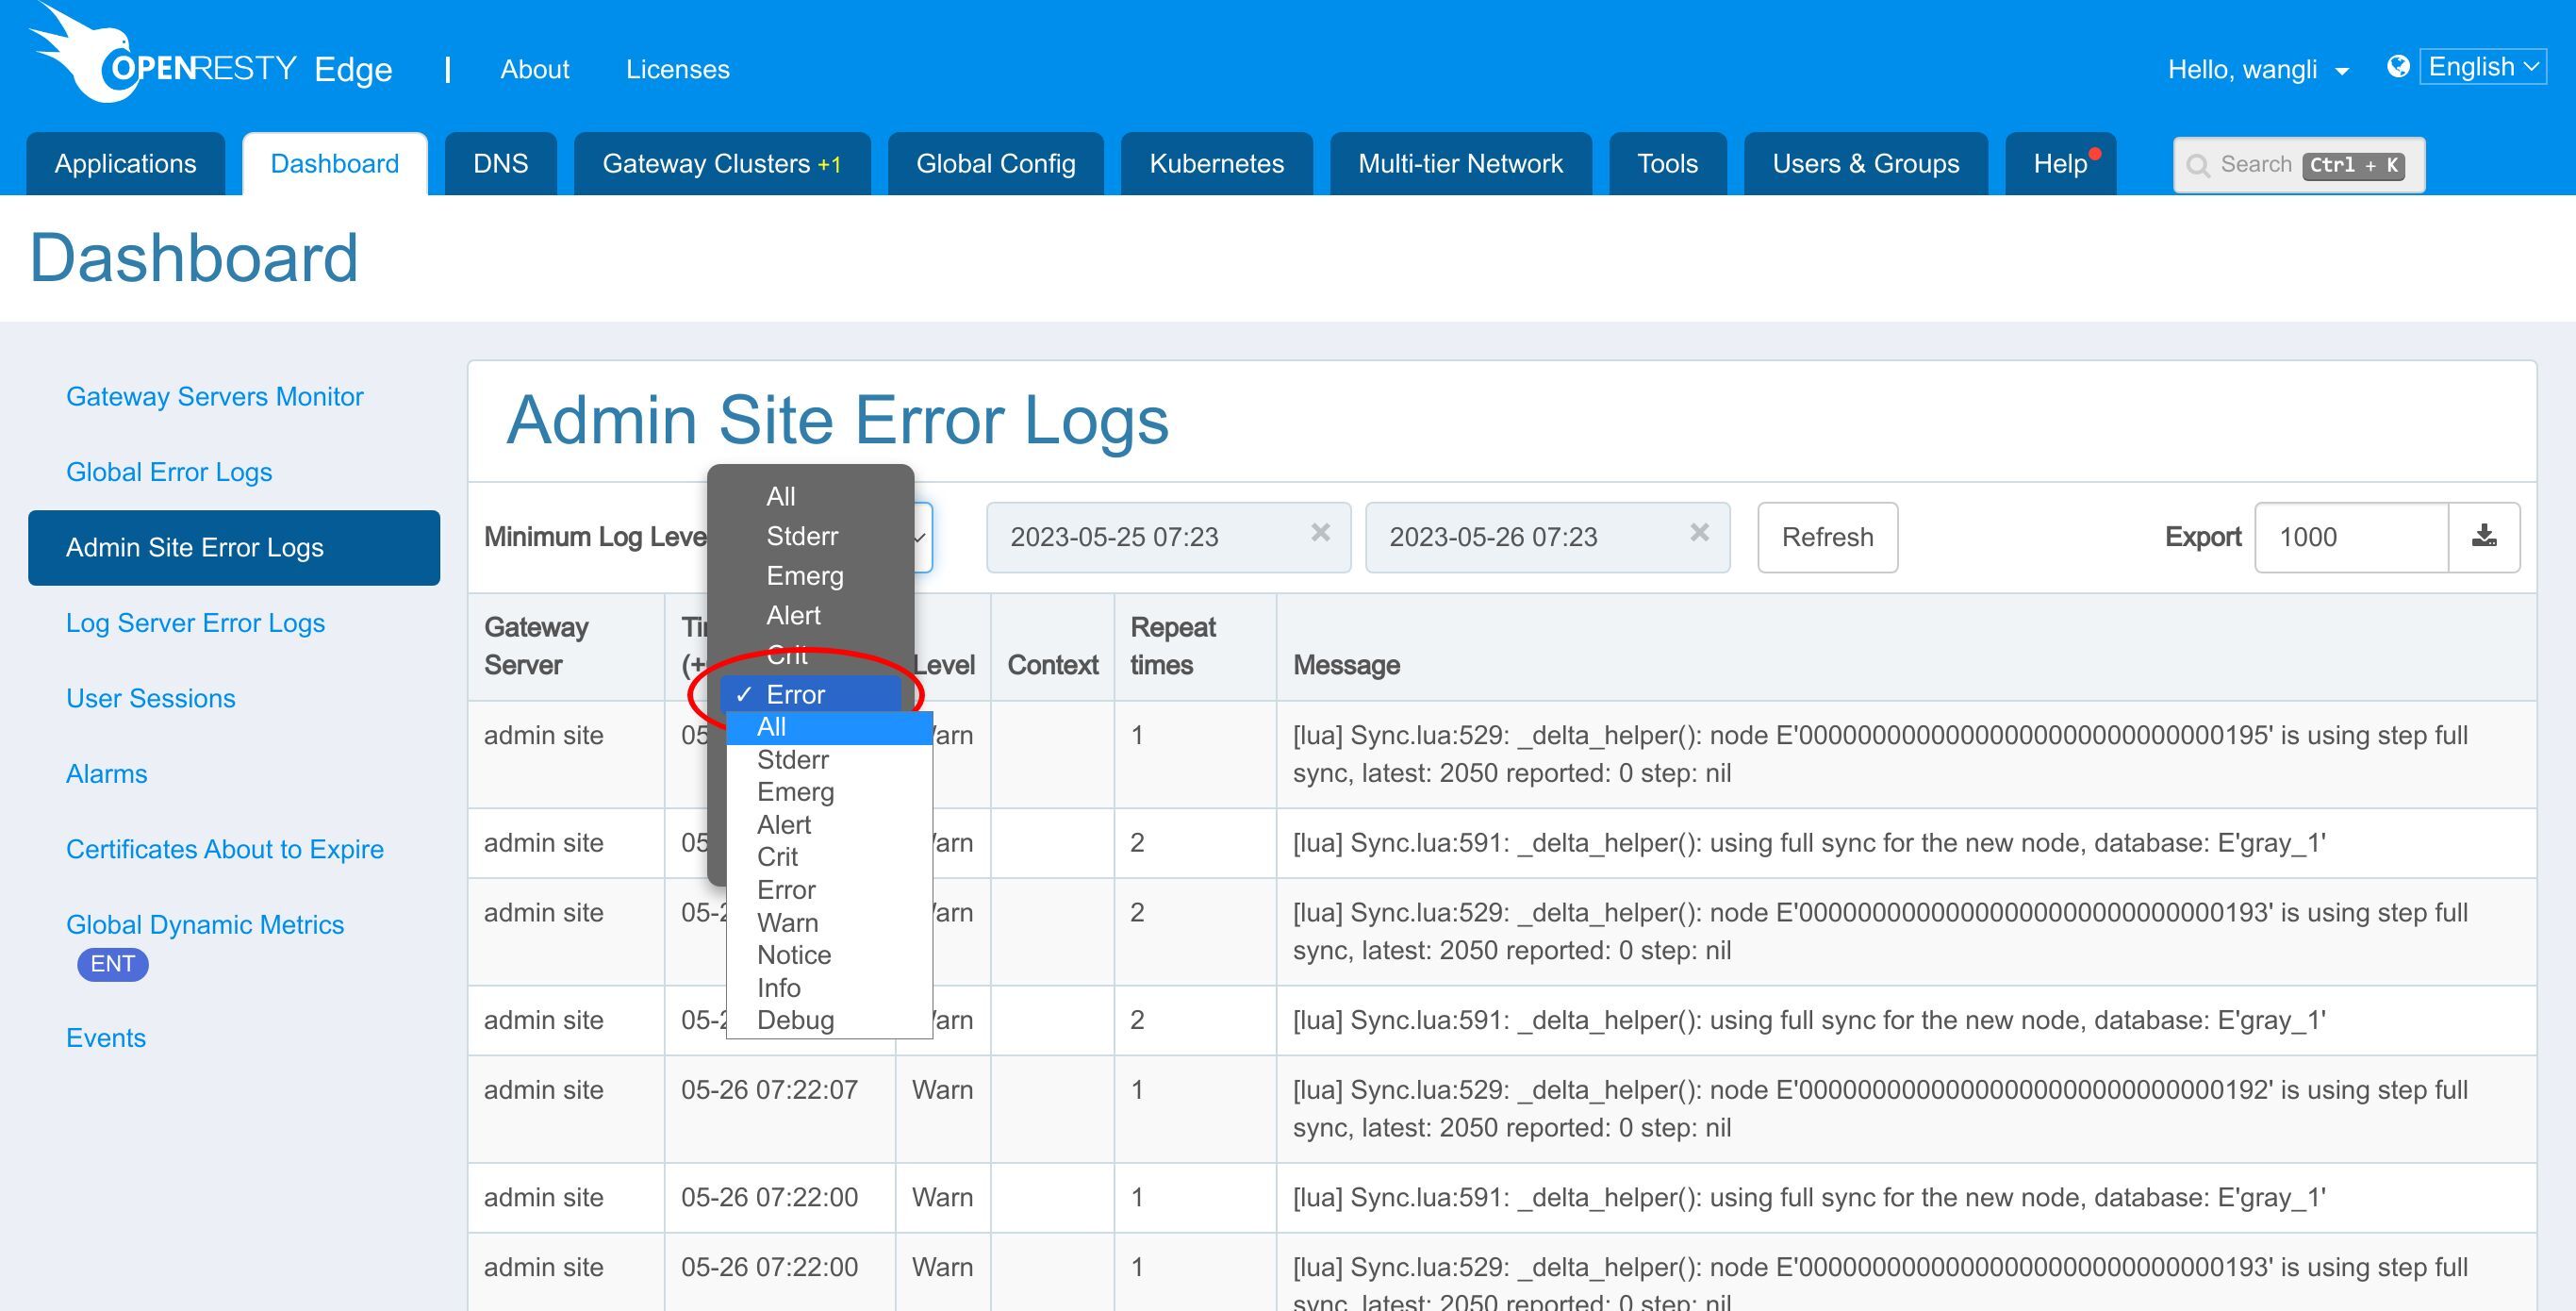
Let’s select the Log Level “Error”.
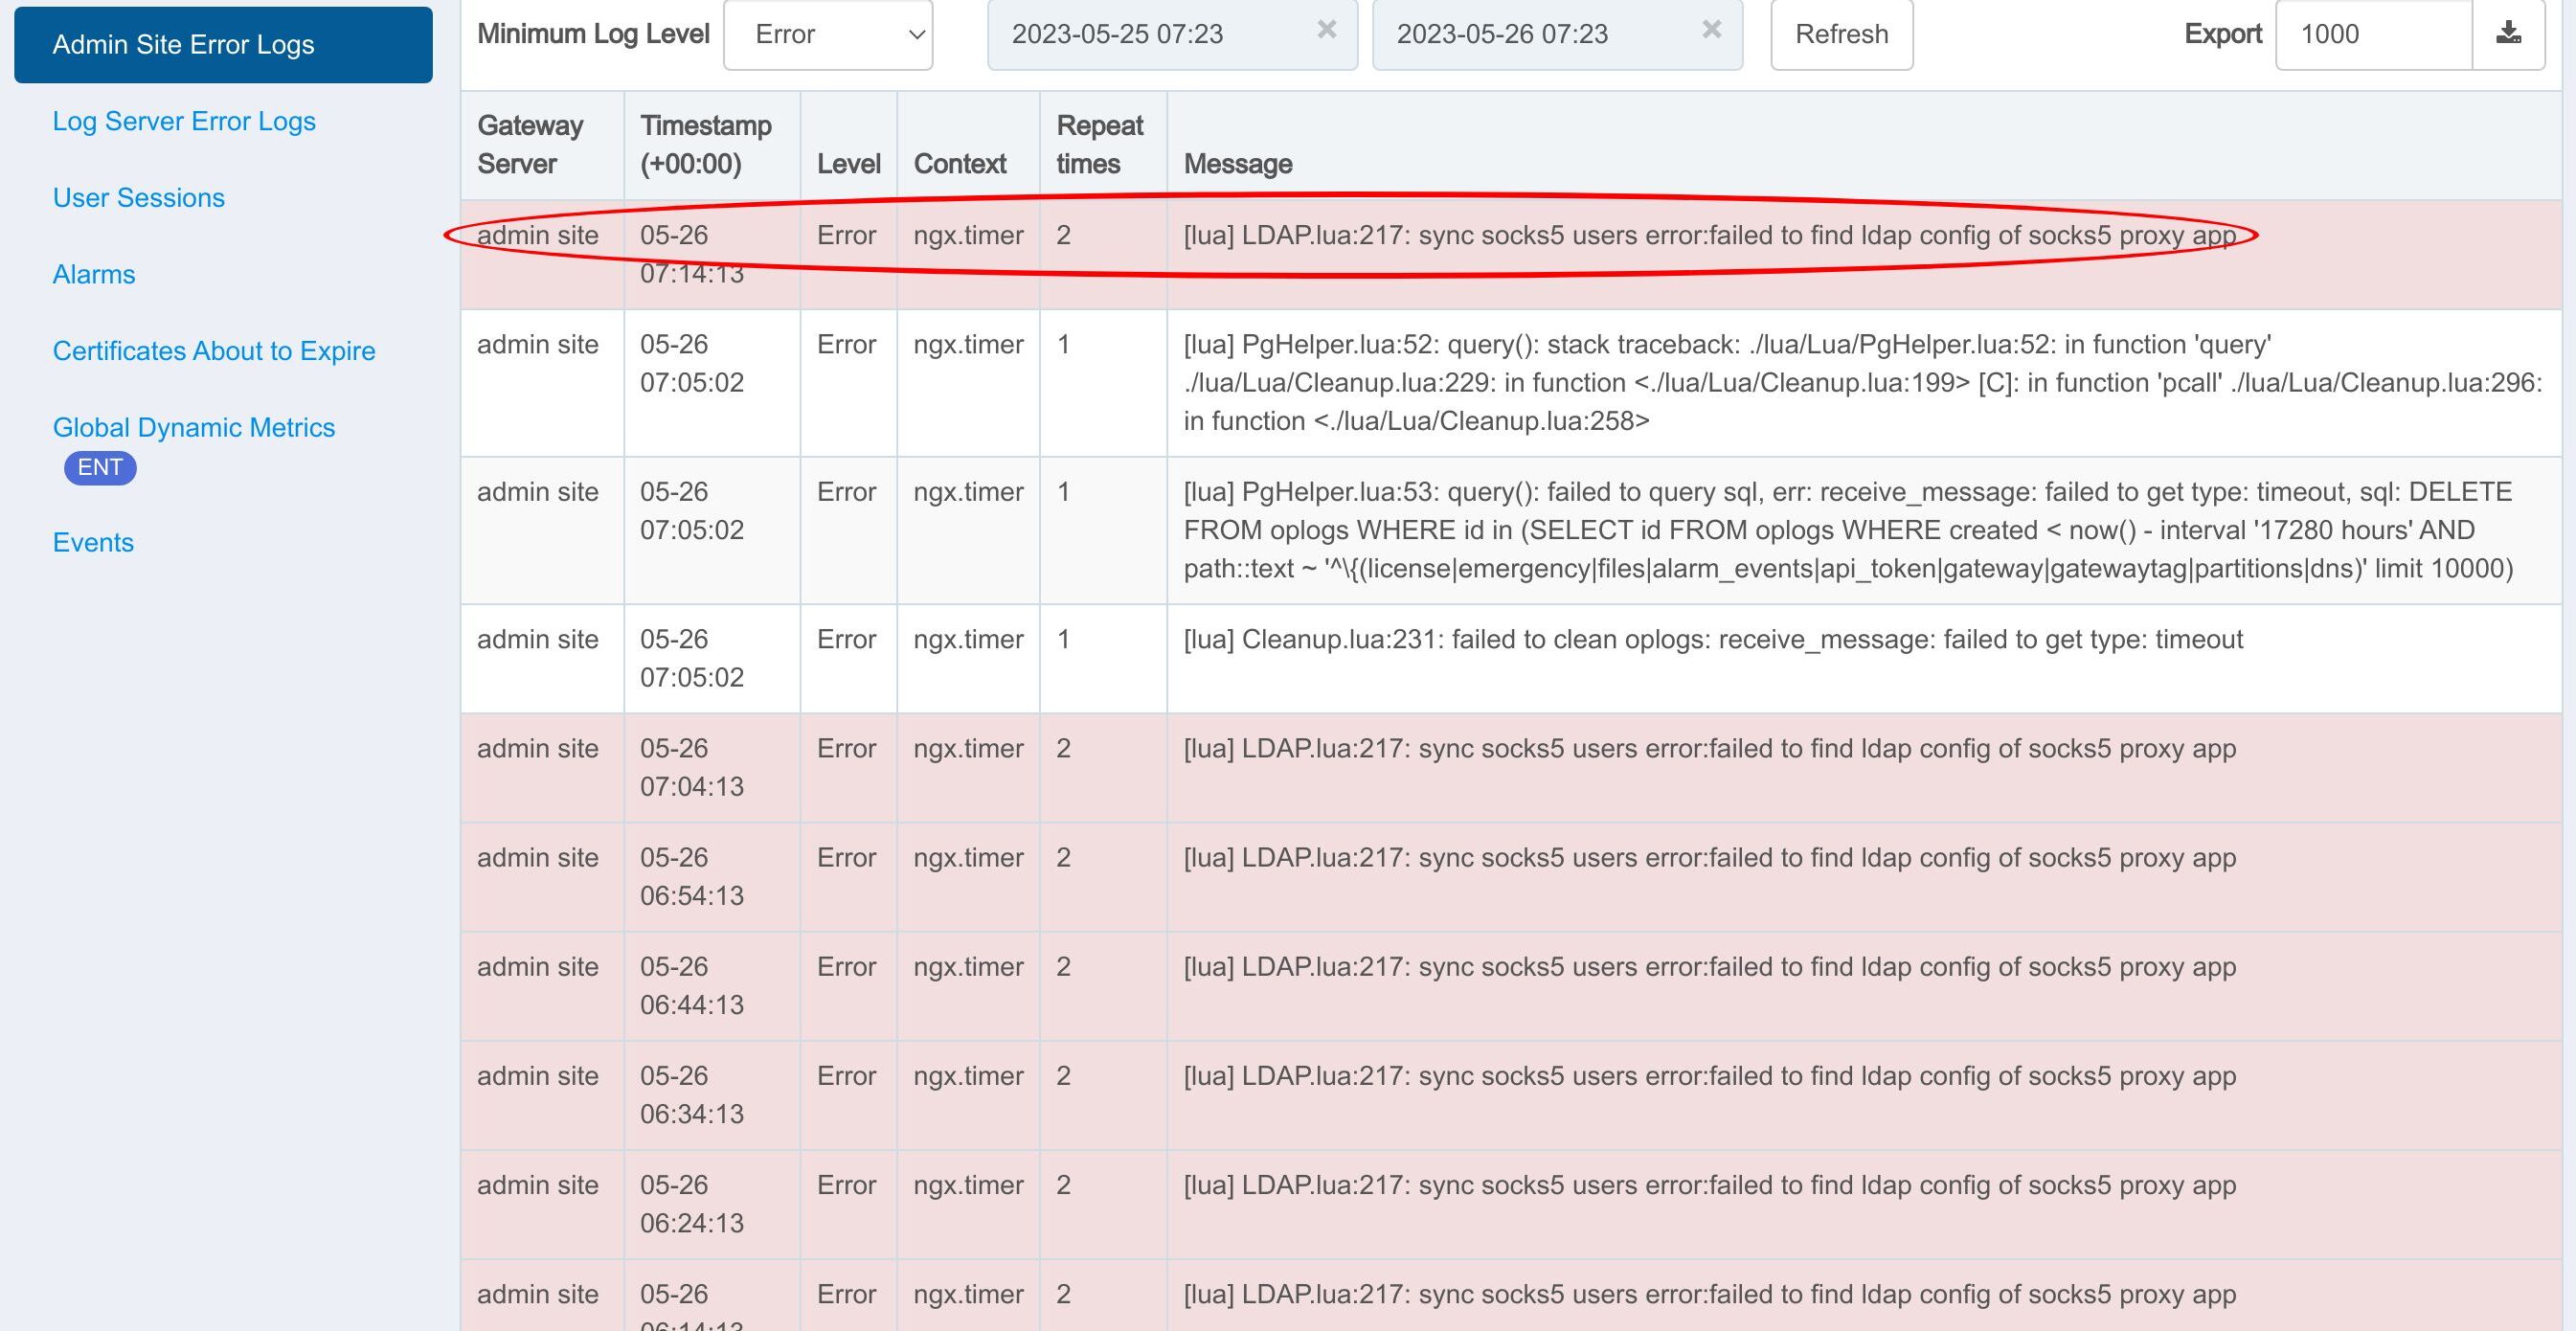
We have highlighted logs with “error” levels and repeat times greater than 1.
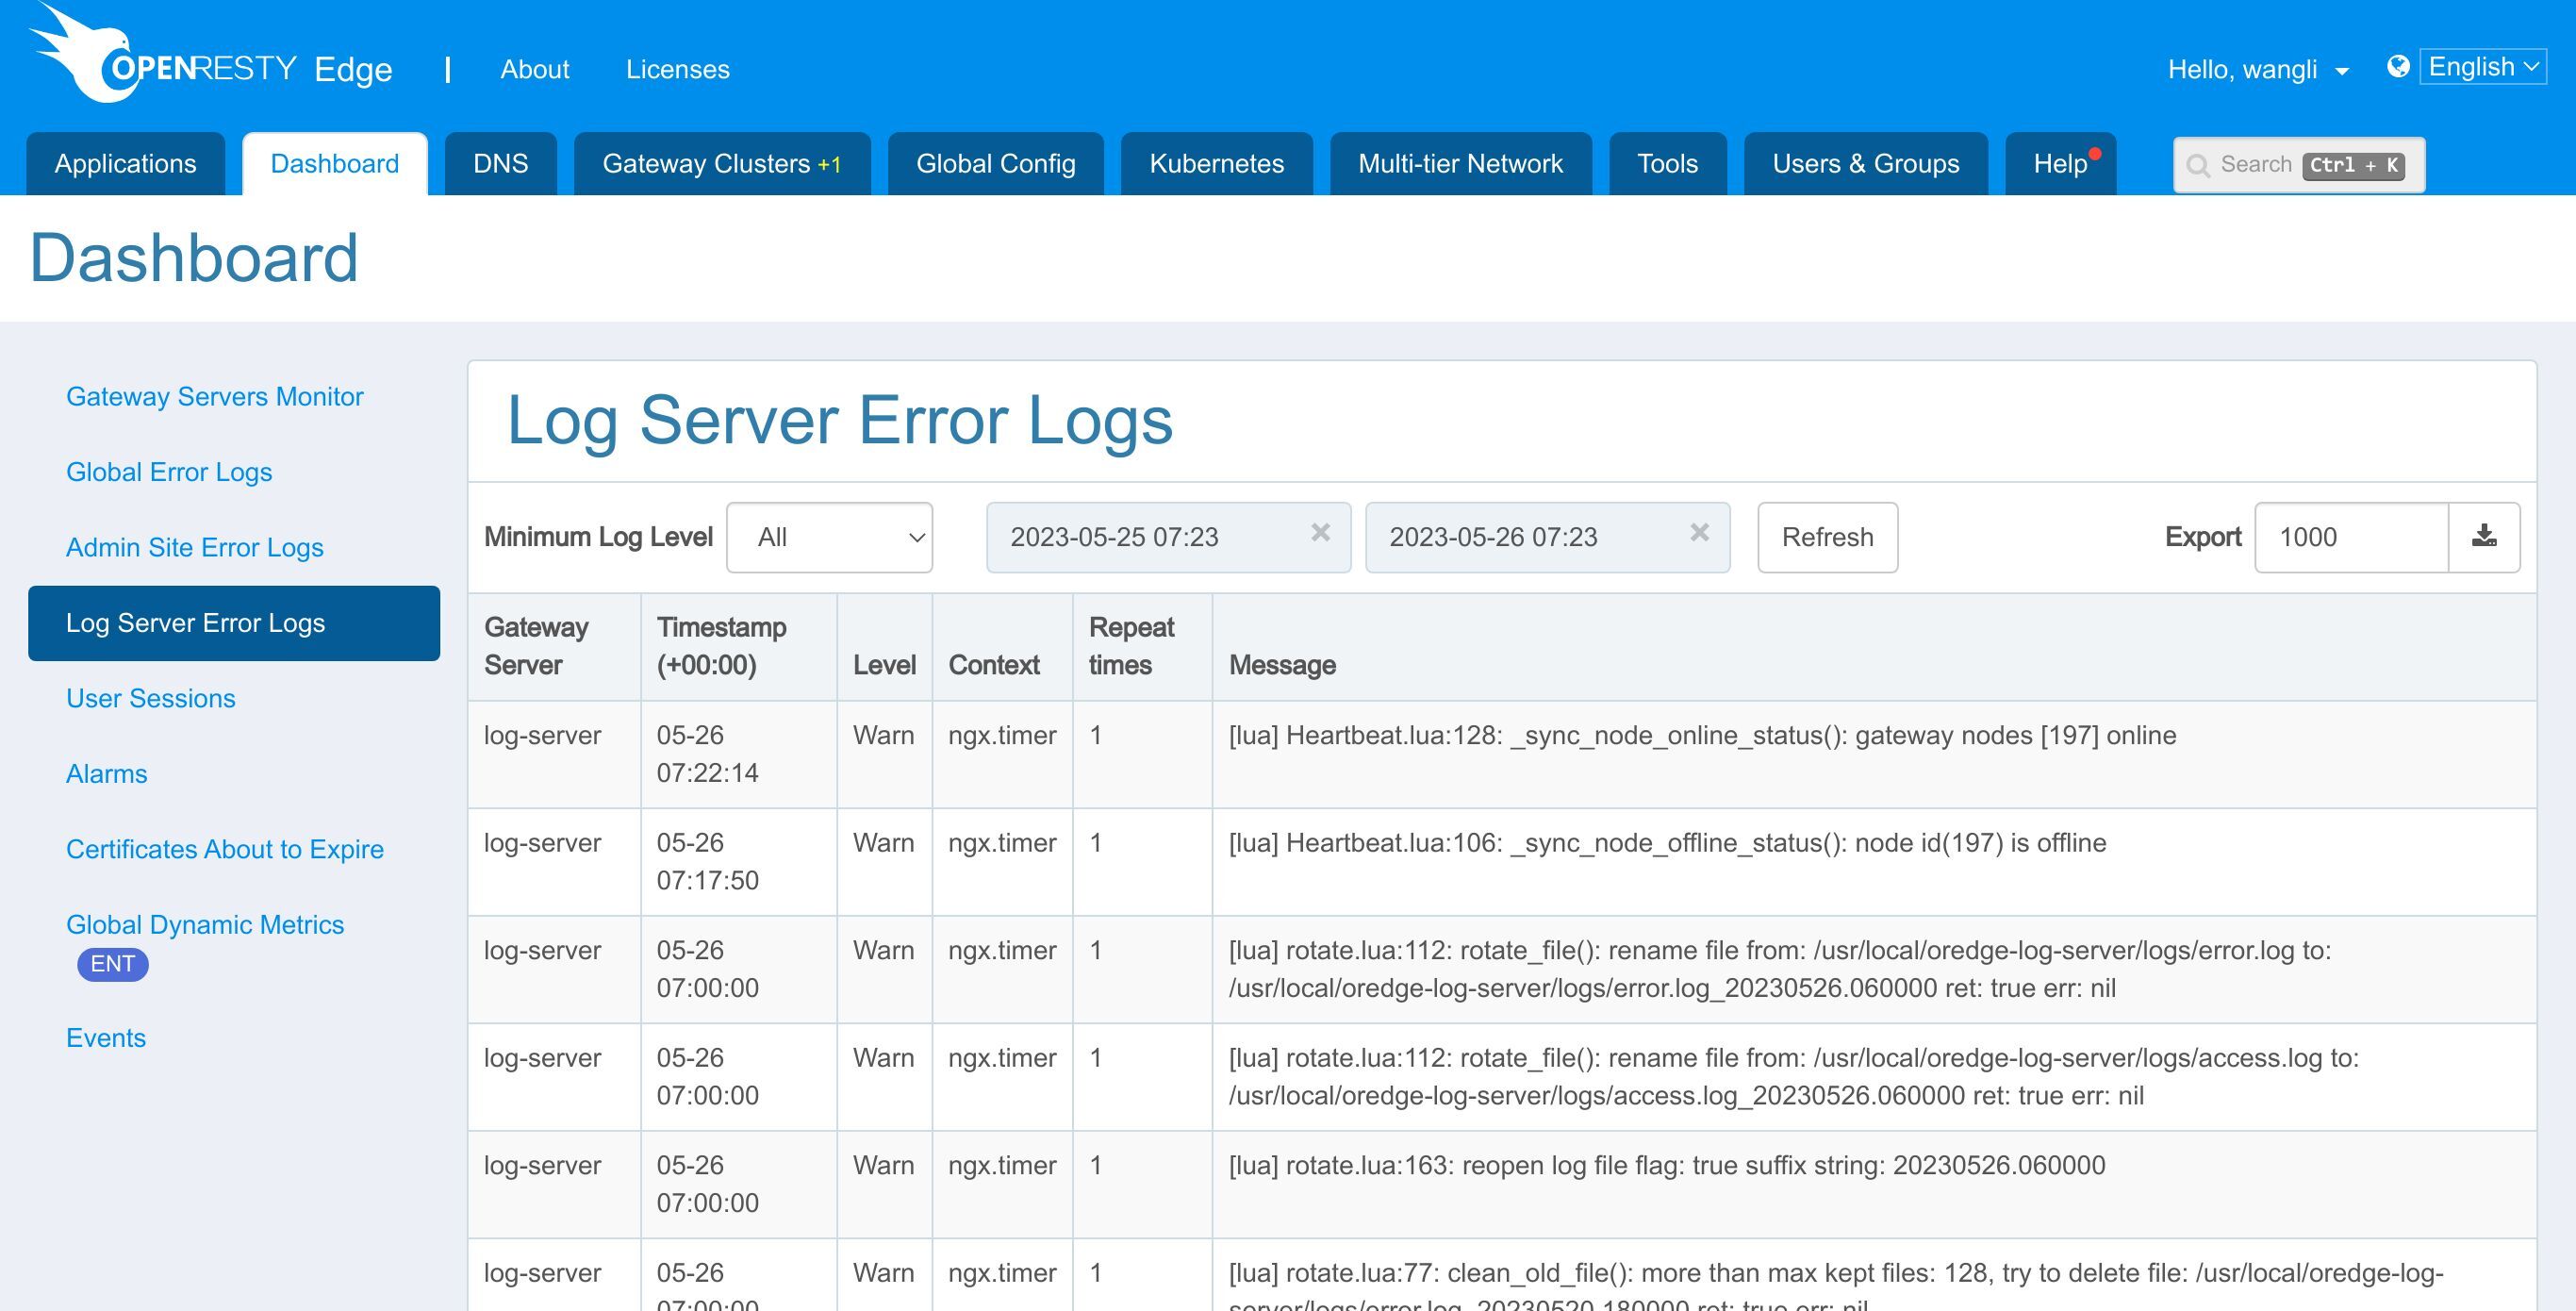
And last, let’s see the Log Server Error logs.
Error logs collected are from the OpenResty Edge Log Server.
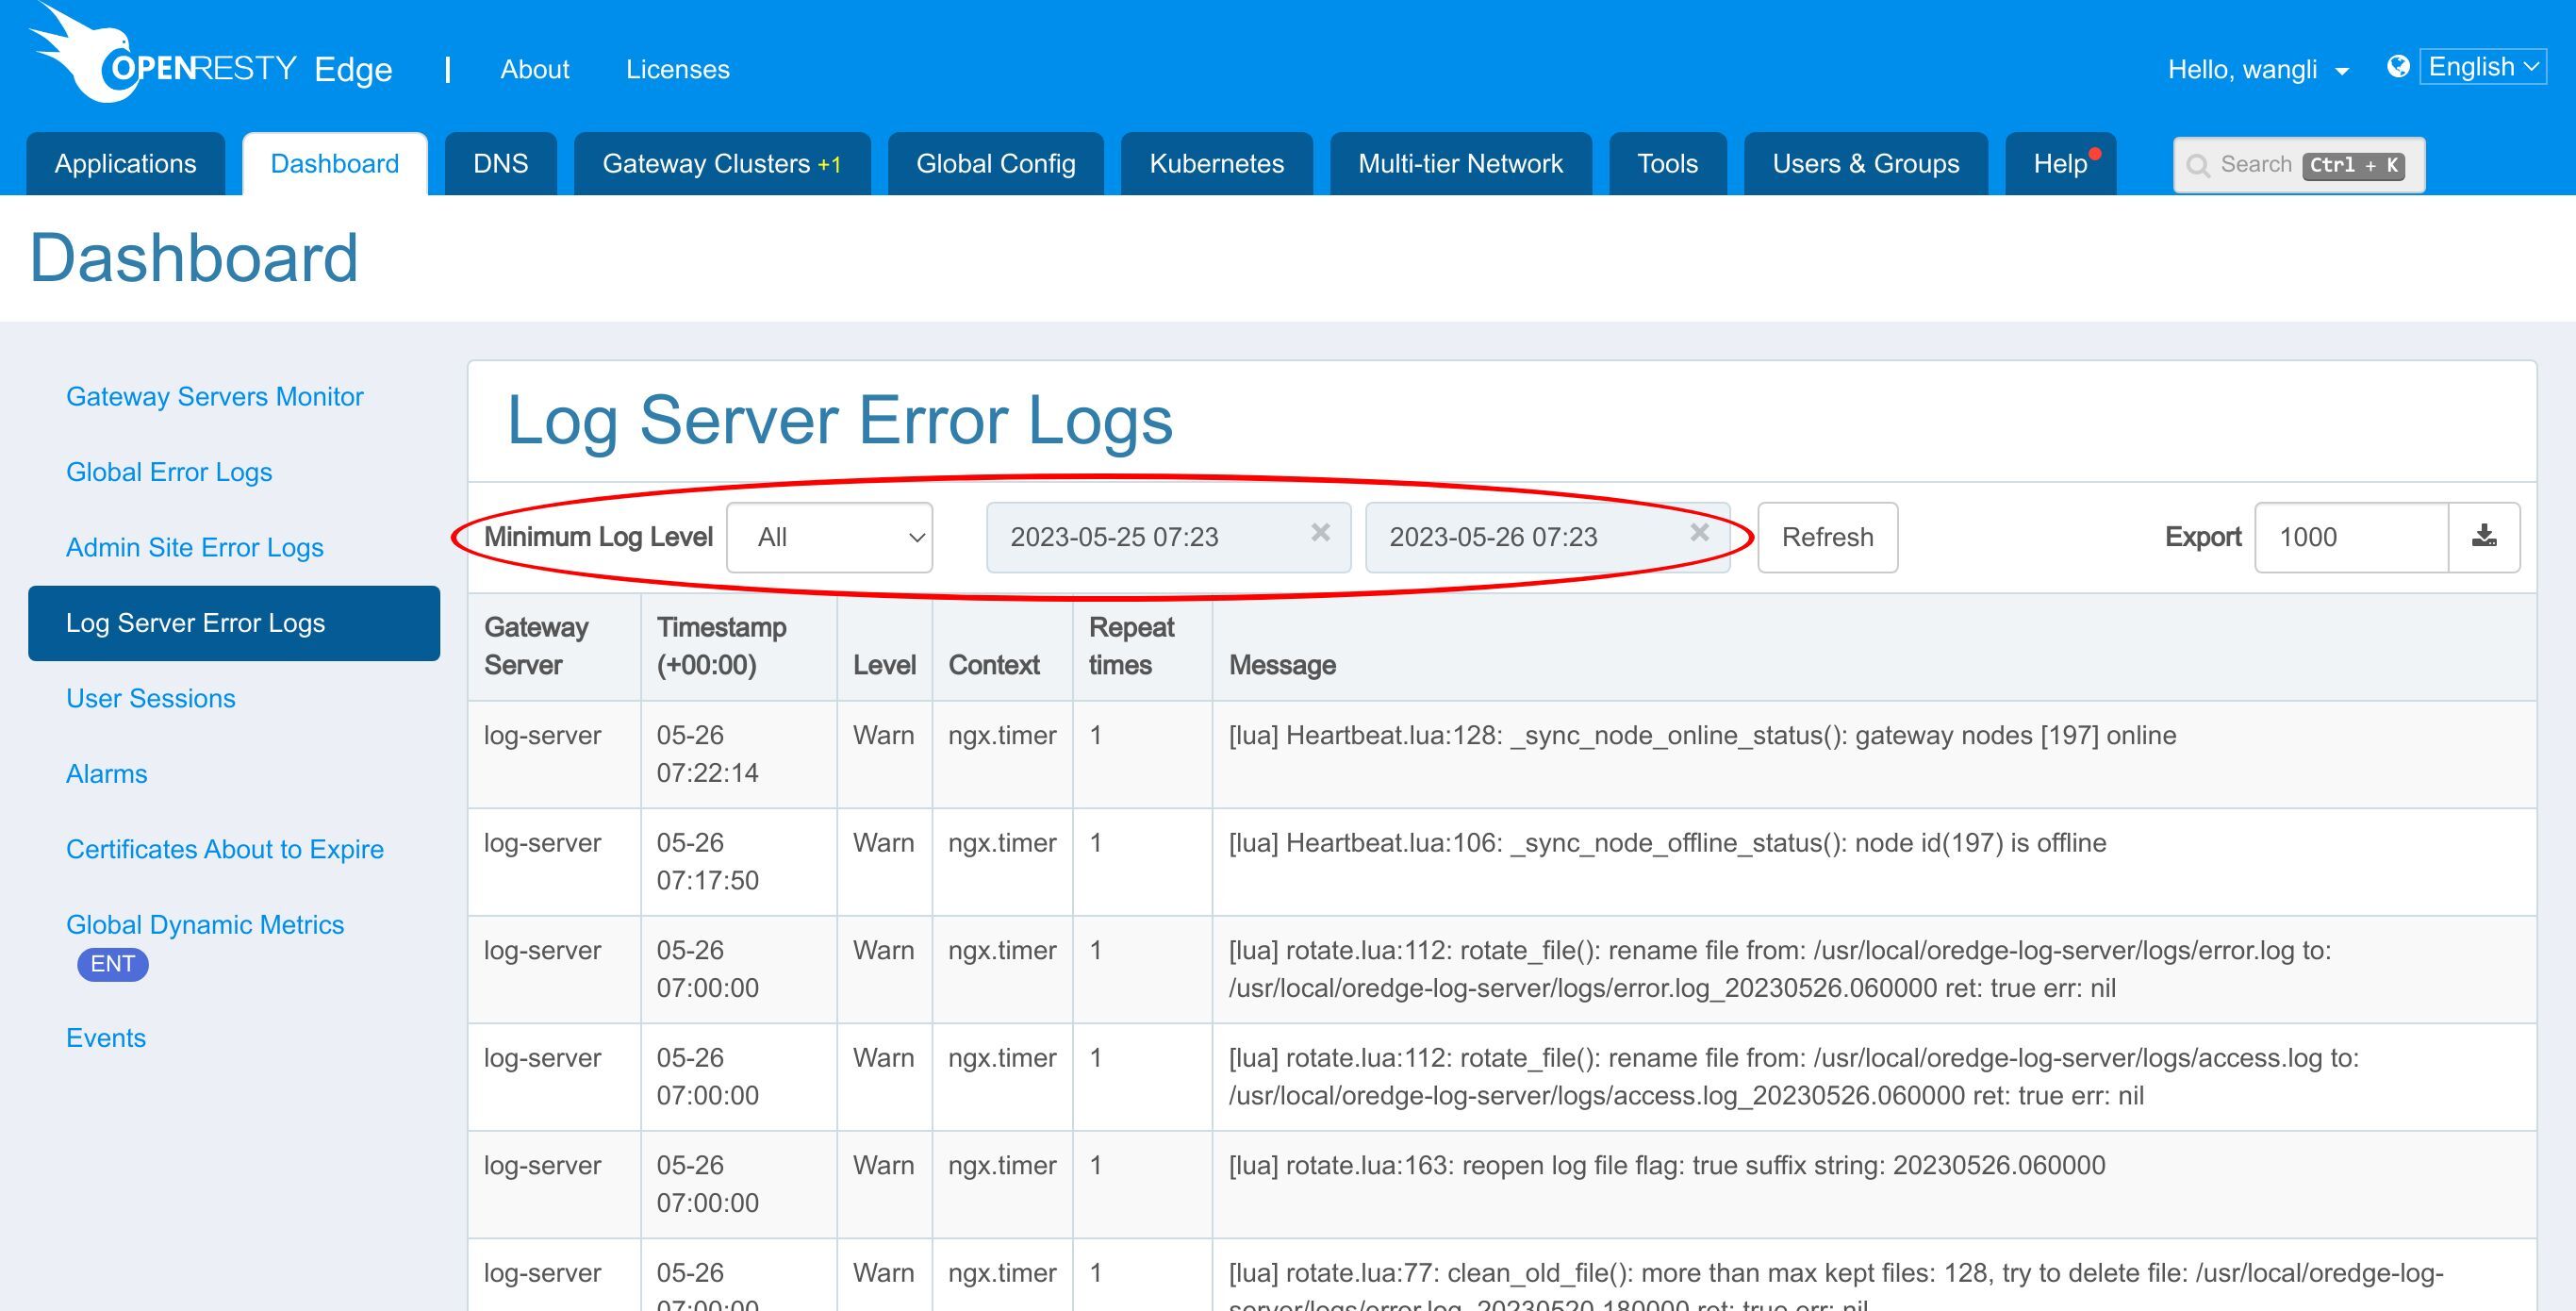
And we can also filter the logs.
As we can see, there are log levels for both global and application logs, but not every log level we have reported.
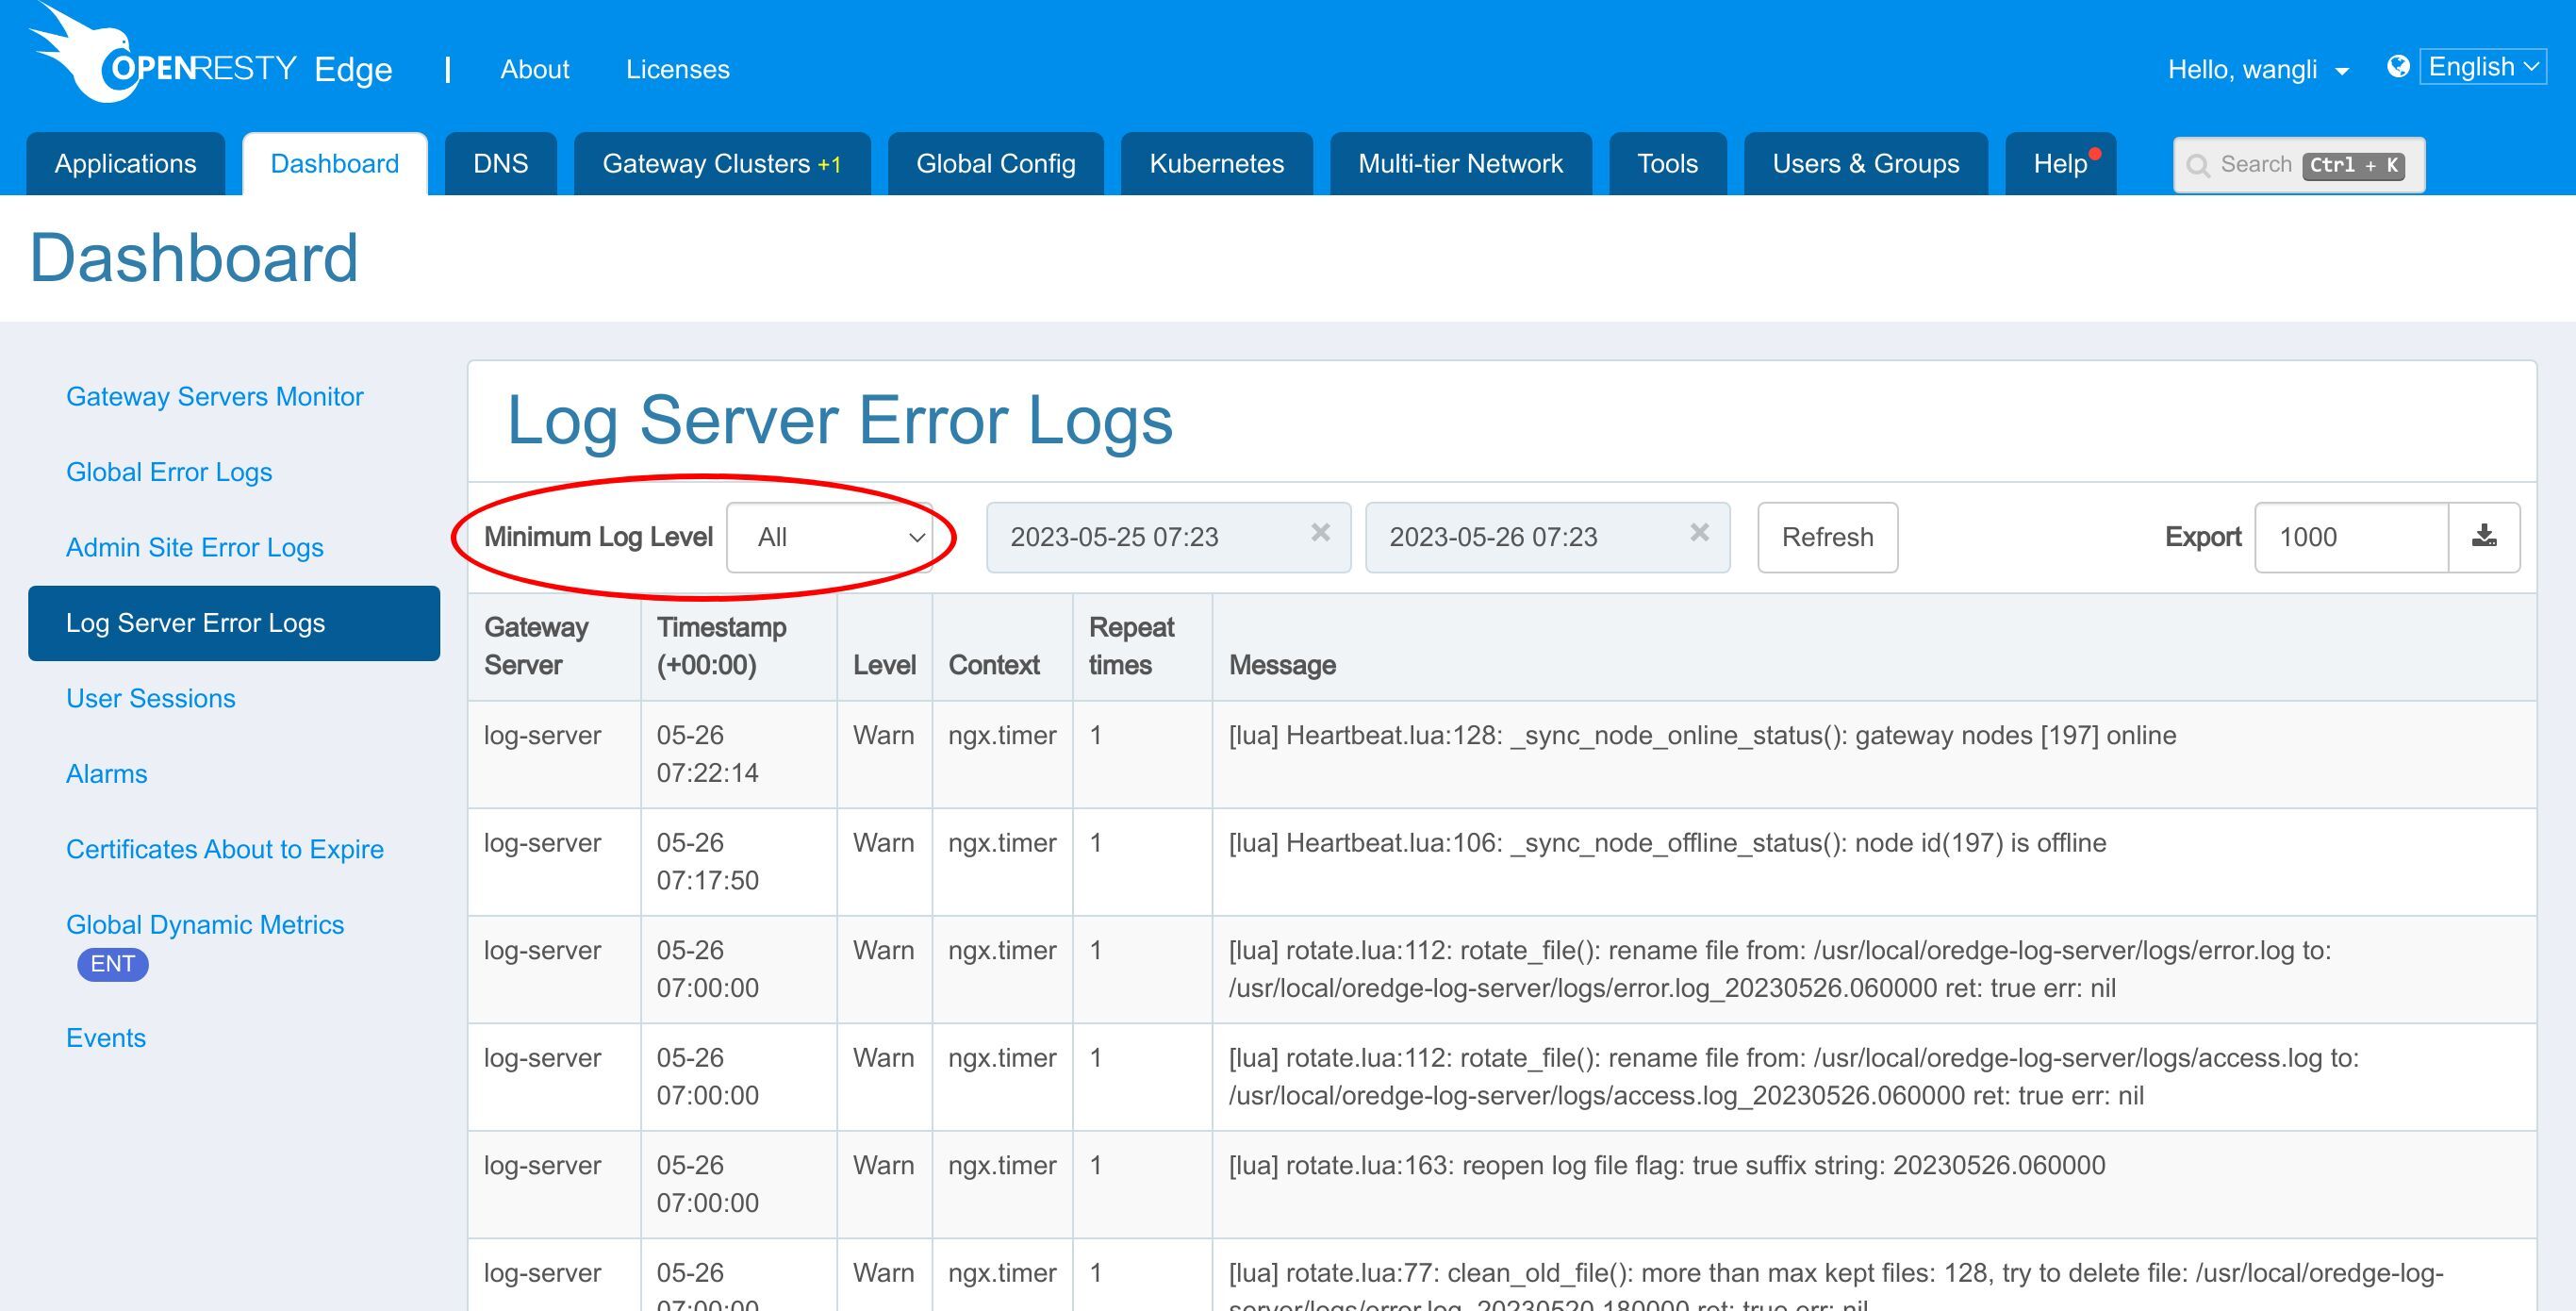
The log level to be reported can be set on the global config page.
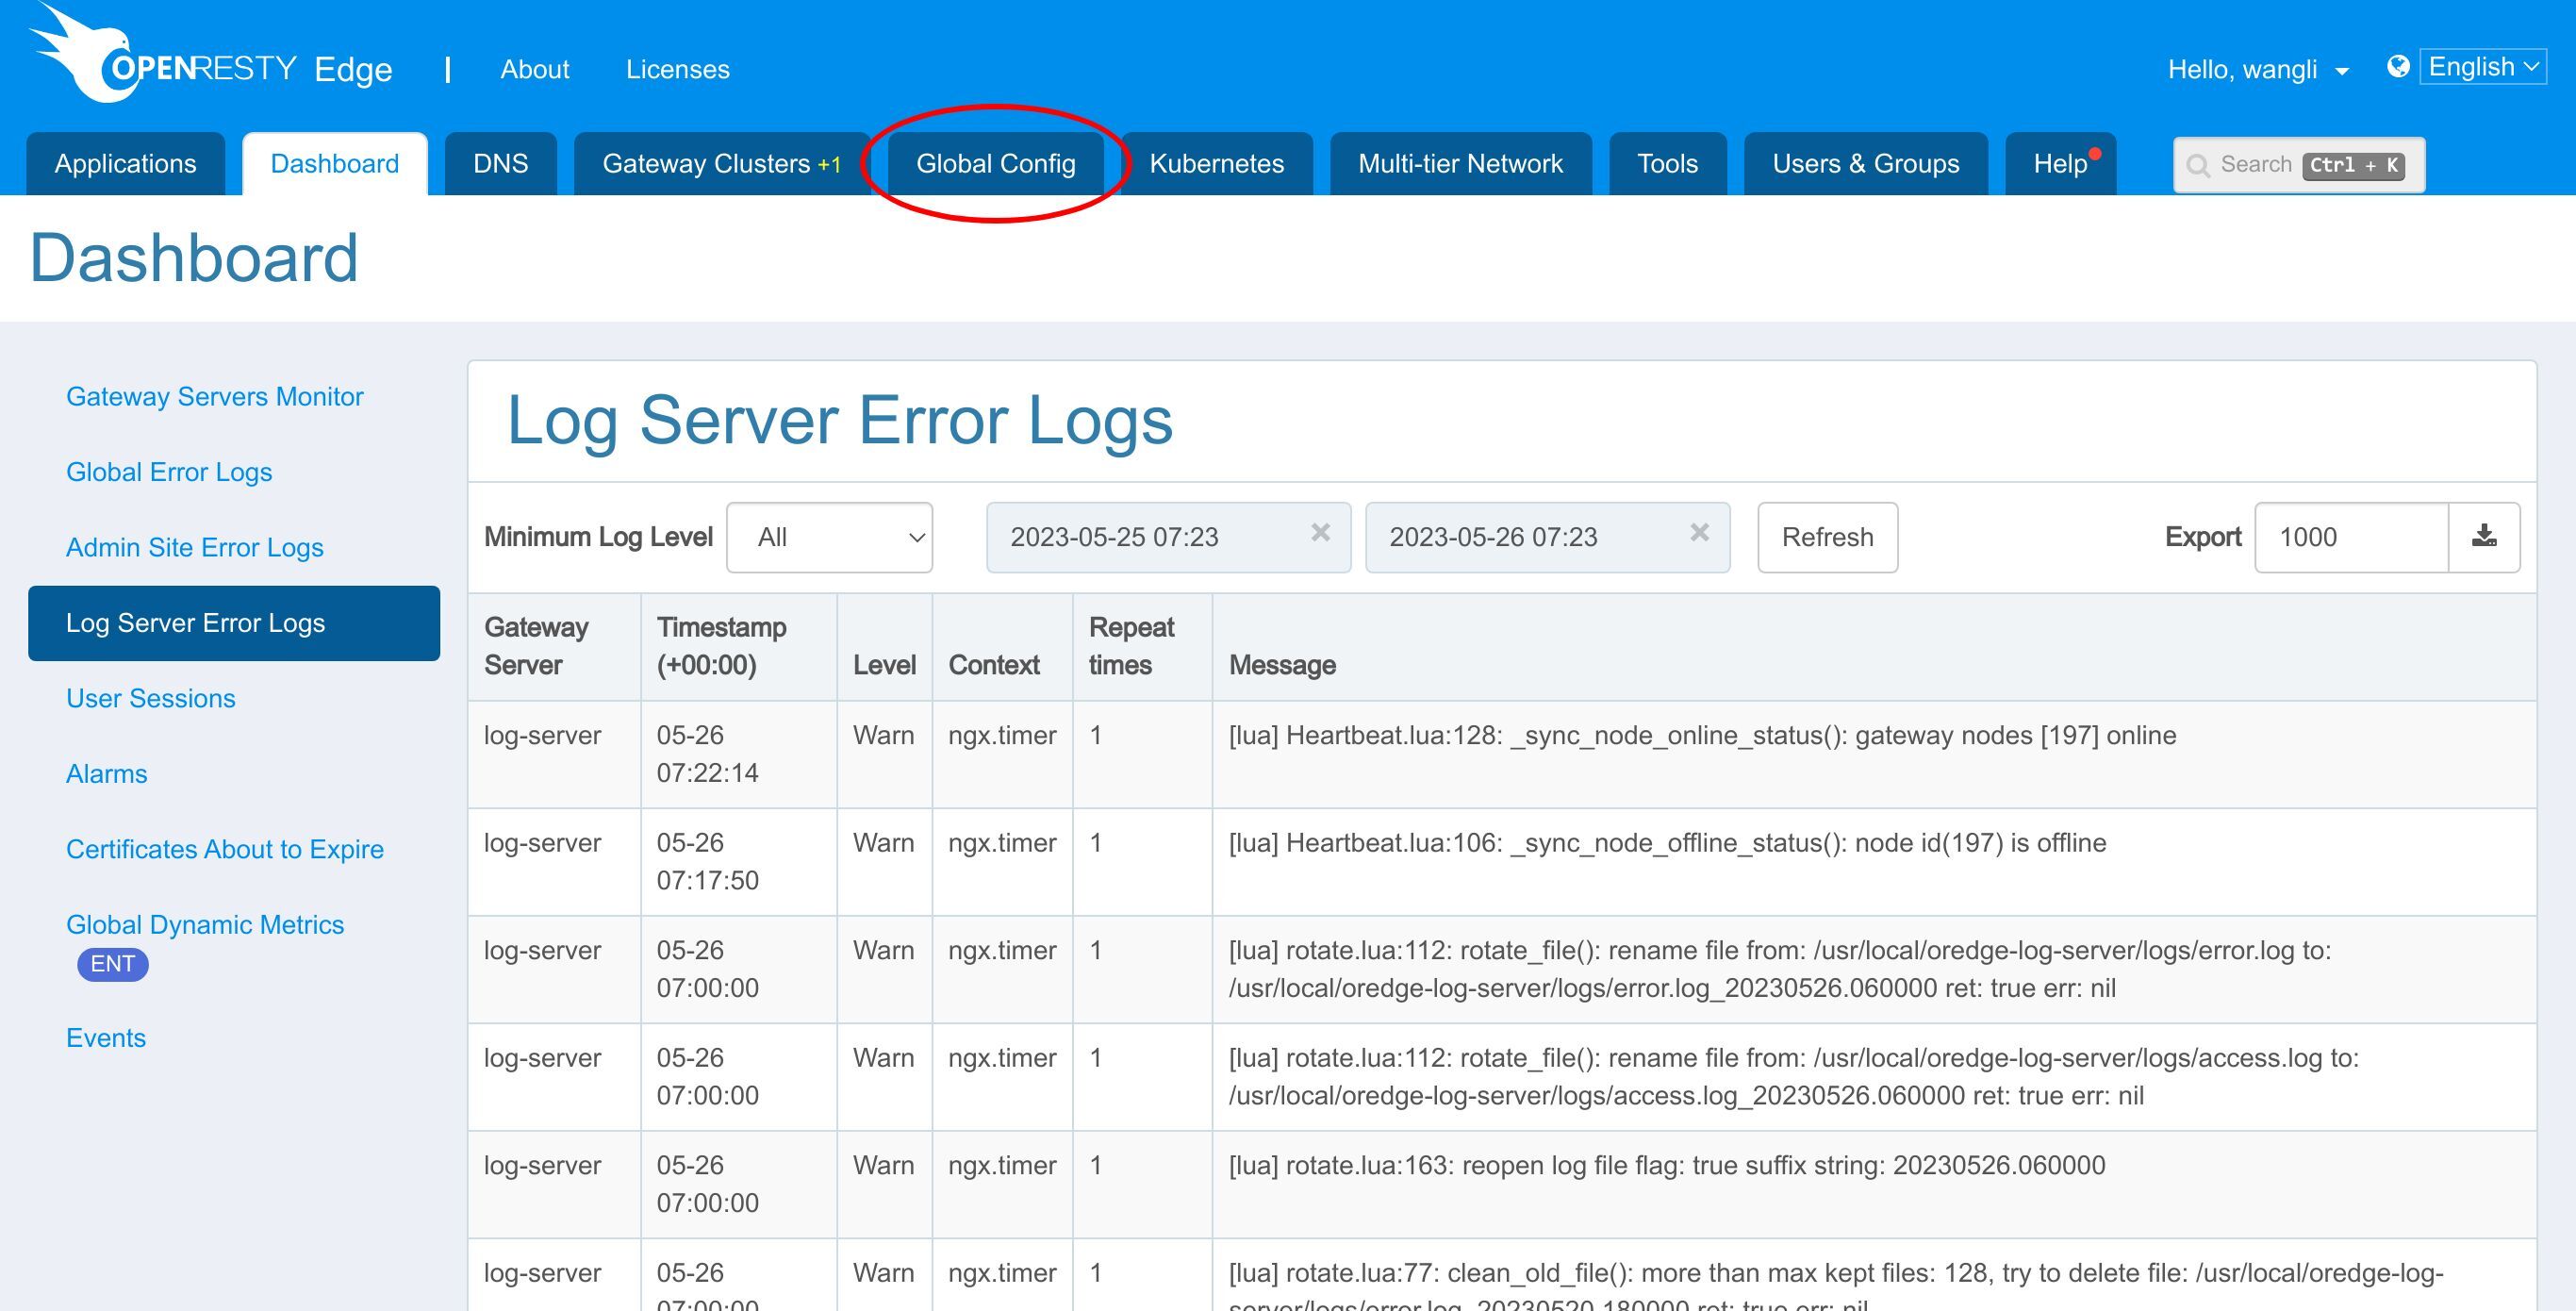
Here we set it to “warn”, meaning only warnings and log messages of higher levels are reported.
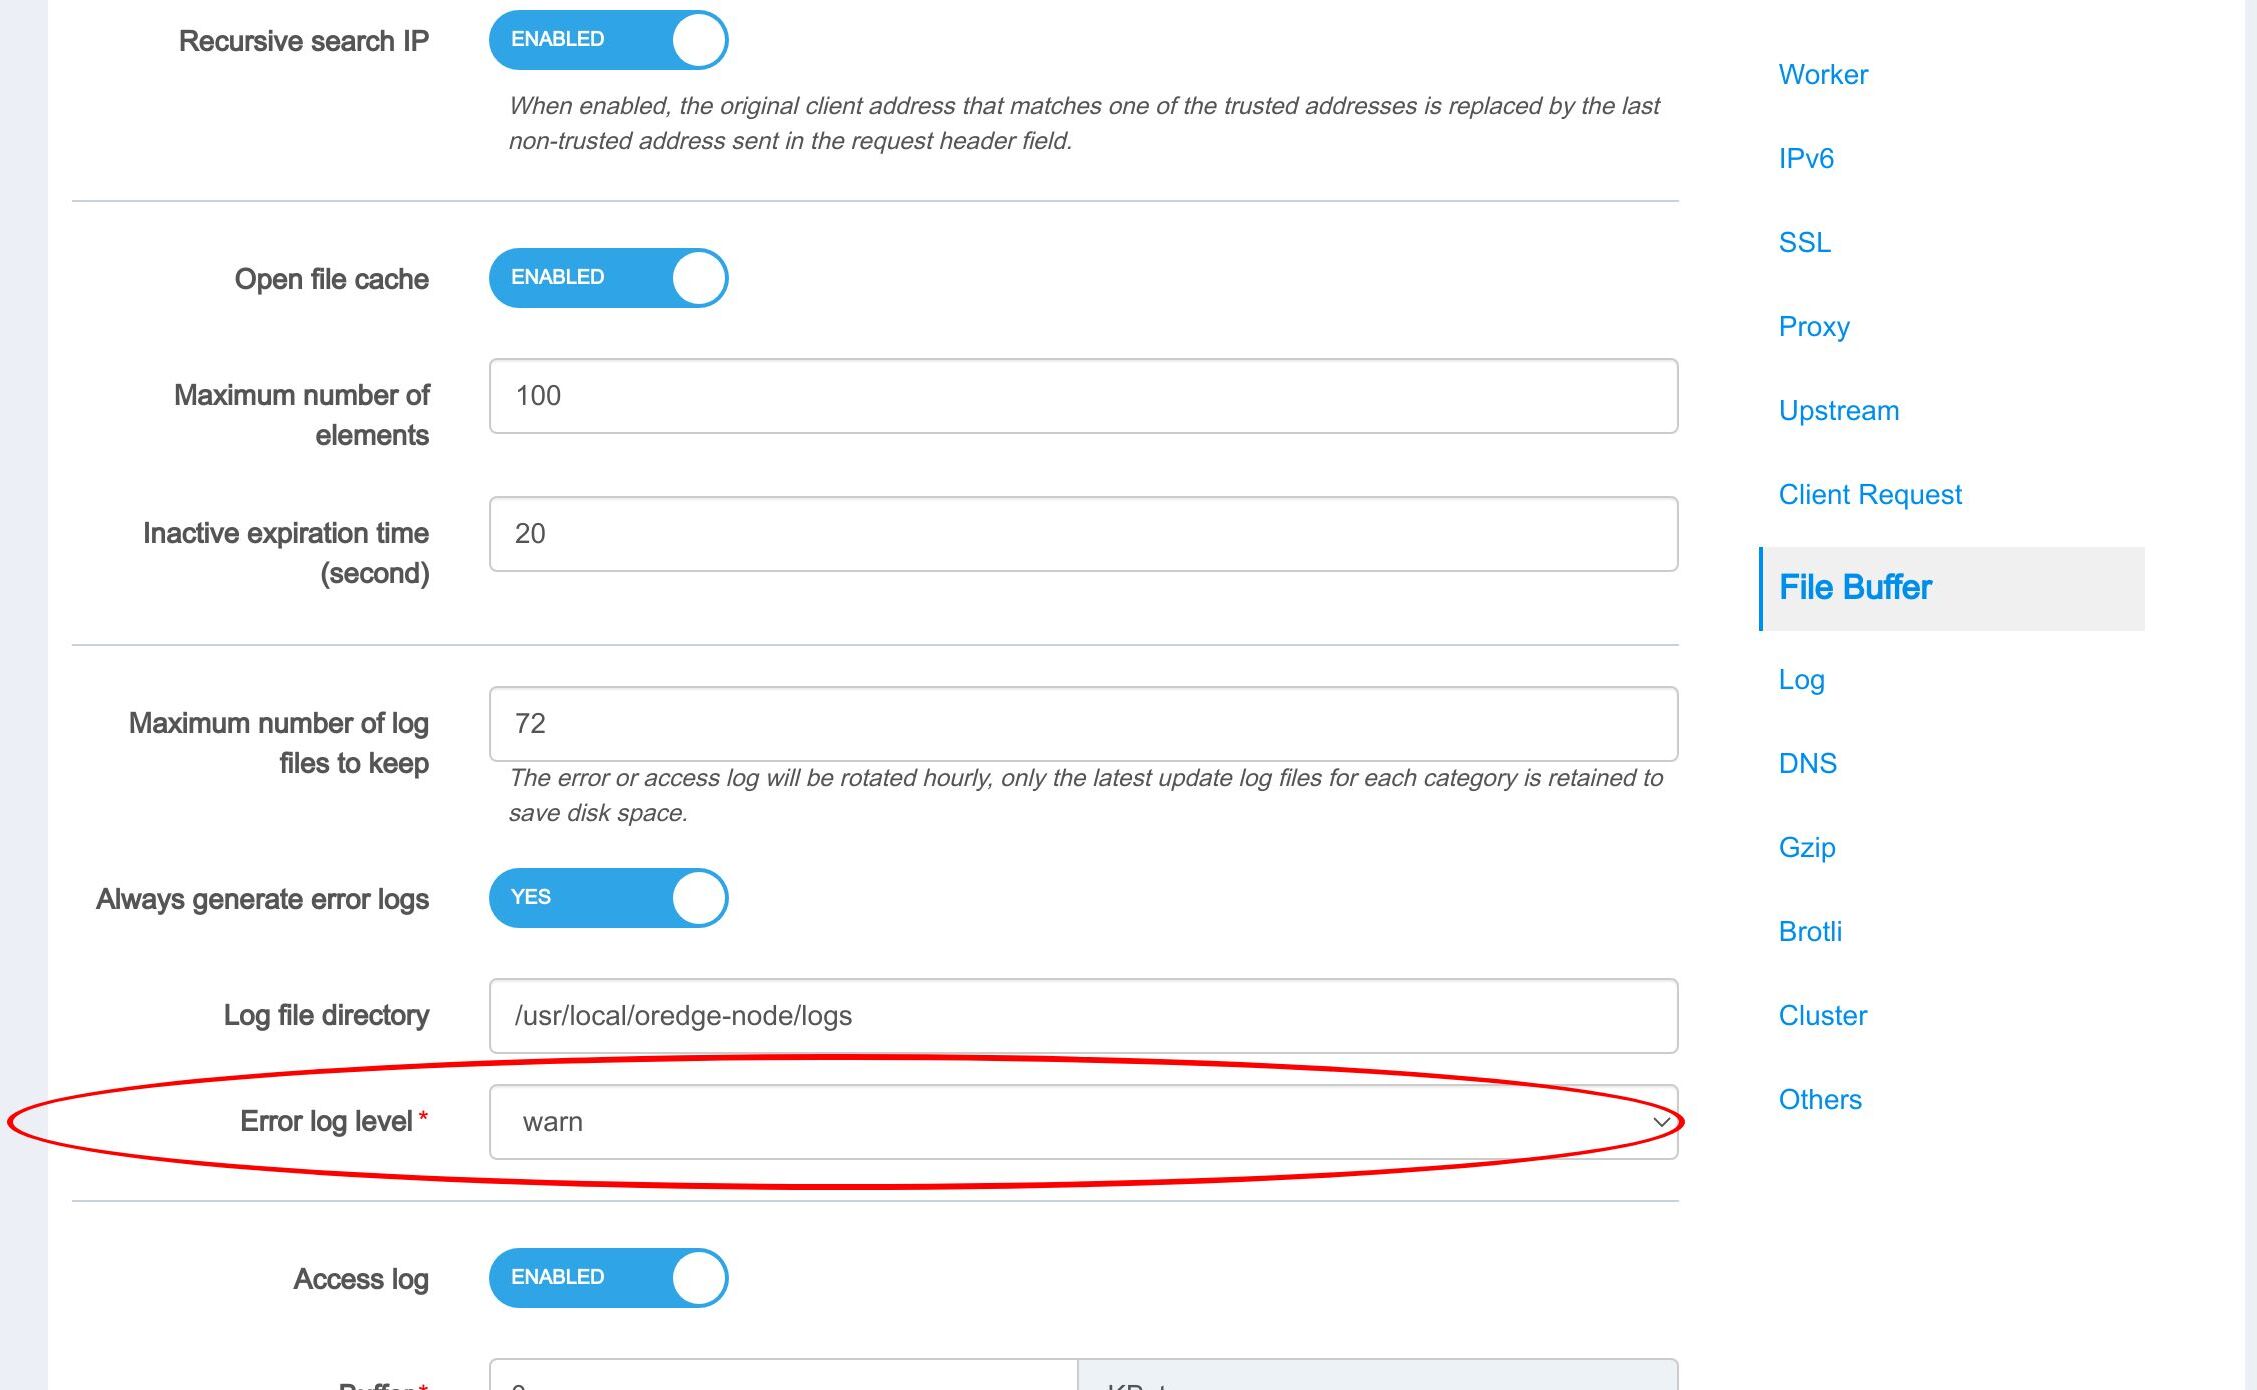
The error log level here contains “warn”, “error”, “crit”, “alert”, etc.
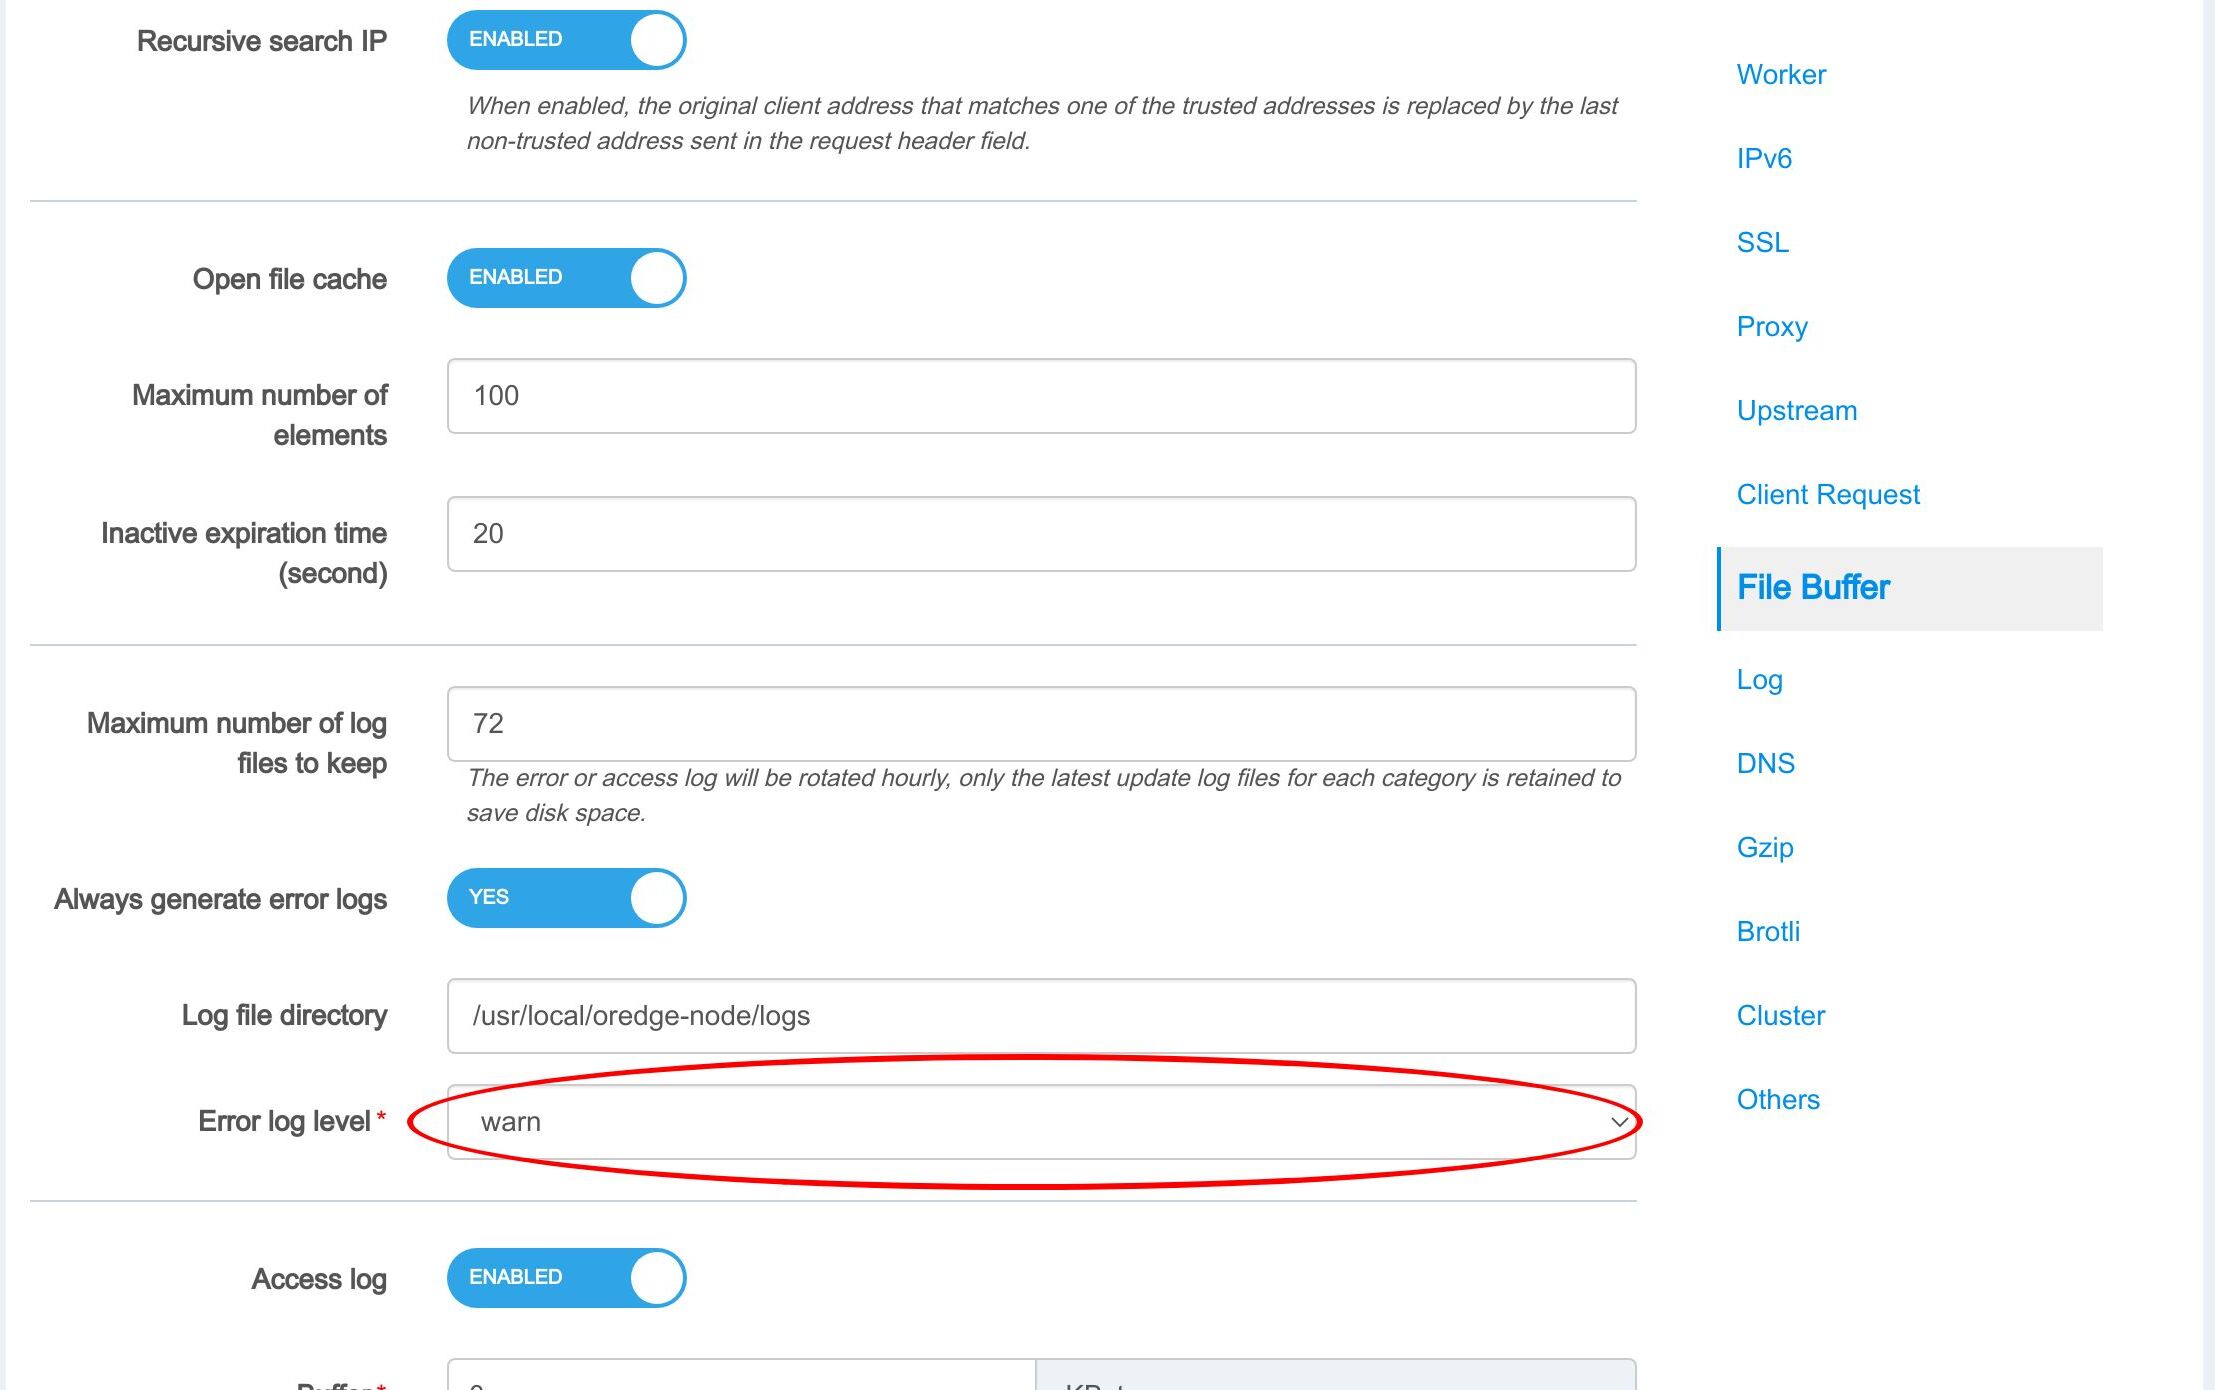
And on your local deployment, you can set the log level you want.
How to check the error.log file on gateway and Admin servers
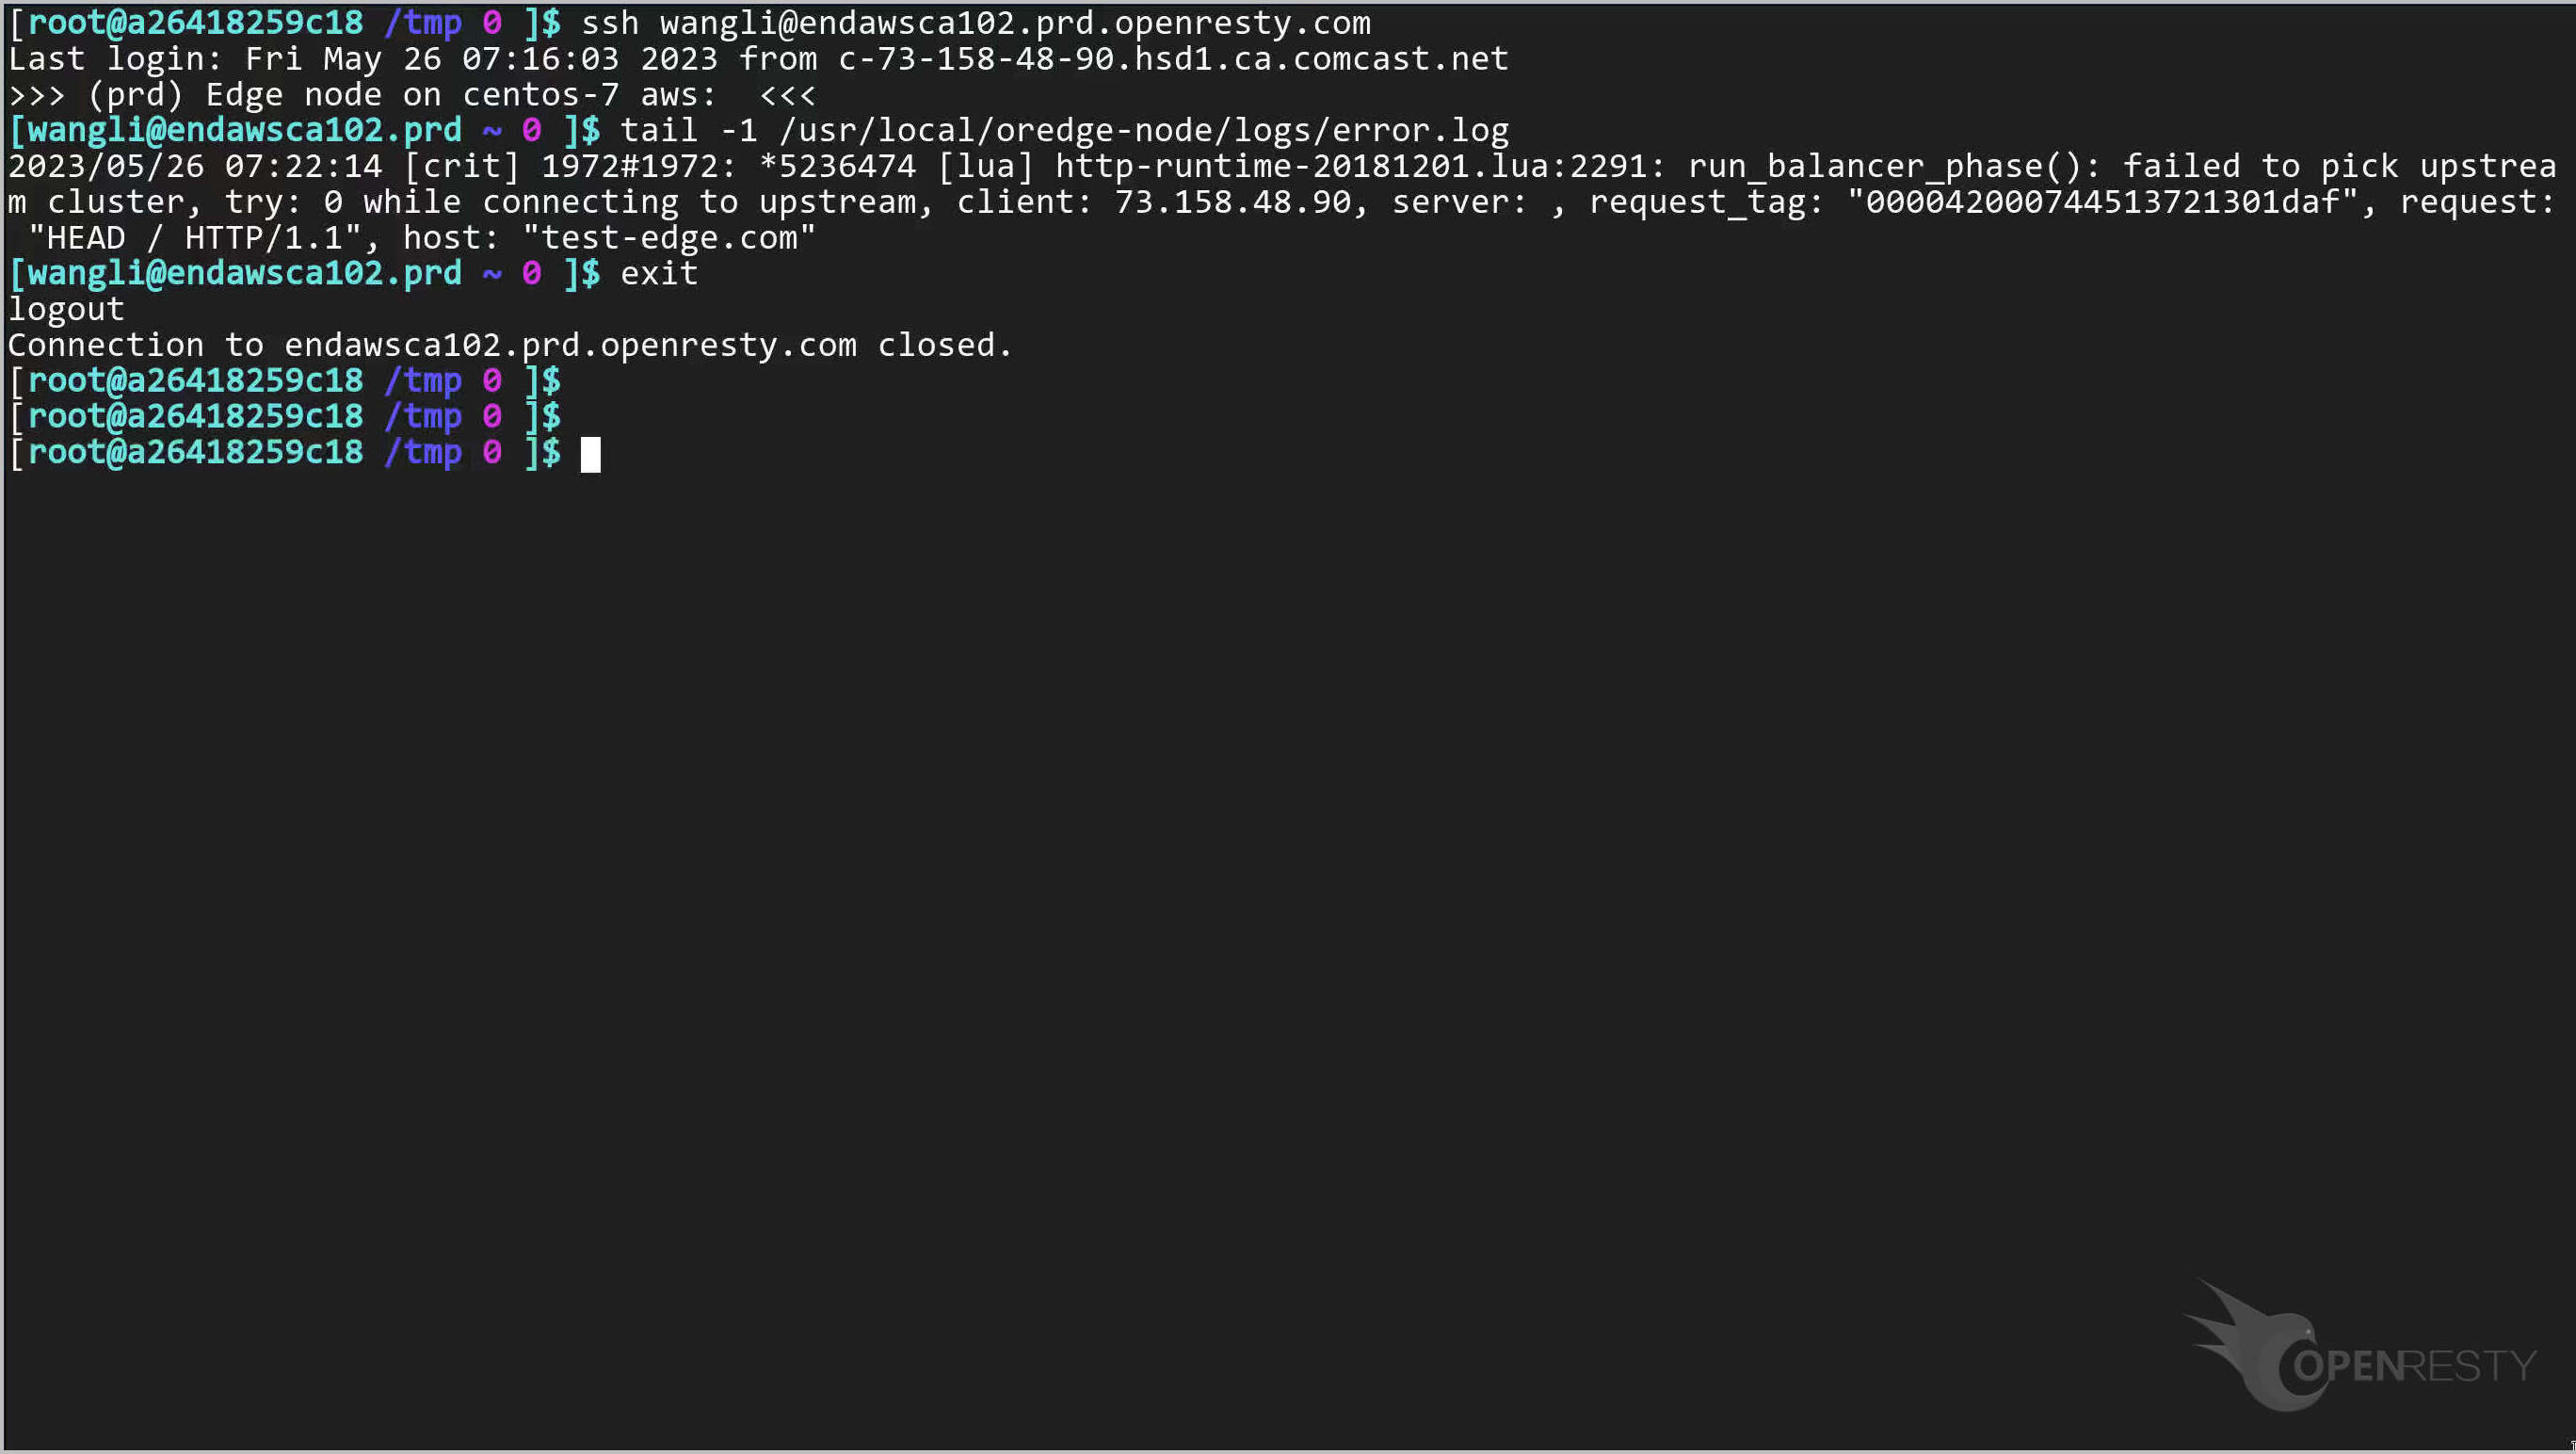
Let’s log into the OpenResty Edge gateway server and take a look at our error.log file.
Check the last error log message.
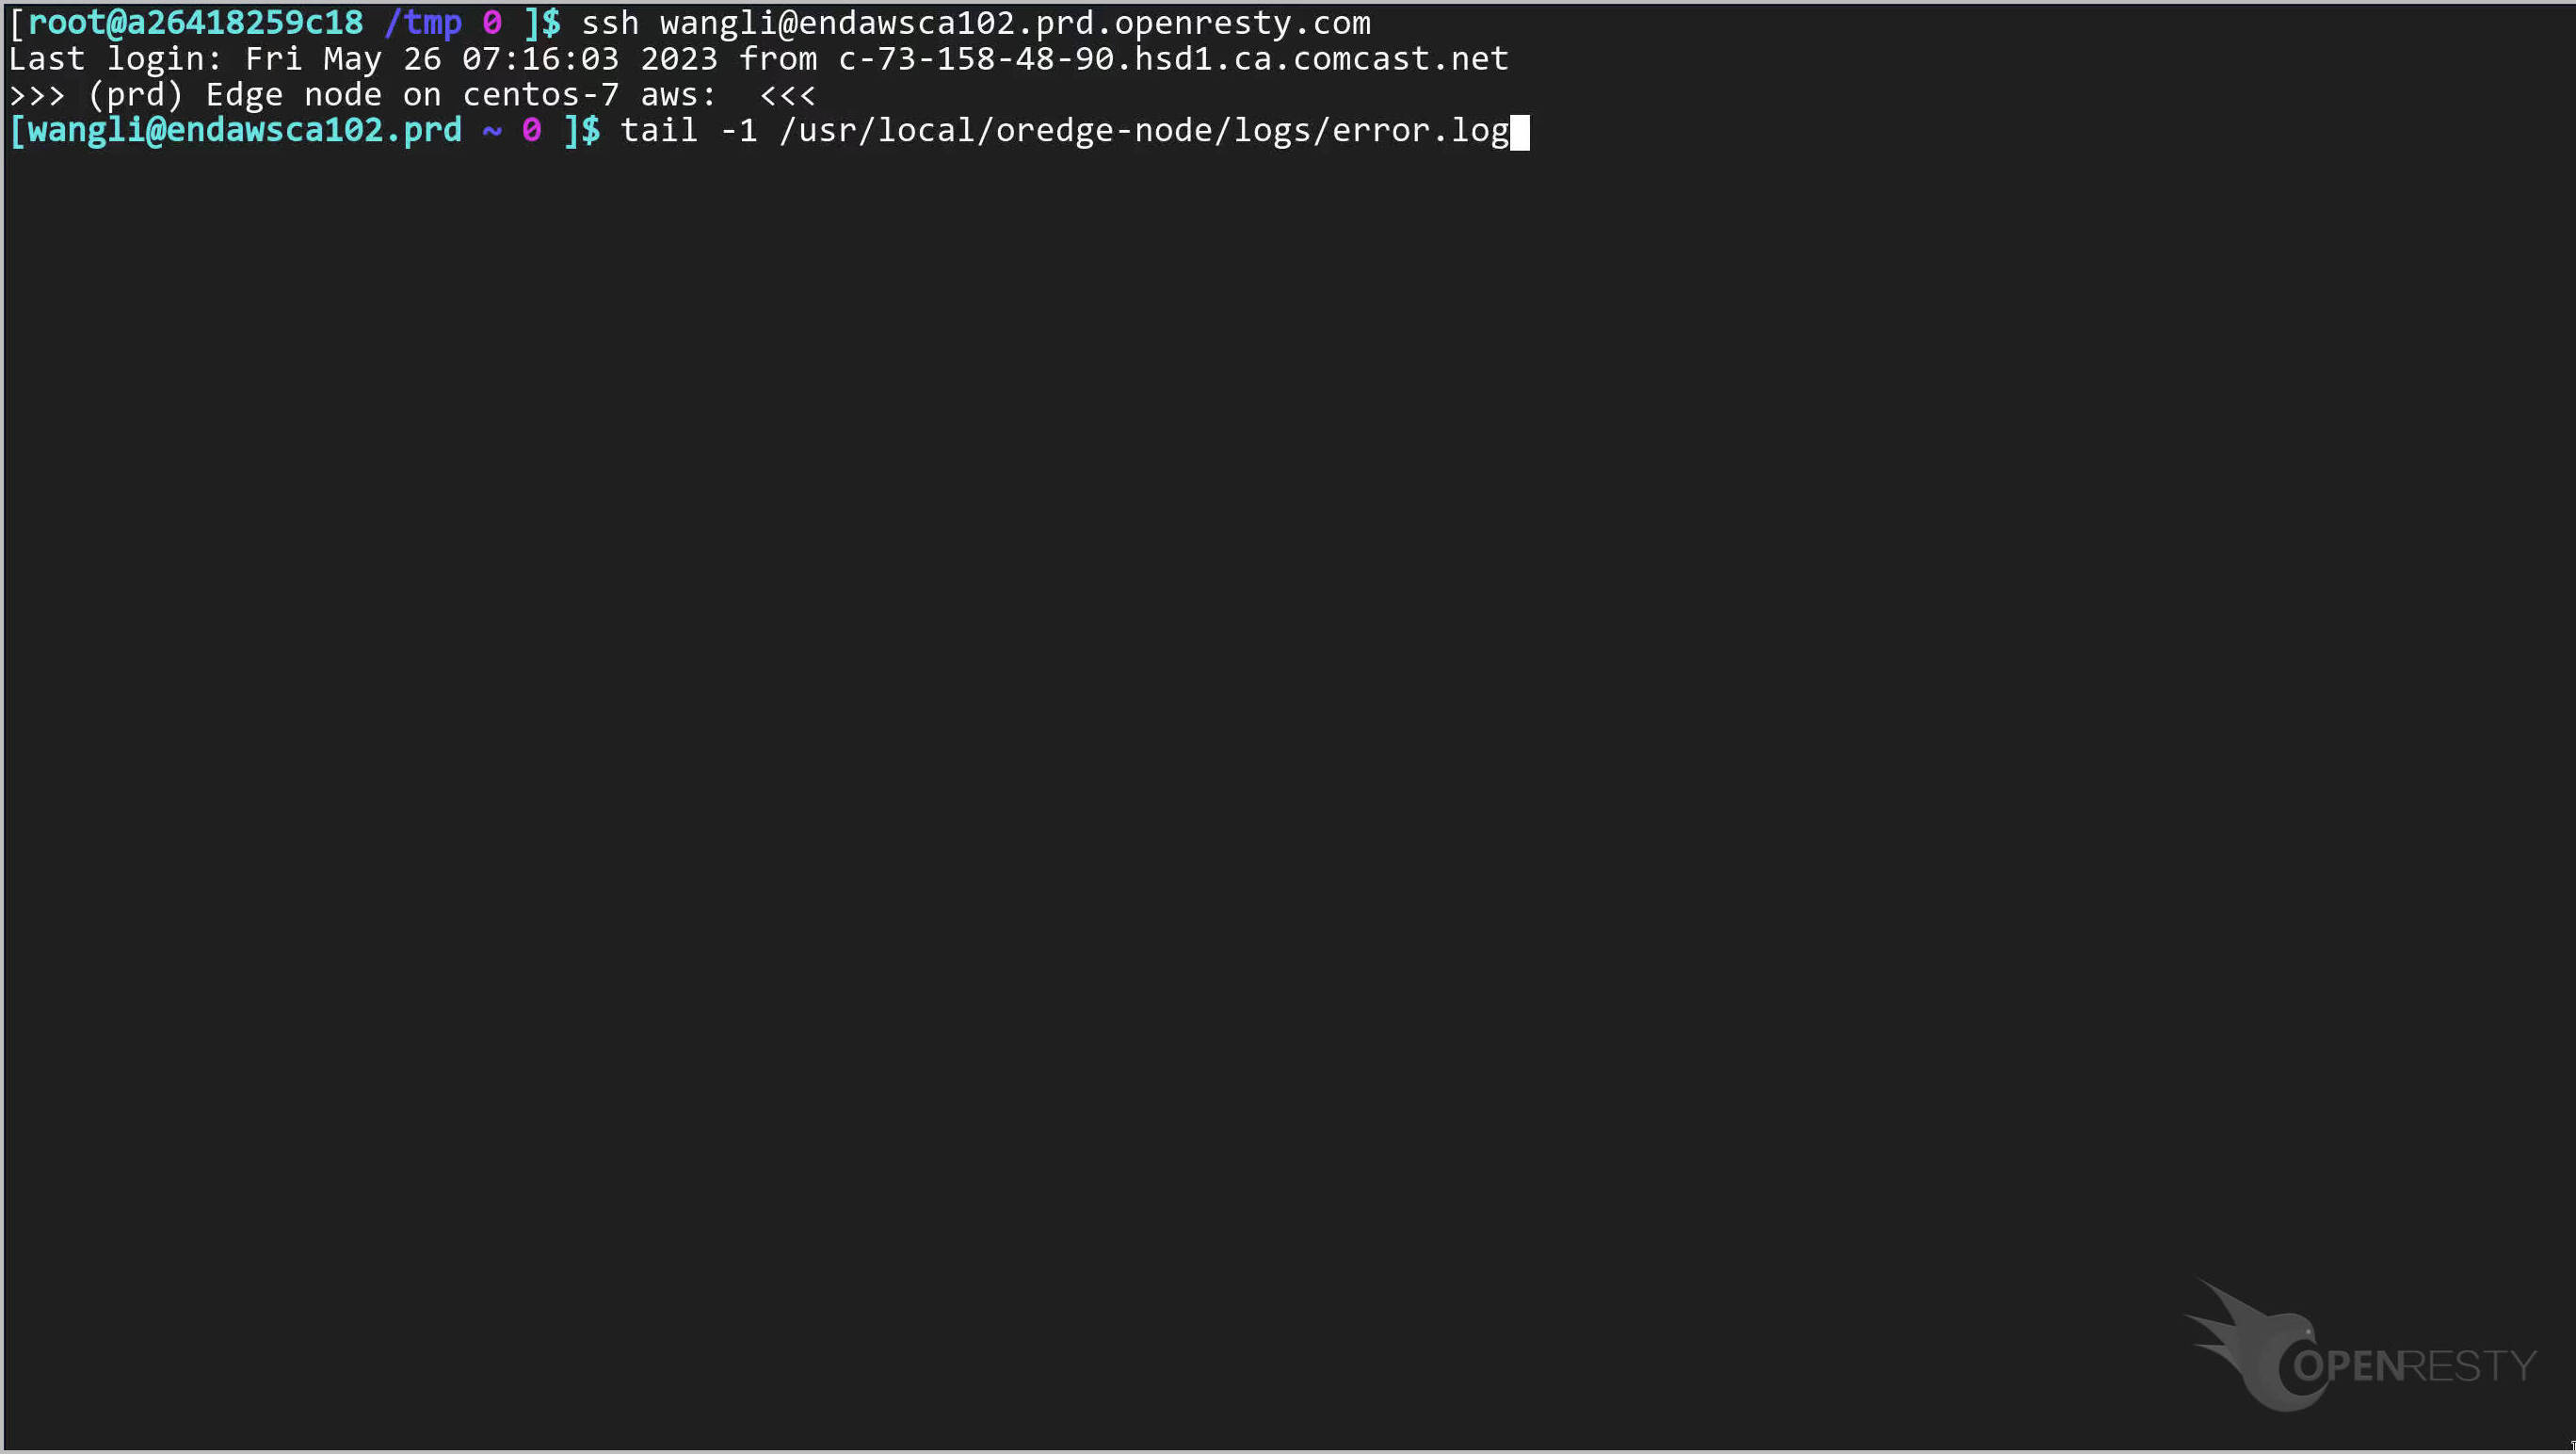
The error log messages of our gateway servers are written here.
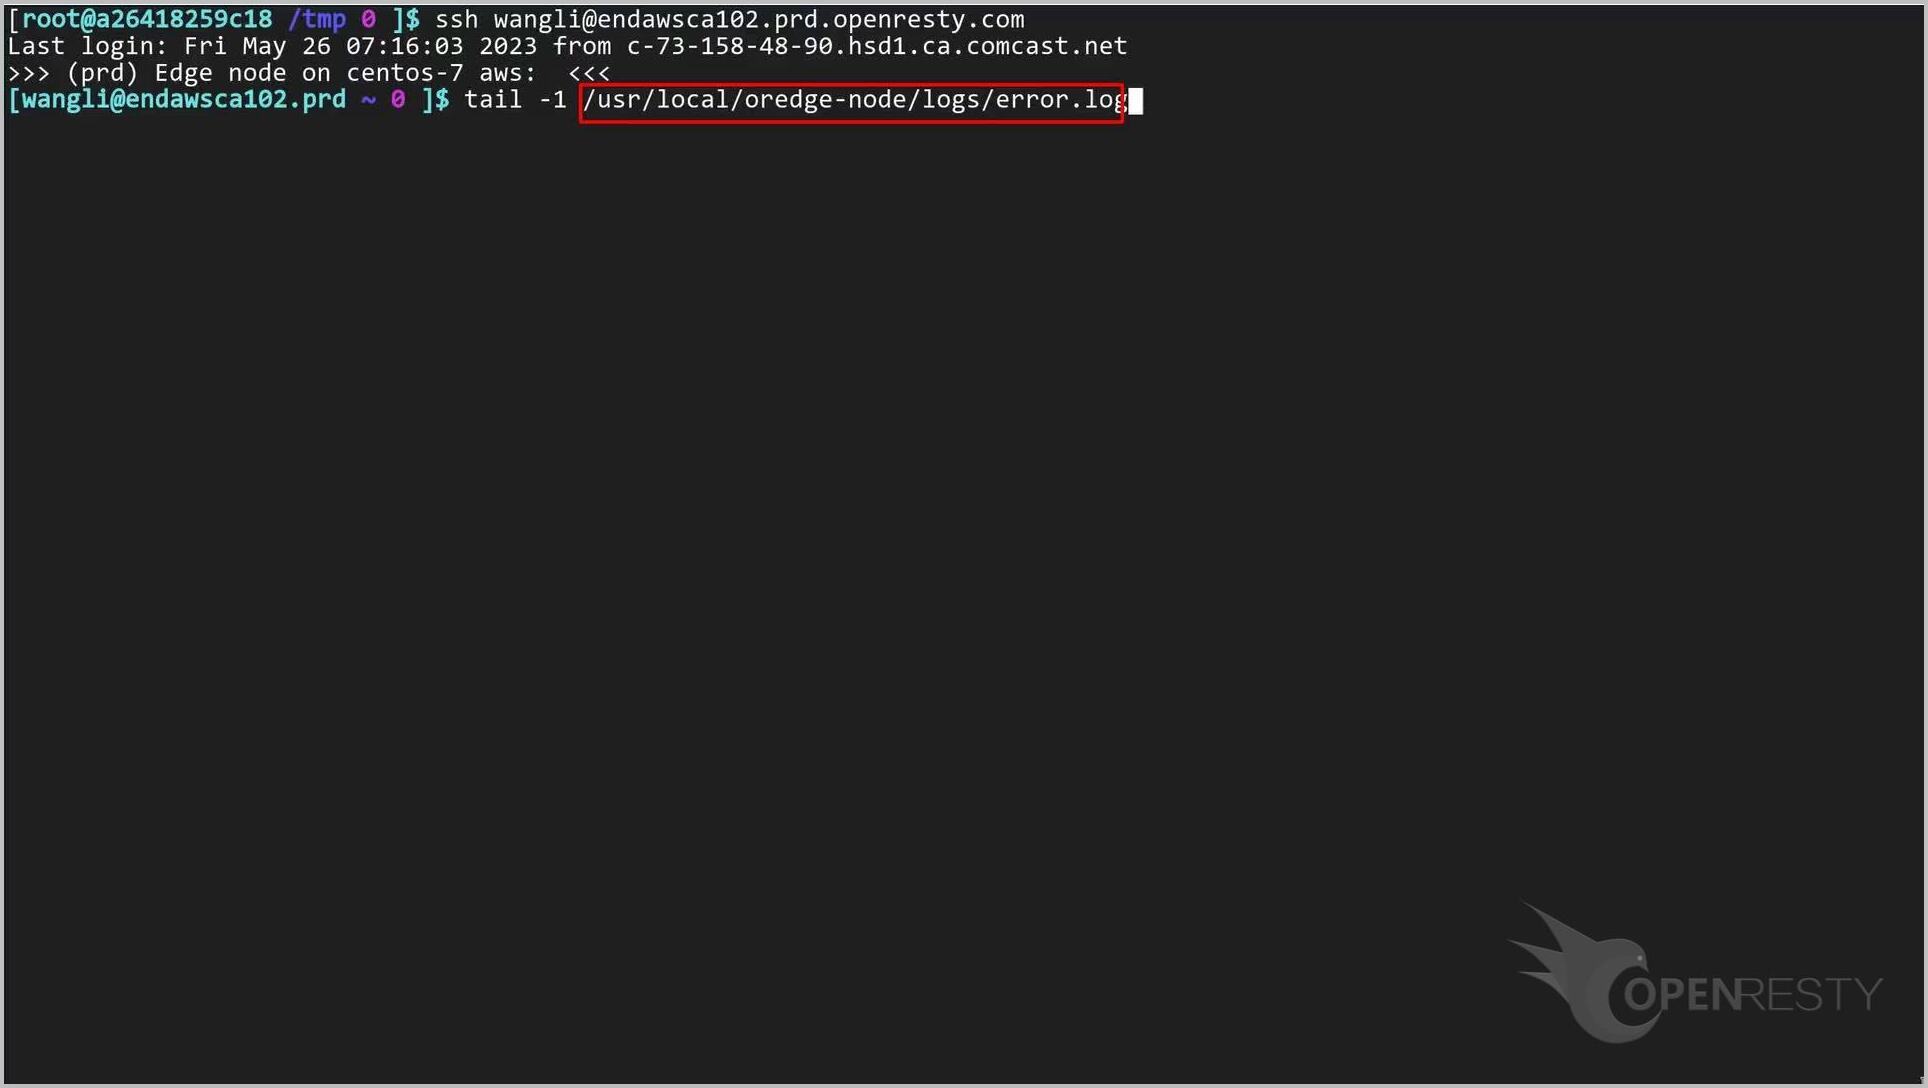
Run the command.
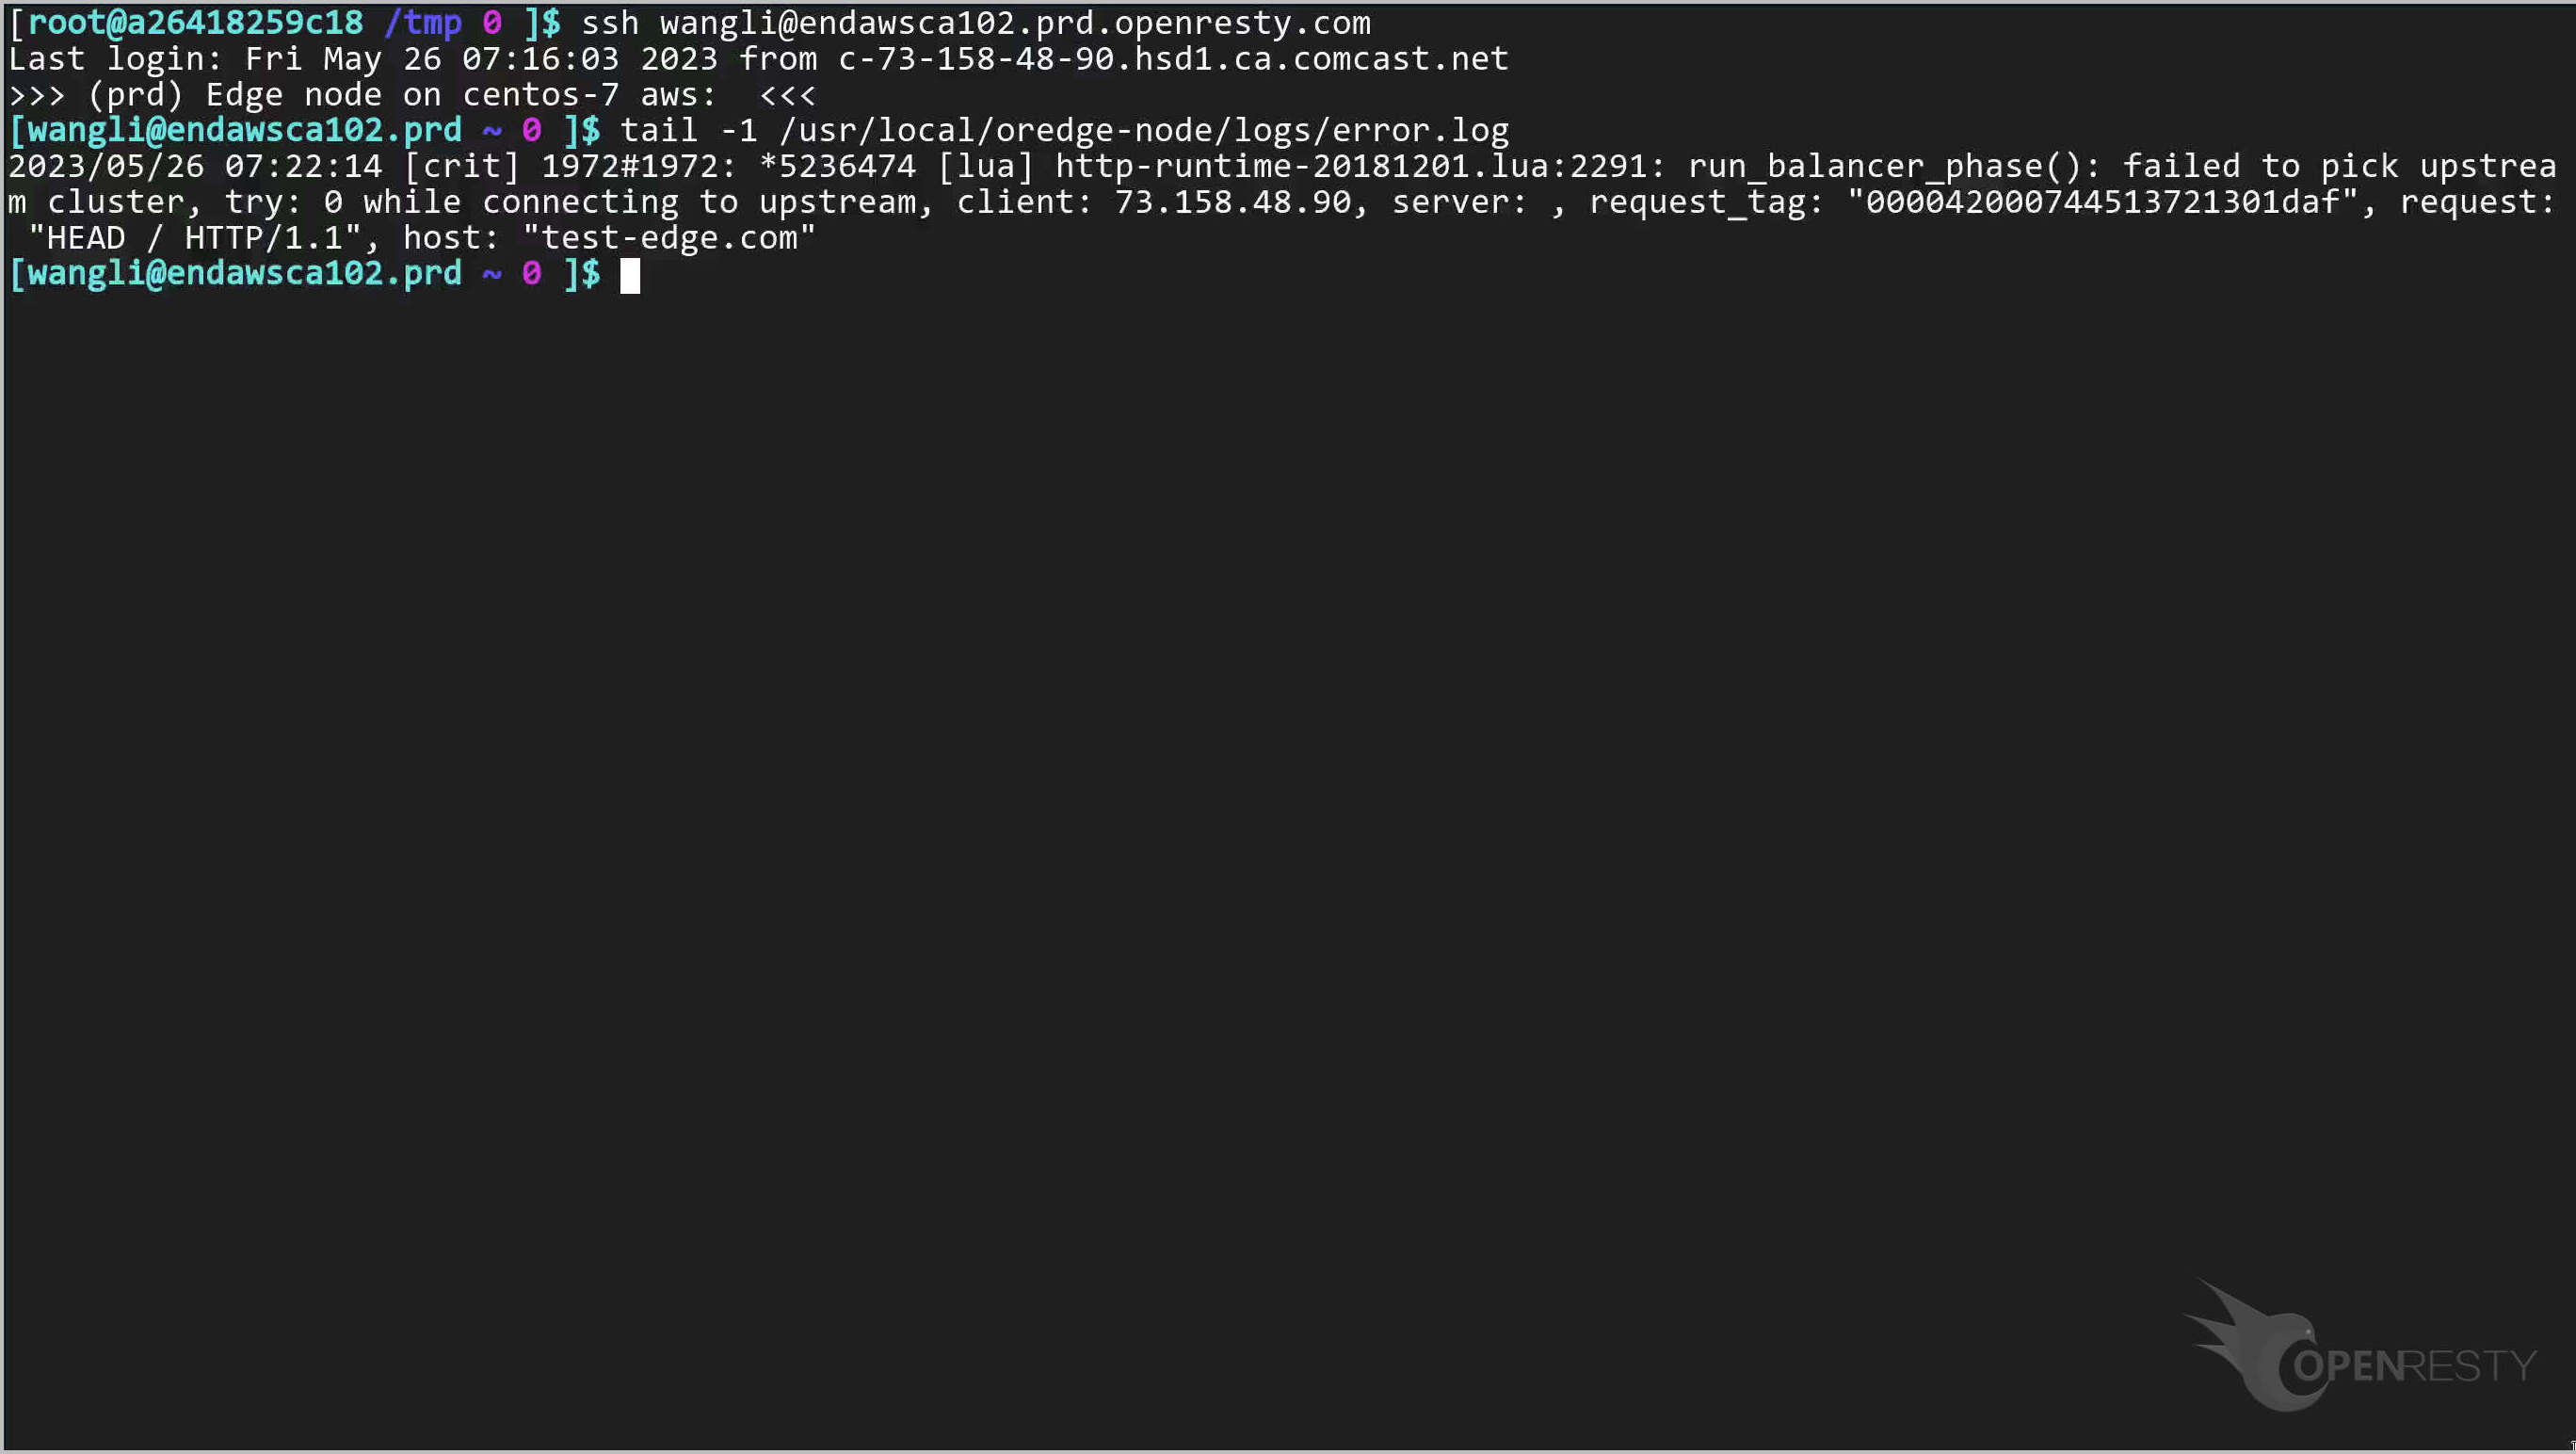
We can see the gateway server error log message.
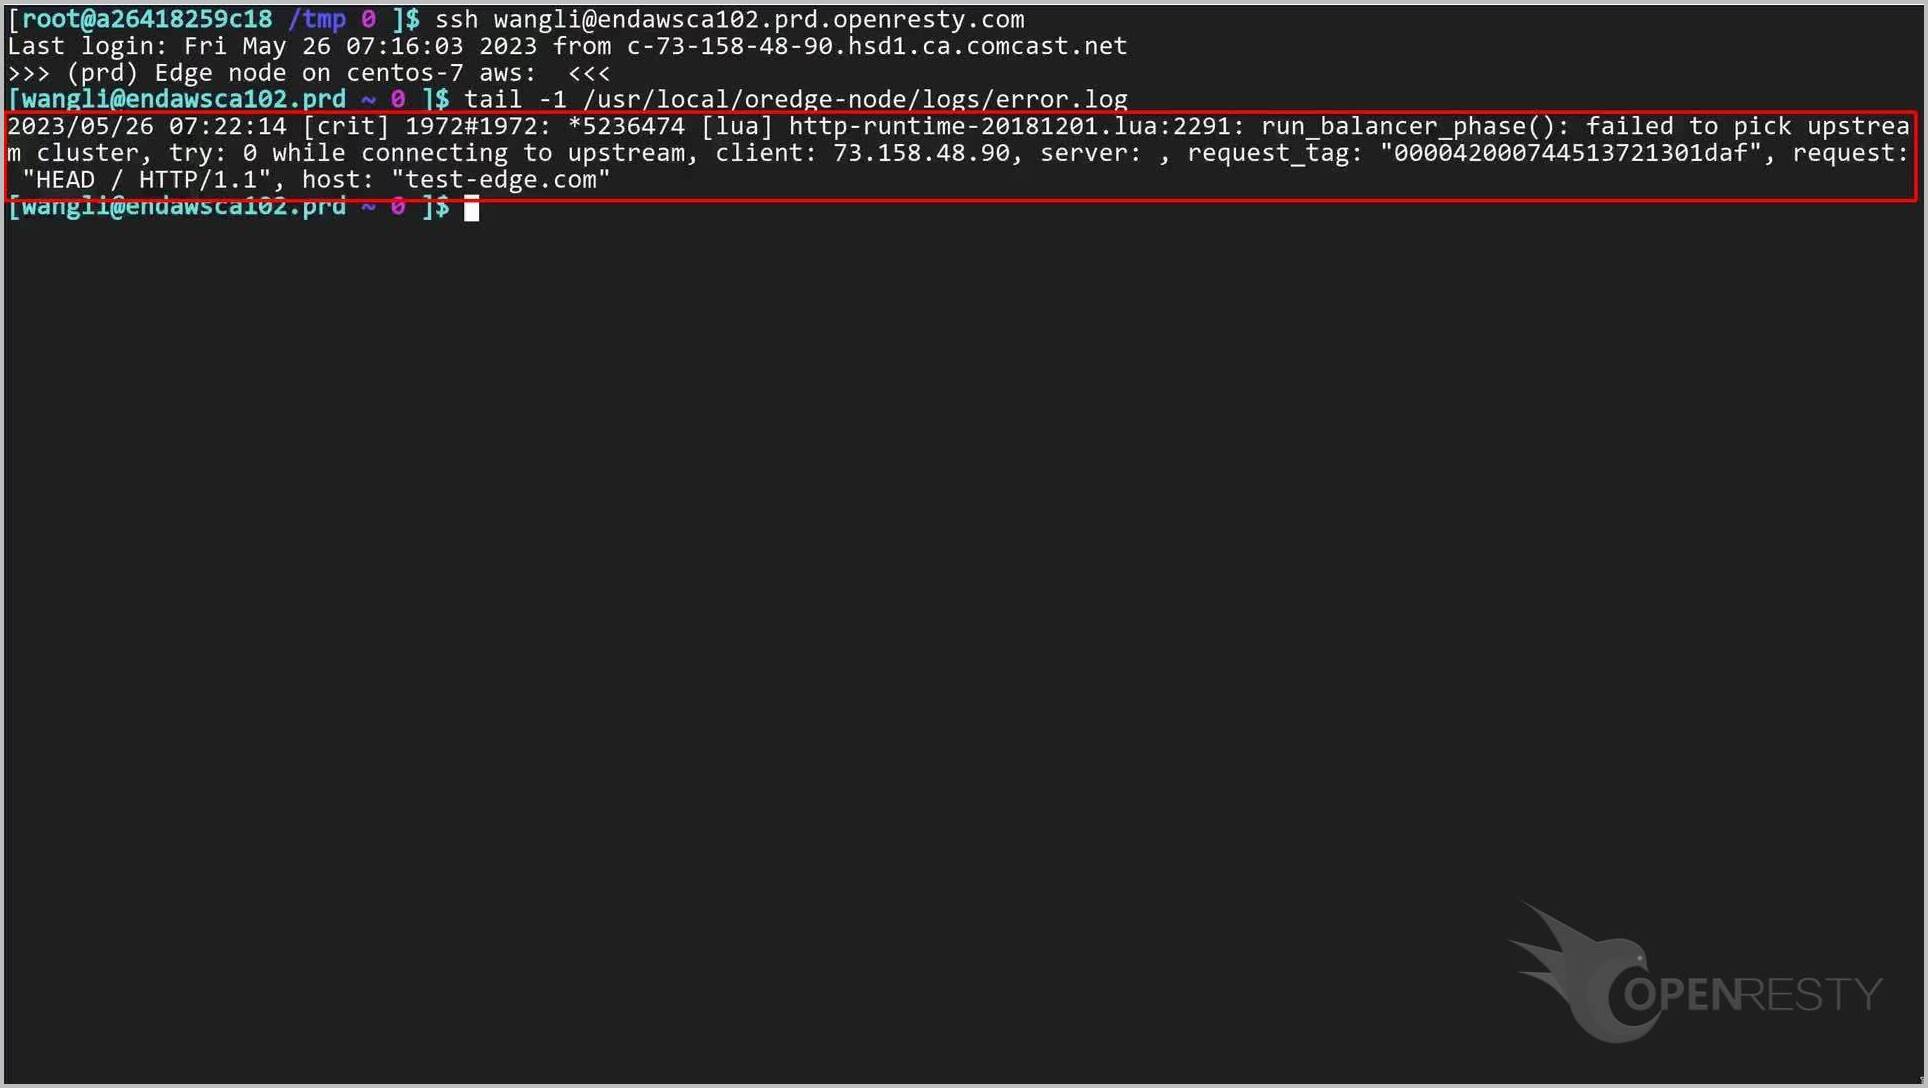
Quit the server.
Then, we log into the OpenResty Edge Admin server and check the error.log file.
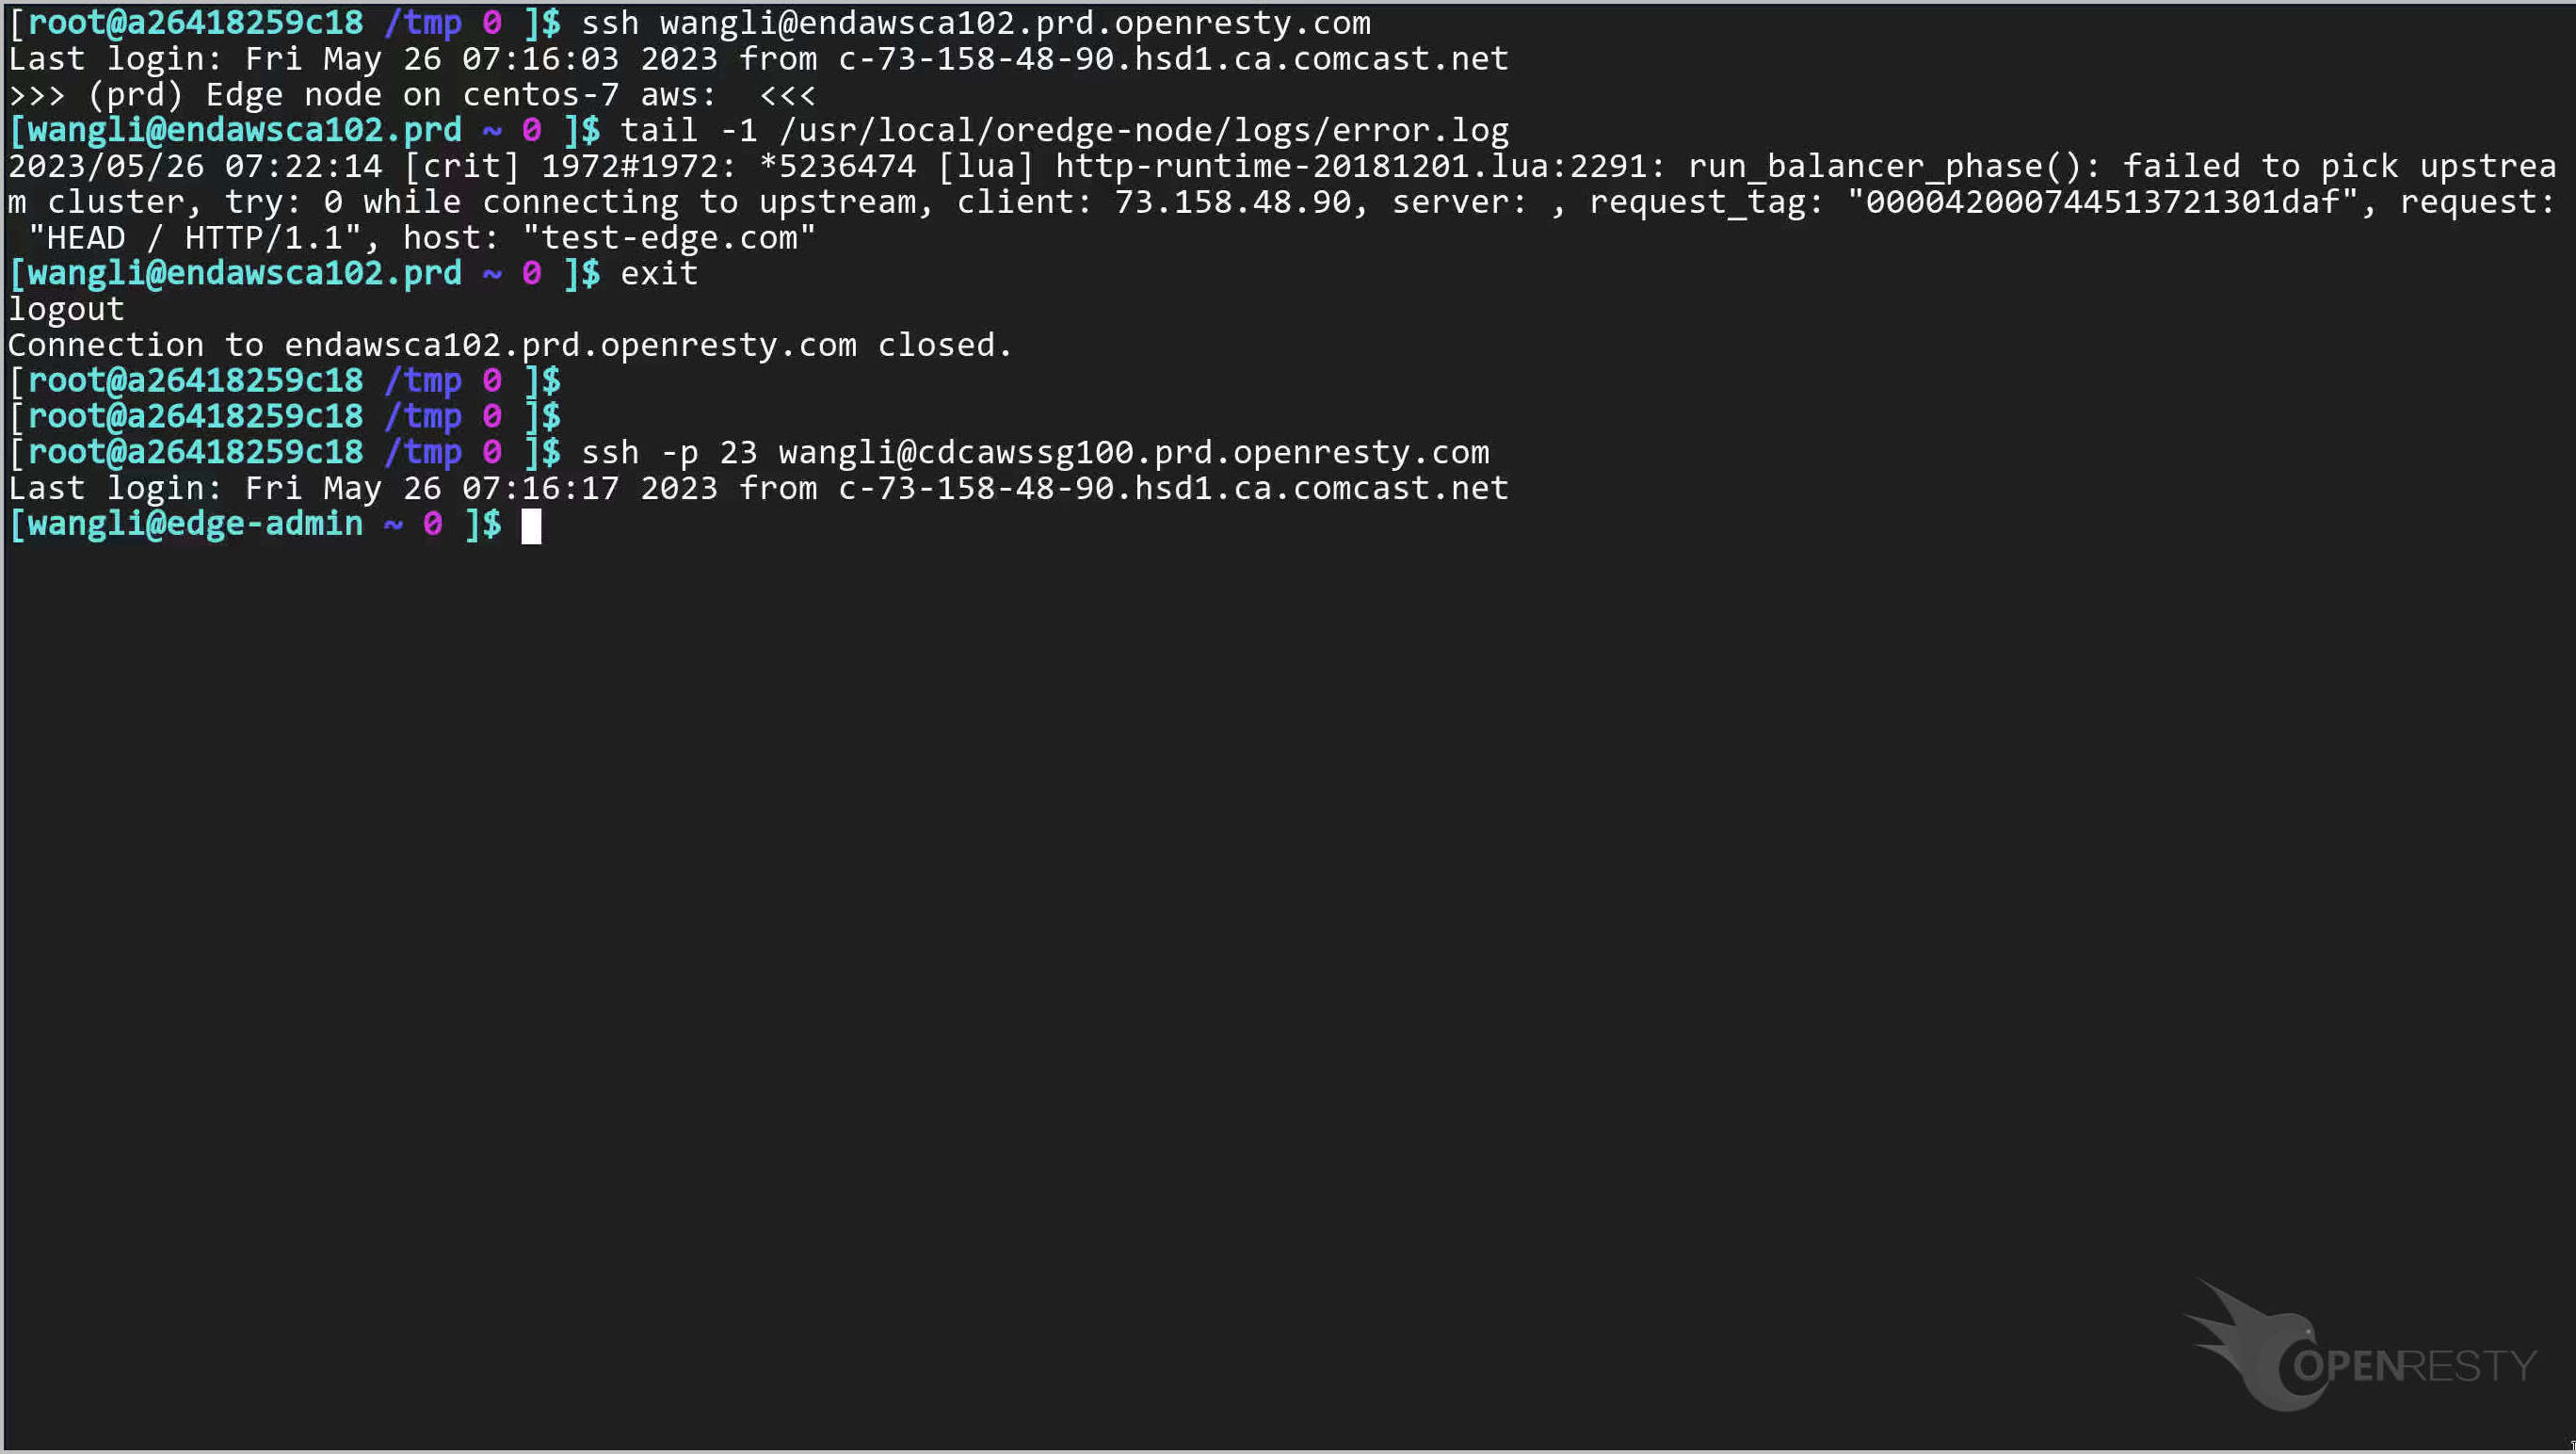
Let’s look at the last error log messages again.
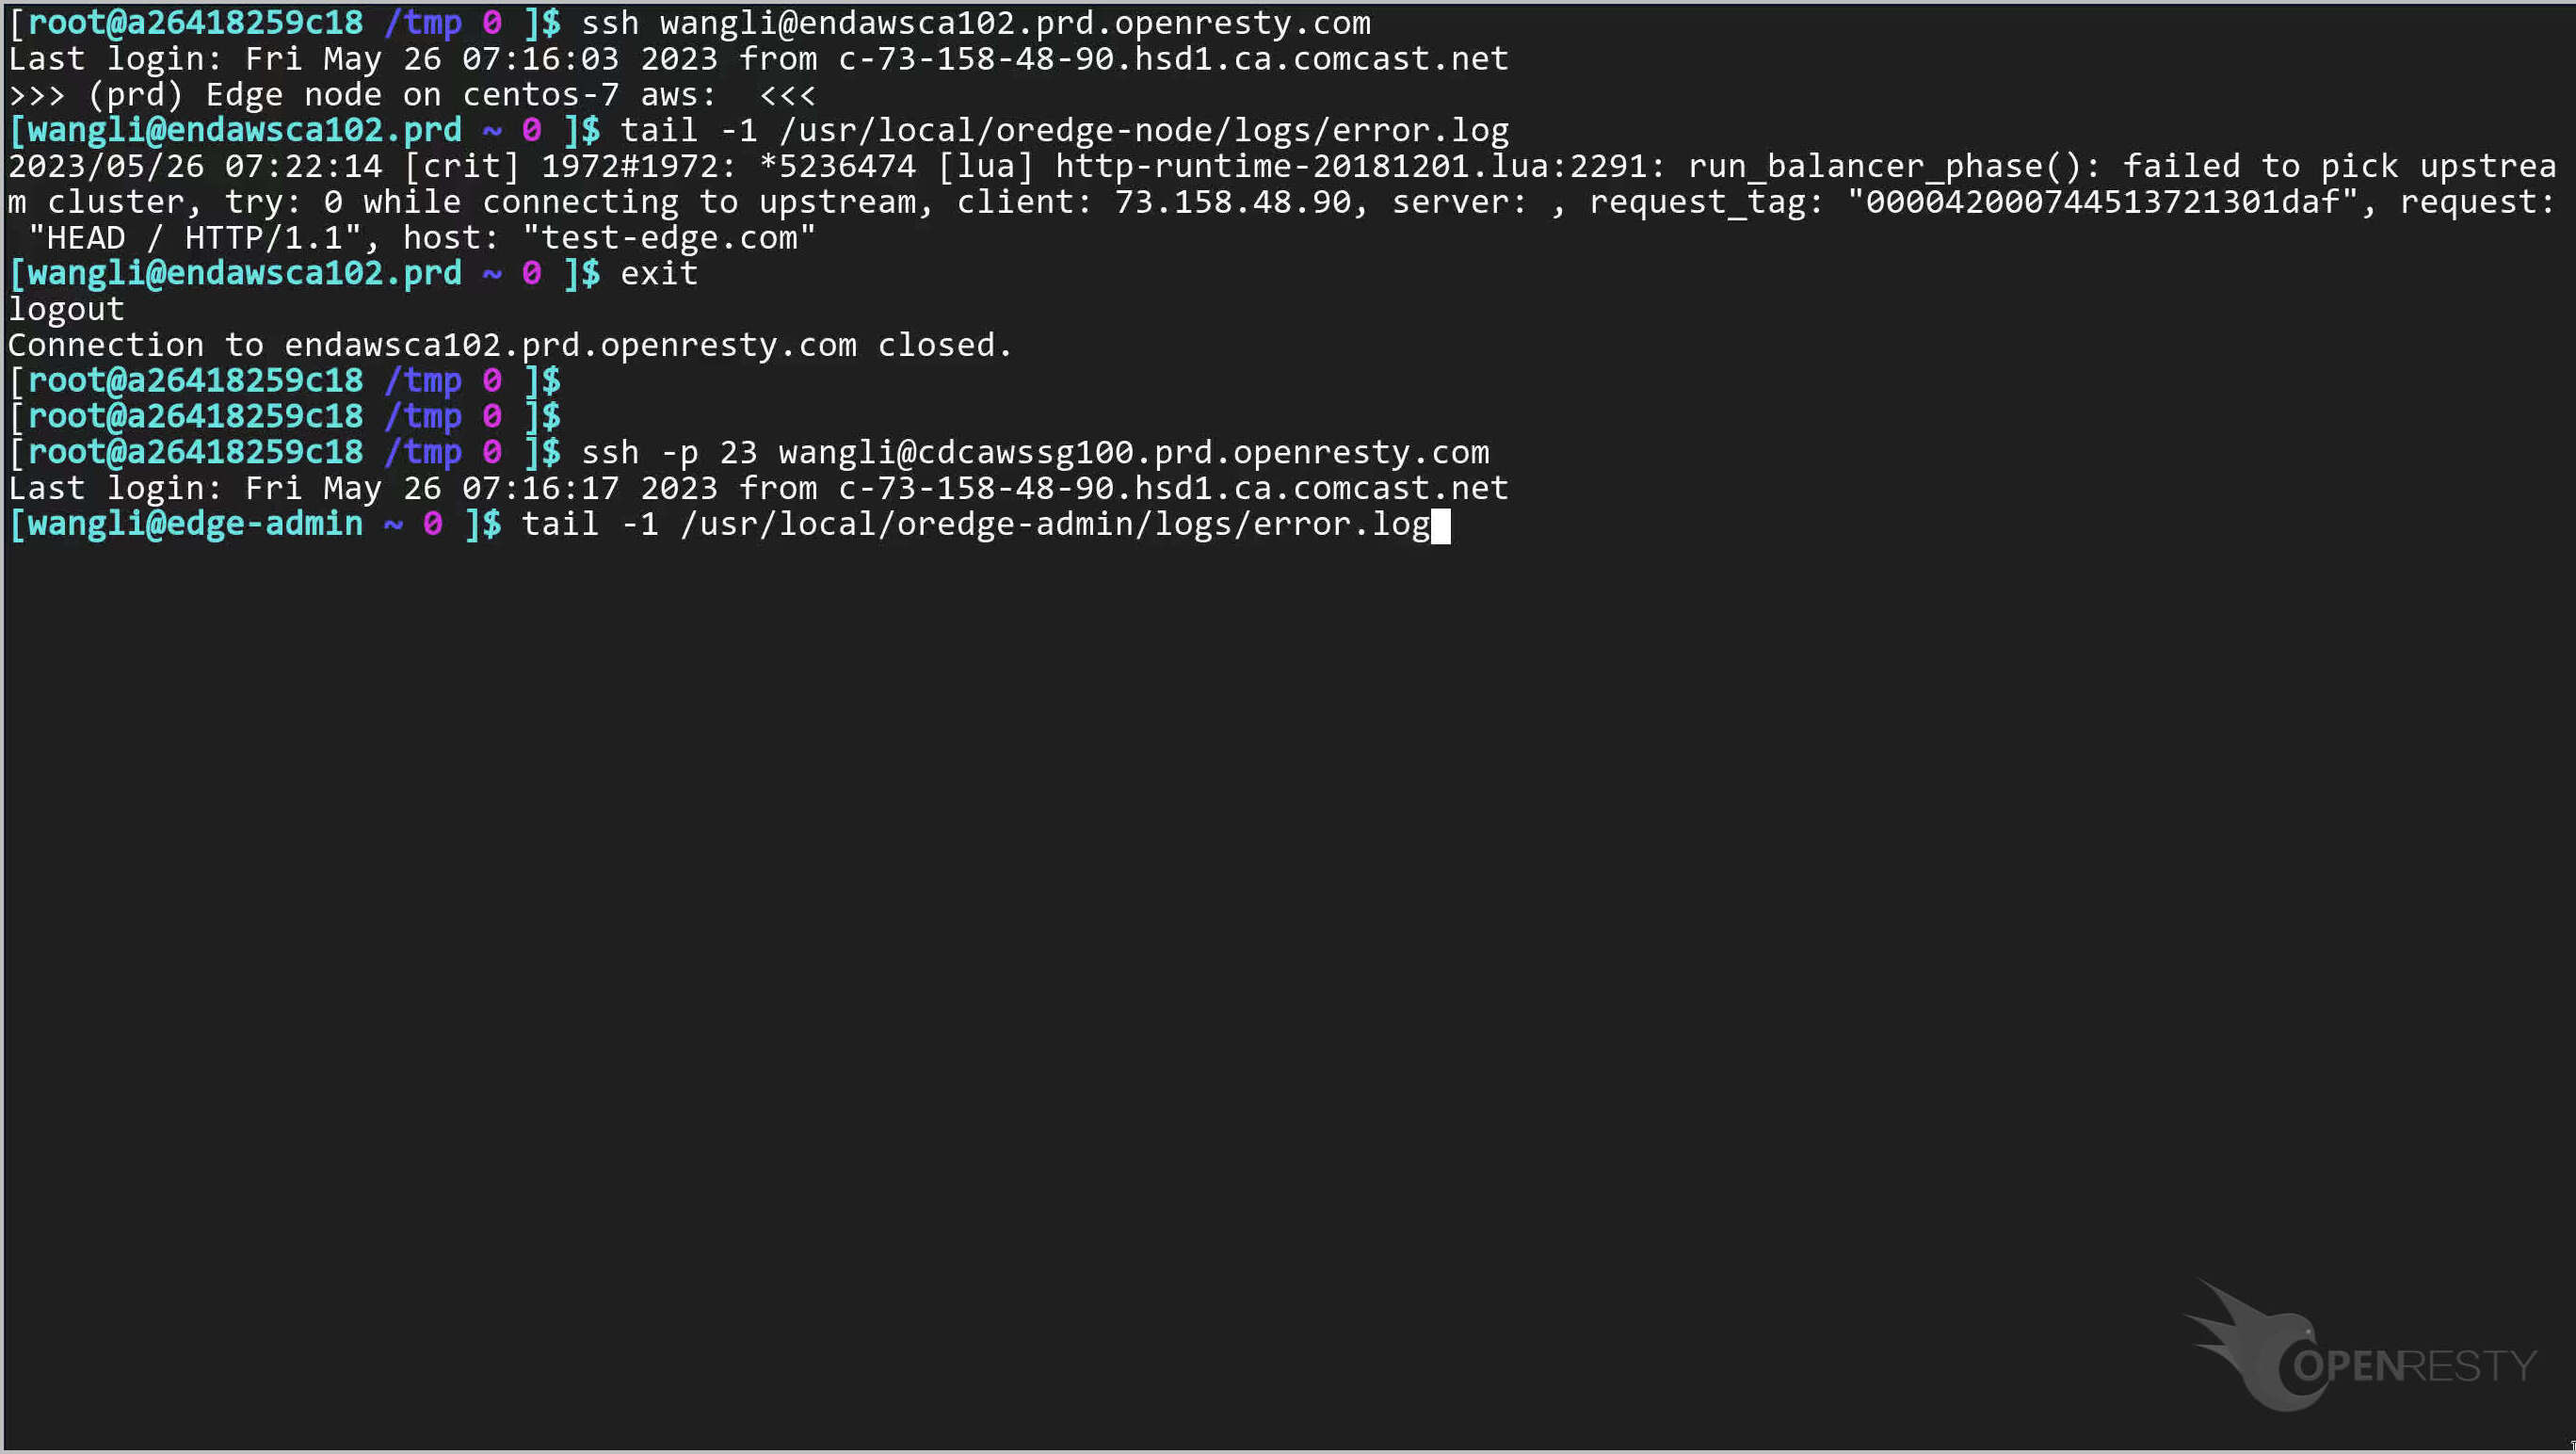
The error log messages of the OpenResty Edge Admin are written here.
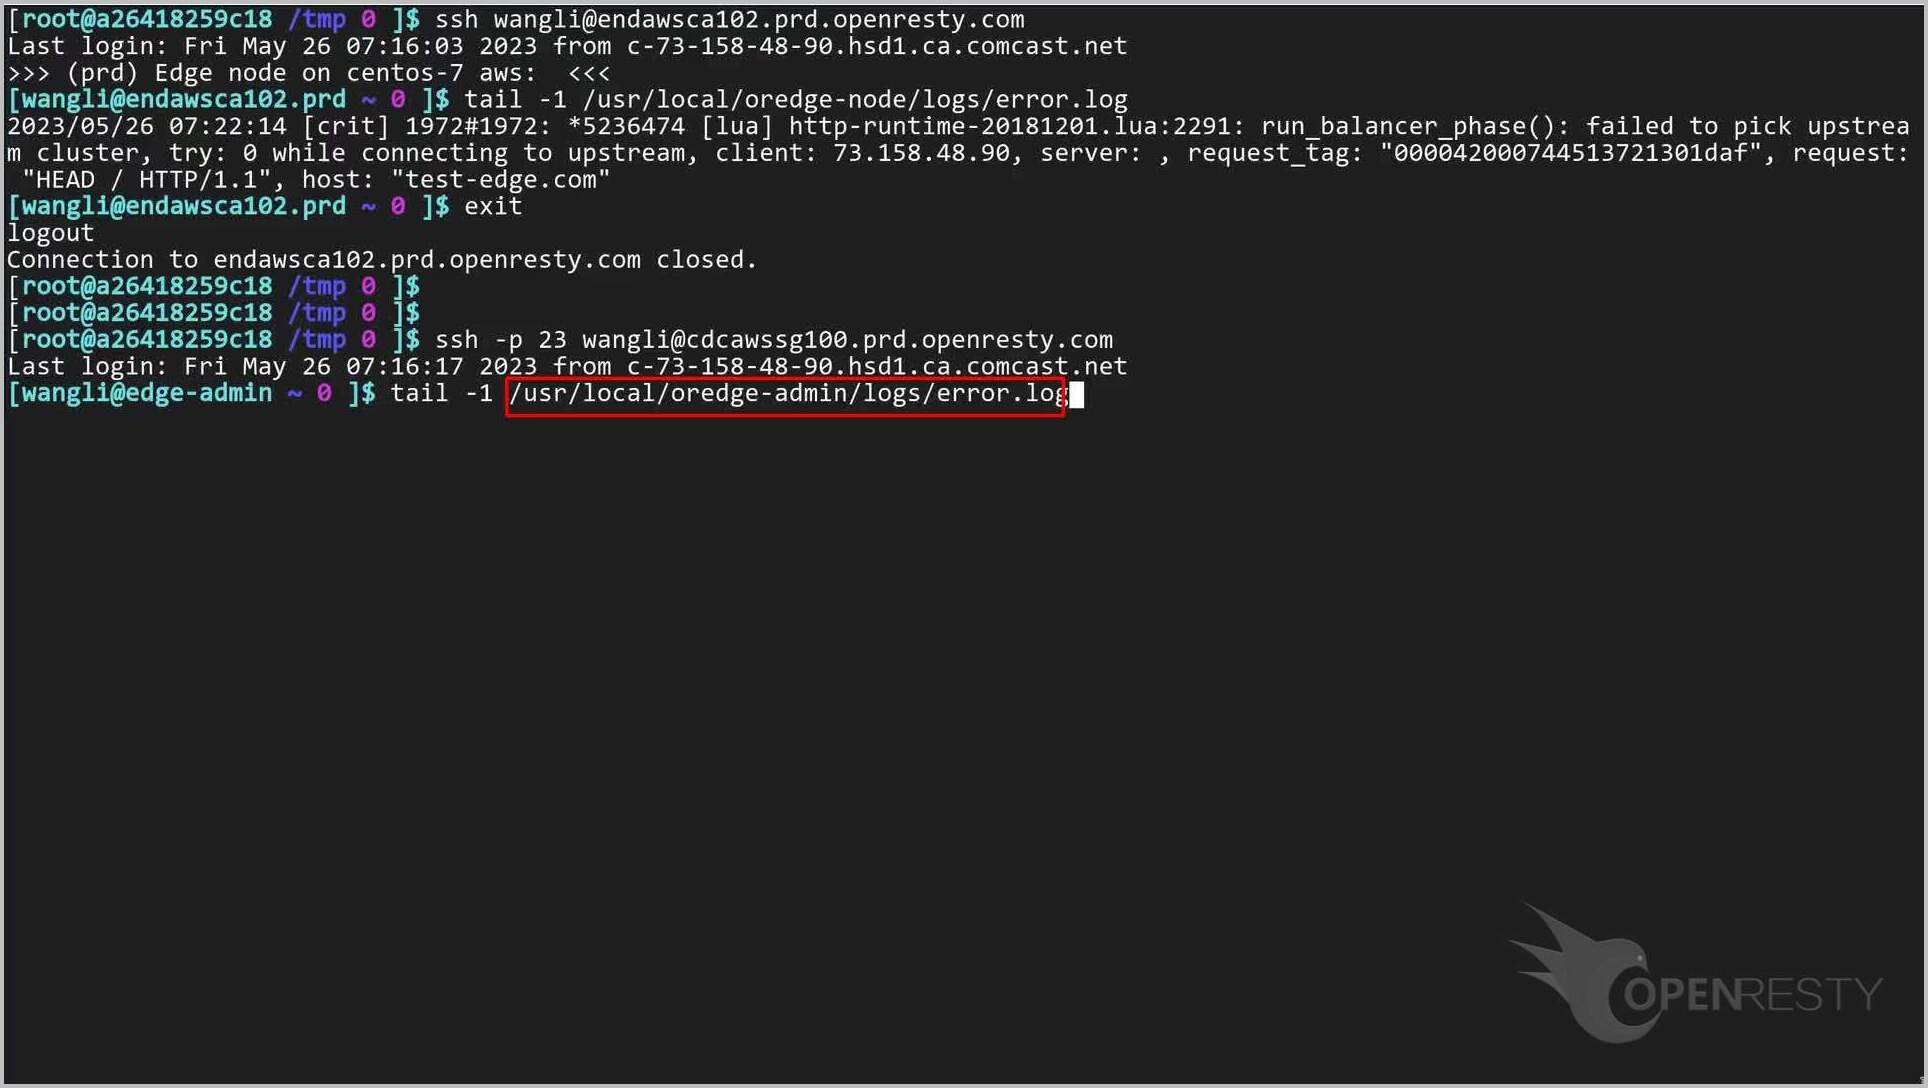
Run the command.
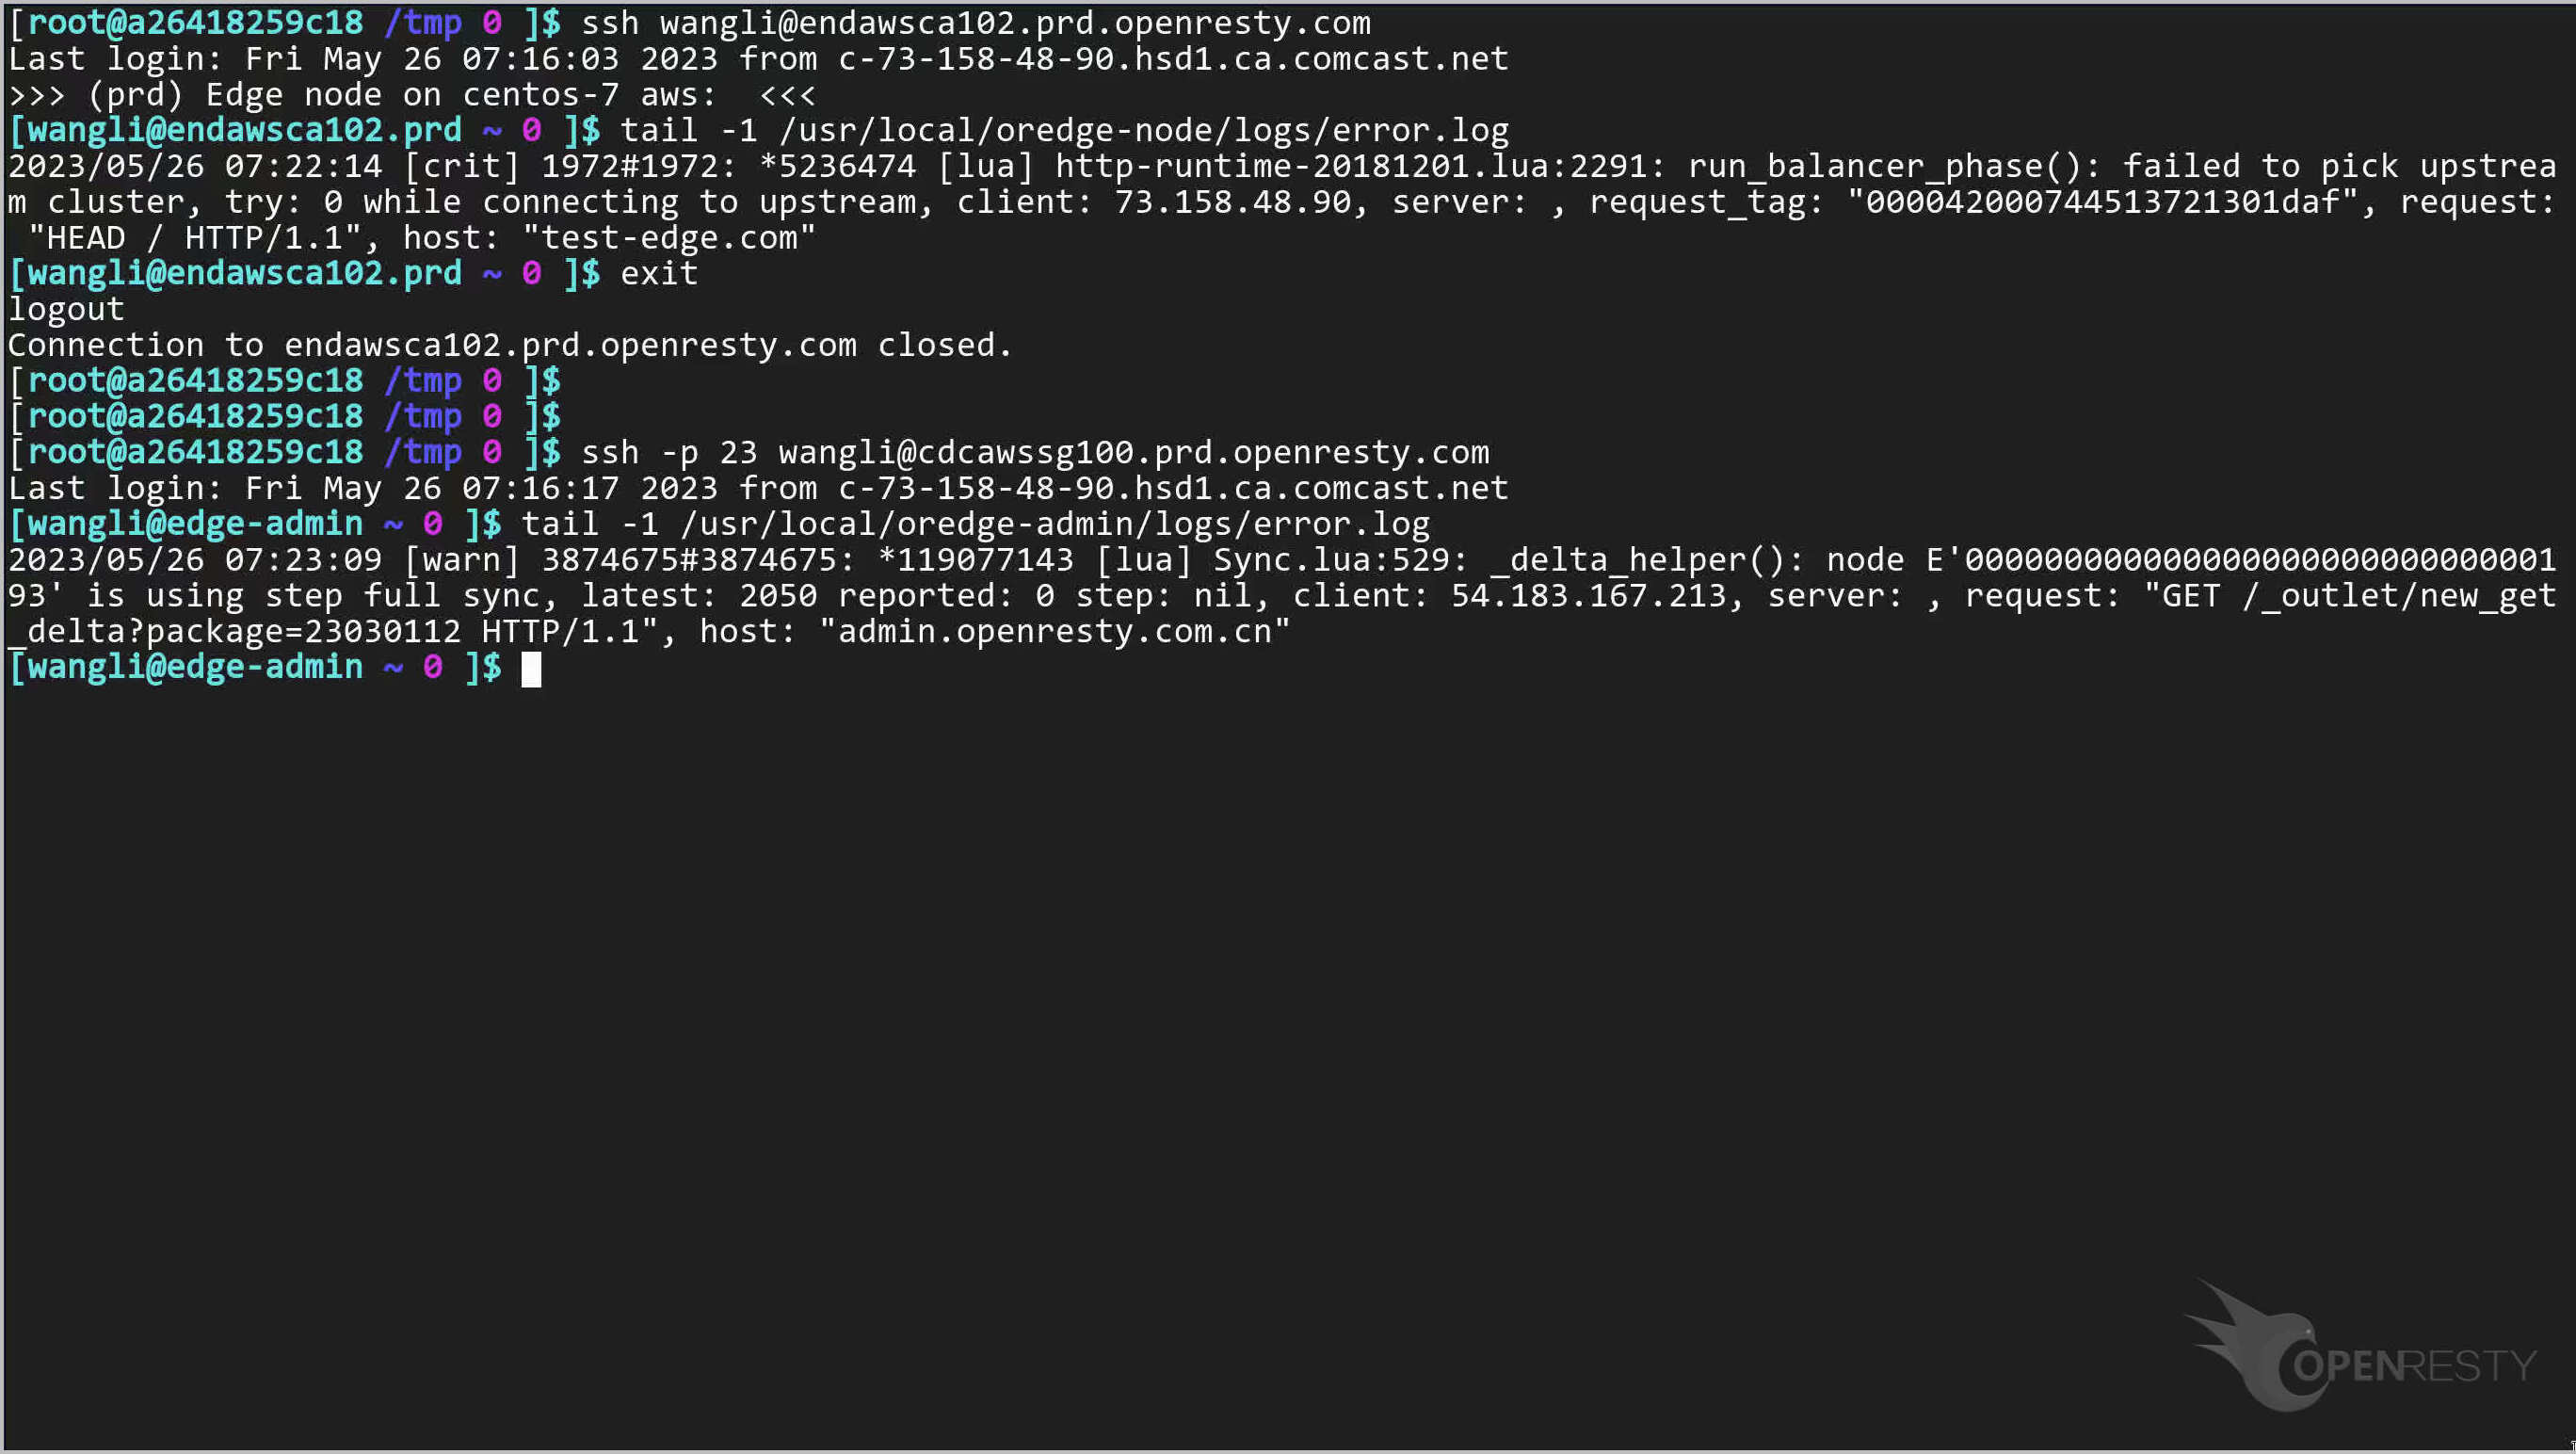
We can see the OpenResty Edge Admin error log message.
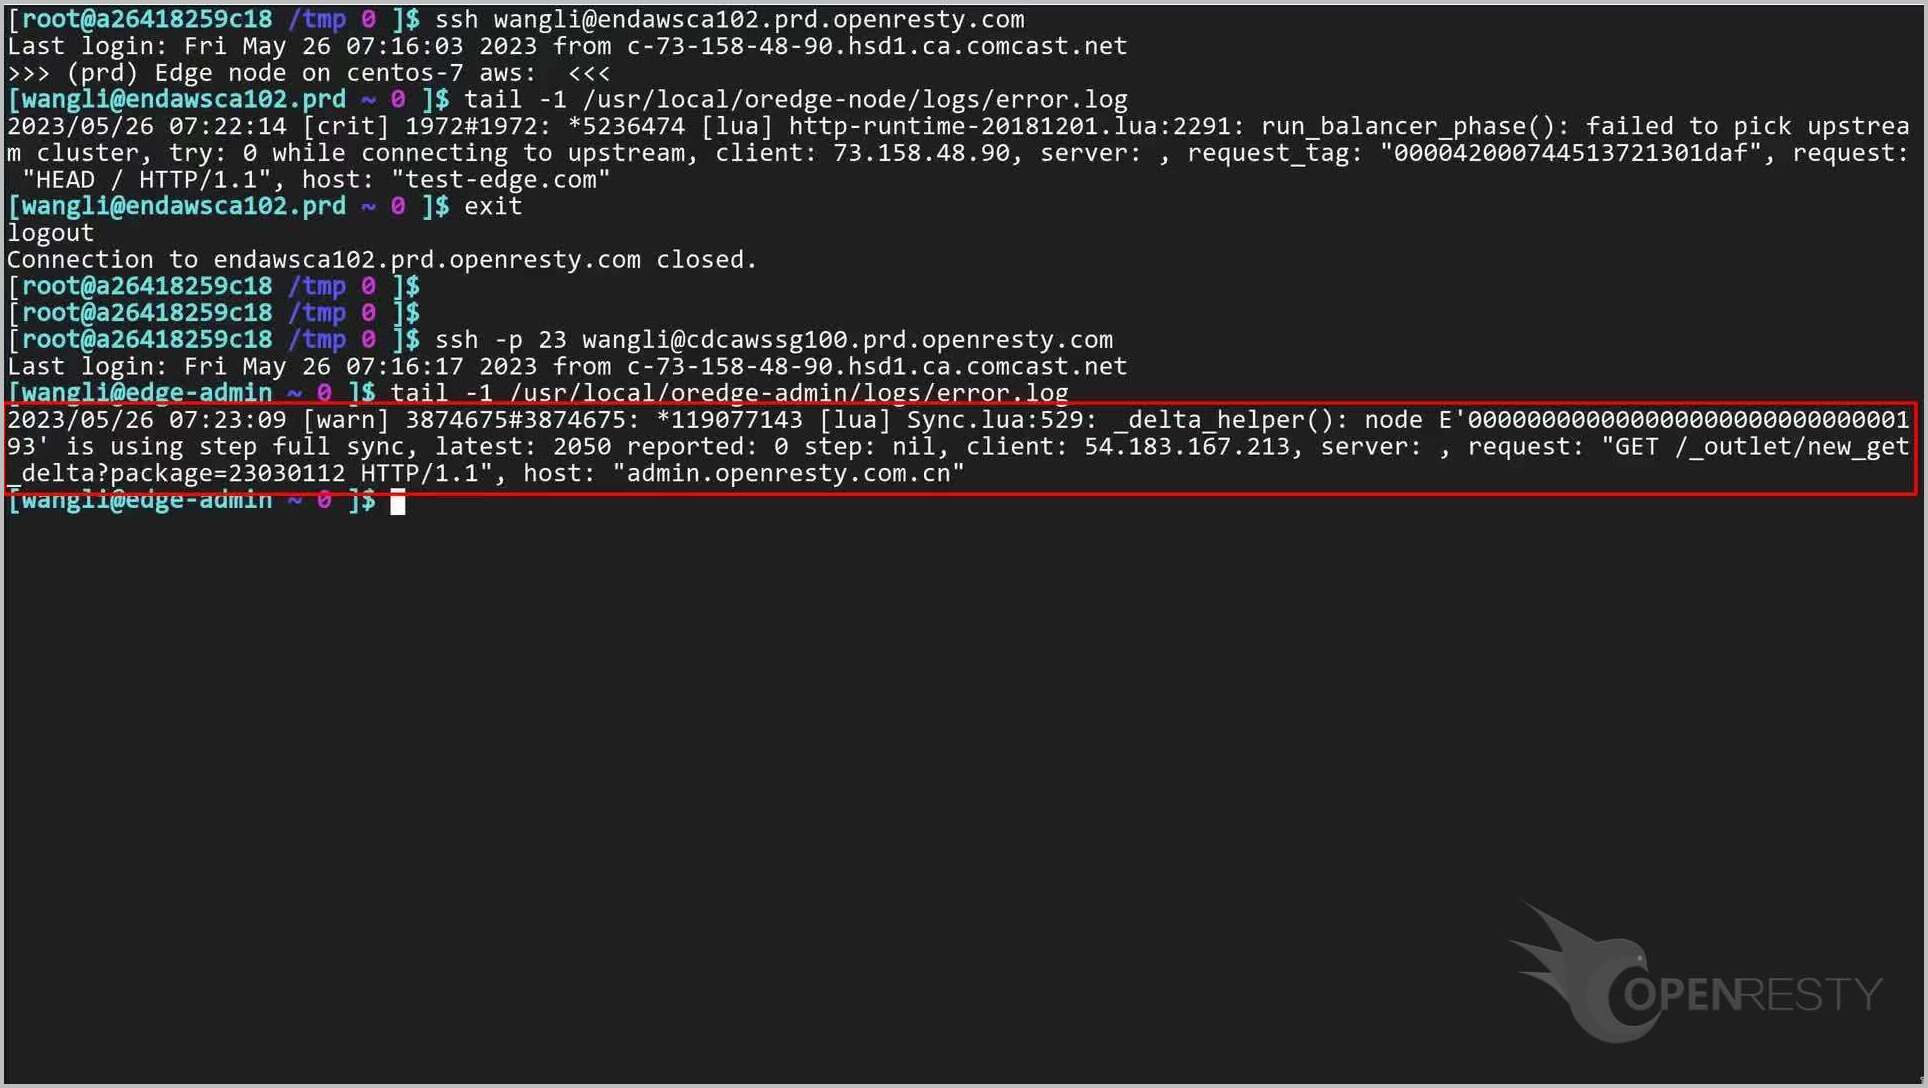
Frequently asked questions
Where can I view error logs in OpenResty Edge?
There are two places. Each application has its own error logs page inside the Admin console, showing errors for that application’s domains. Separately, the dashboard shows the global error logs collected across all gateway servers. For the raw files, you can also SSH into a gateway or Admin server and read its error.log directly.
How do I find the error log for a specific request?
Every response from OpenResty Edge carries a Request ID in its headers (shown as Req-ID). Copy that value and paste it into the Request ID filter on the application’s error logs page to jump straight to the matching entry. See What is a Request ID for how request tracing works end to end.
What are the three types of global error logs?
On the dashboard, global error logs are split into Global Error Logs (collected from the gateway servers, not tied to any application), Admin Site Error Logs (collected from the Admin console), and Log Server Error Logs (collected from the OpenResty Edge Log Server). Each can be filtered by log level and other conditions.
How do I set which error log levels are reported?
The reported log level is configured on the global config page. Setting it to warn, for example, means only messages at warn level and above are reported. The available levels include warn, error, crit, and alert. On your own local deployment you can pick whichever level you need.
How do I filter error logs to locate a problem?
The error logs page lets you narrow results by Request ID, gateway, server, error log level, and time interval. For example, you can select a single gateway (such as aws-us-west) to confirm whether errors are isolated to one location, or select the Error level to surface only the most severe messages.
What is OpenResty Edge
OpenResty Edge is our all-in-one gateway software for microservices and distributed traffic architectures. It combines traffic management, private CDN construction, API gateway, security, and more to help you easily build, manage, and protect modern applications. OpenResty Edge delivers industry-leading performance and scalability to meet the demanding needs of high concurrency, high load scenarios. It supports scheduling containerized application traffic such as K8s and manages massive domains, making it easy to meet the needs of large websites and complex applications.
If you like this tutorial, please subscribe to this blog site and/or our YouTube channel. Thank you!
About The Author
Yichun Zhang (Github handle: agentzh), is the original creator of the OpenResty® open-source project and the CEO of OpenResty Inc..
Yichun is one of the earliest advocates and leaders of “open-source technology”. He worked at many internationally renowned tech companies, such as Cloudflare, Yahoo!. He is a pioneer of “edge computing”, “dynamic tracing” and “machine coding”, with over 22 years of programming and 16 years of open source experience. Yichun is well-known in the open-source space as the project leader of OpenResty®, adopted by more than 40 million global website domains.
OpenResty Inc., the enterprise software start-up founded by Yichun in 2017, has customers from some of the biggest companies in the world. Its flagship product, OpenResty XRay, is a non-invasive profiling and troubleshooting tool that significantly enhances and utilizes dynamic tracing technology. And its OpenResty Edge product is a powerful distributed traffic management and private CDN software product.
As an avid open-source contributor, Yichun has contributed more than a million lines of code to numerous open-source projects, including Linux kernel, Nginx, LuaJIT, GDB, SystemTap, LLVM, Perl, etc. He has also authored more than 60 open-source software libraries.
Related Articles
OpenResty XRay May 30, 2023

OpenResty XRay Dec 21, 2023

OpenResty XRay Dec 4, 2023

OpenResty XRay Nov 23, 2023

OpenResty XRay Nov 21, 2023