How to use custom dynamic metrics in OpenResty Edge
Today I’ll demonstrate another feature in OpenResty Edge. That is, using the Metric SQL language to create brand new dynamic metrics.
Introduction to dynamic metrics
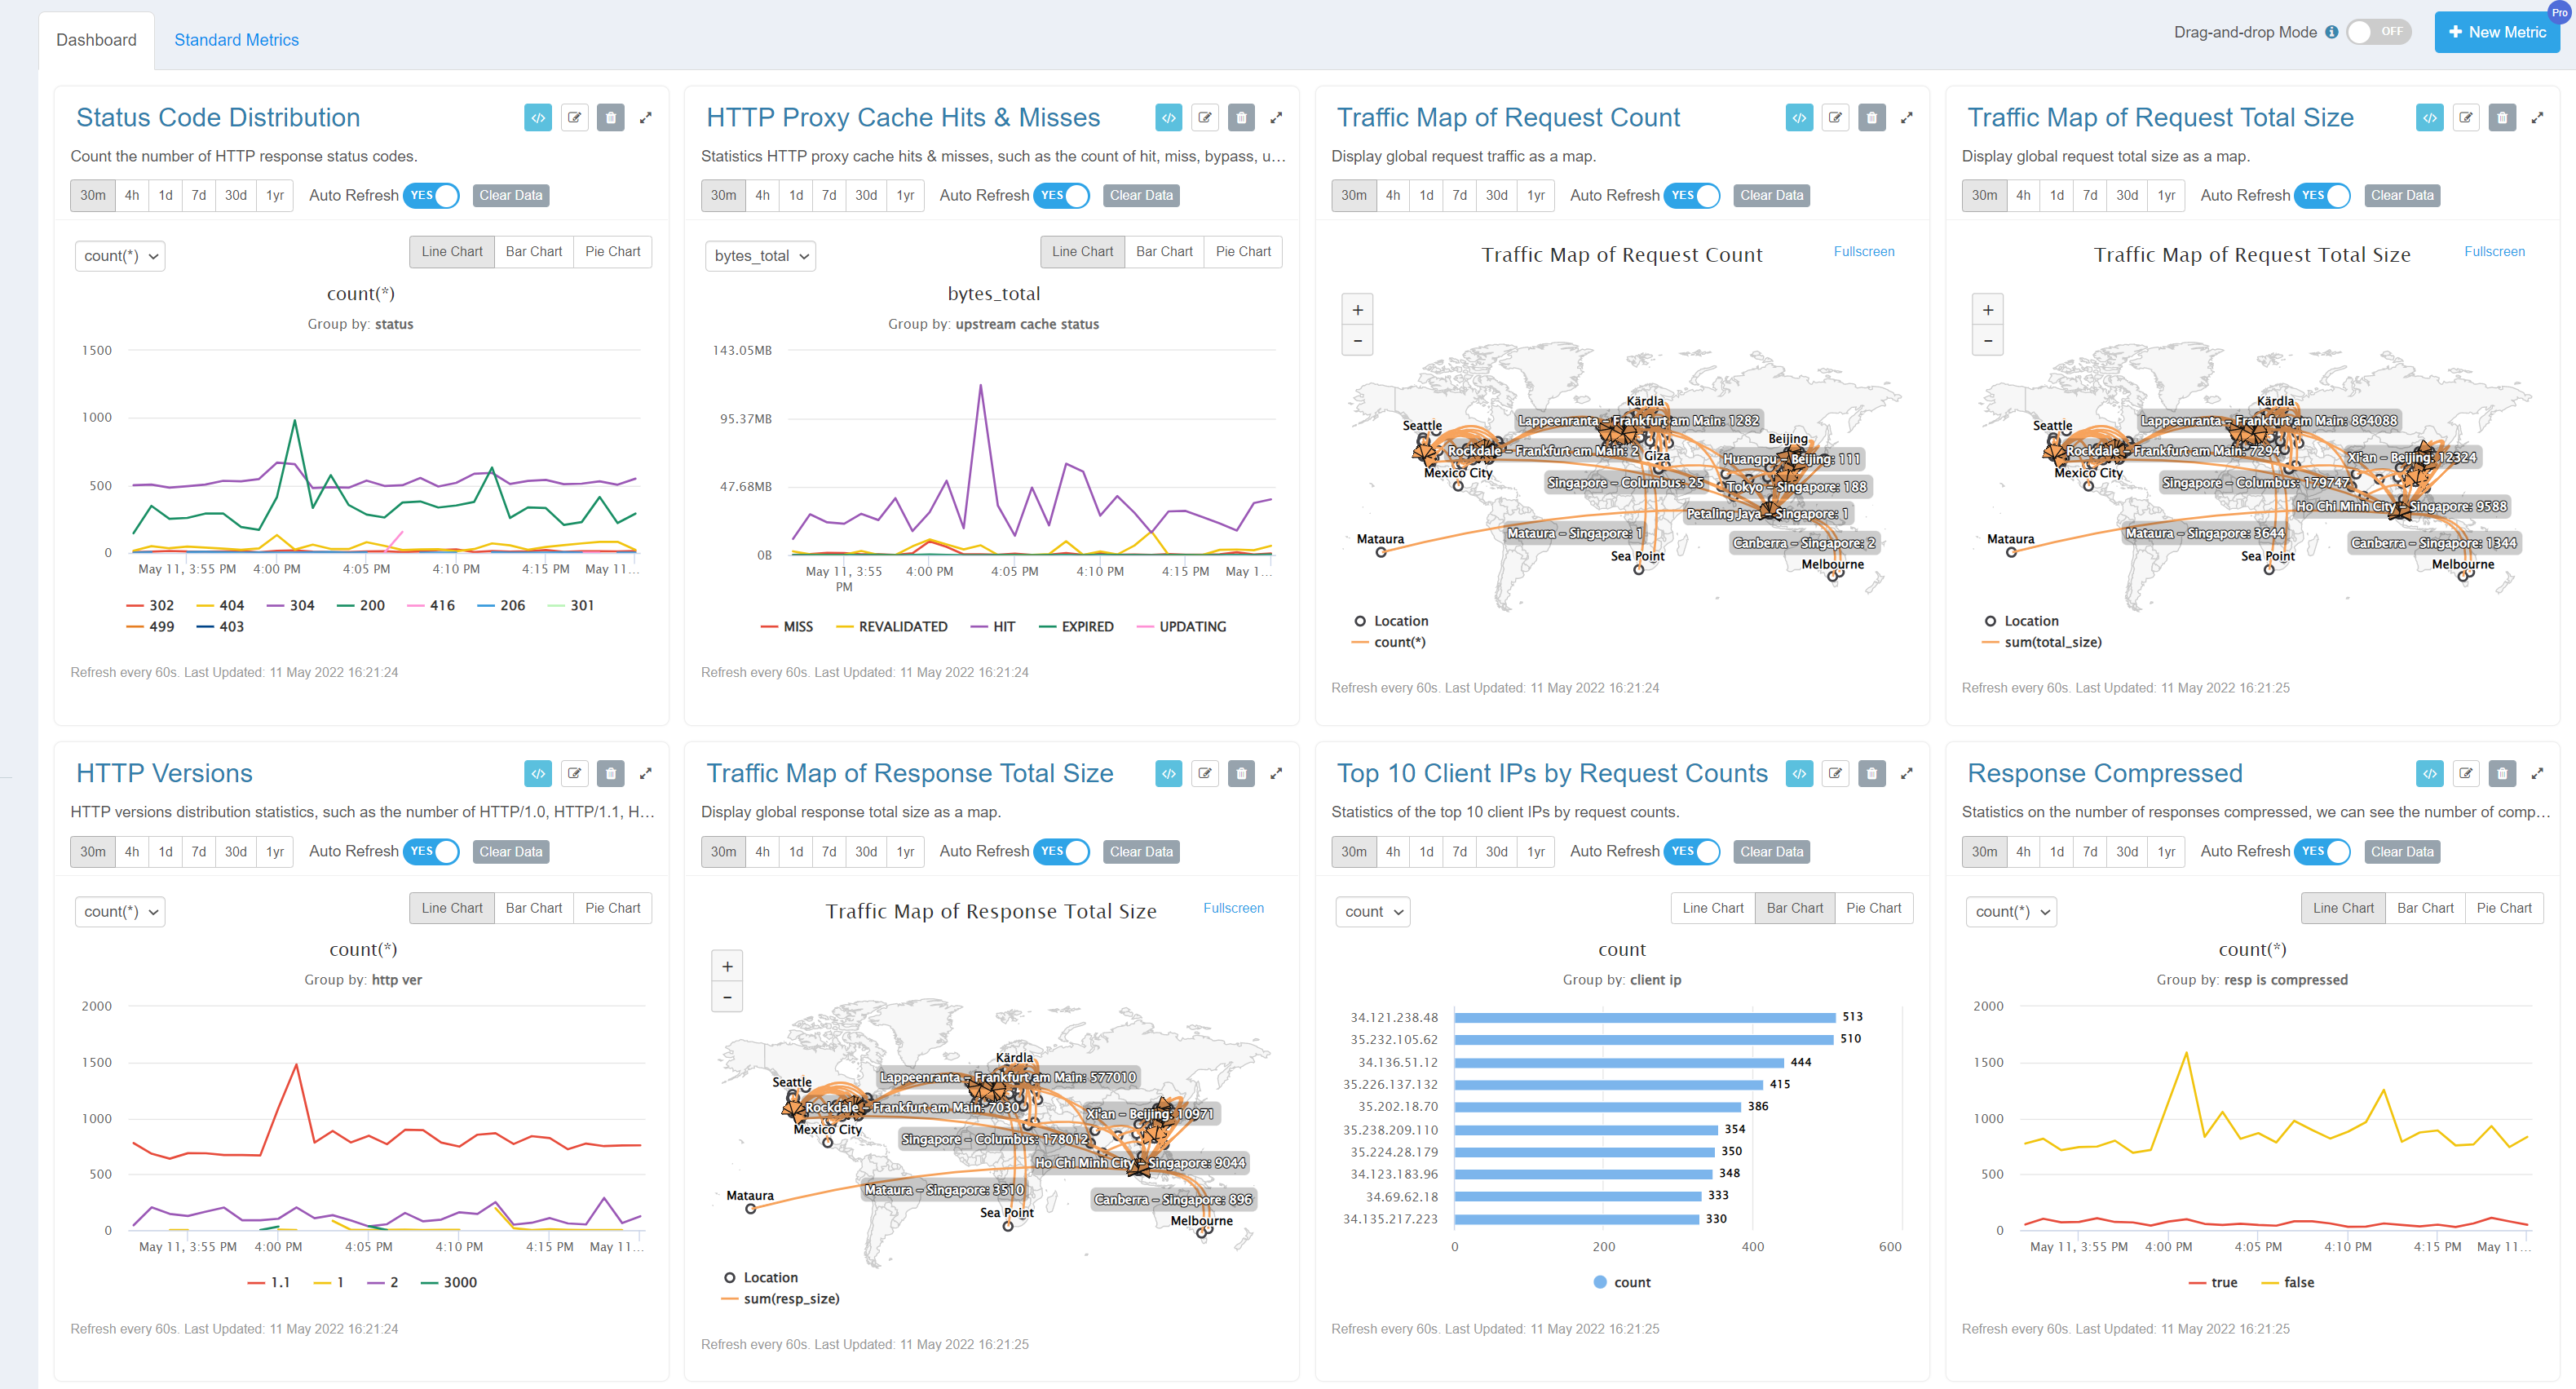
Dynamic metrics allow the user to create custom metrics by writing SQL-like queries on the fly. OpenResty Edge automatically generates efficient code to collect and aggregate the metric data in each gateway server’s memory. The data is then reported to the web console and displayed in pretty charts in real-time.
Don’t worry. It uses fixed-size memory for streaming aggregation and statistics. The system uses our own optimizing compiler to generate efficient native code for each user-defined metric.

Create custom dynamic metrics for the sample application
Let’s go to the OpenResty Edge’s Admin web console. It is our sample deployment of the console. Every user has her local deployment.
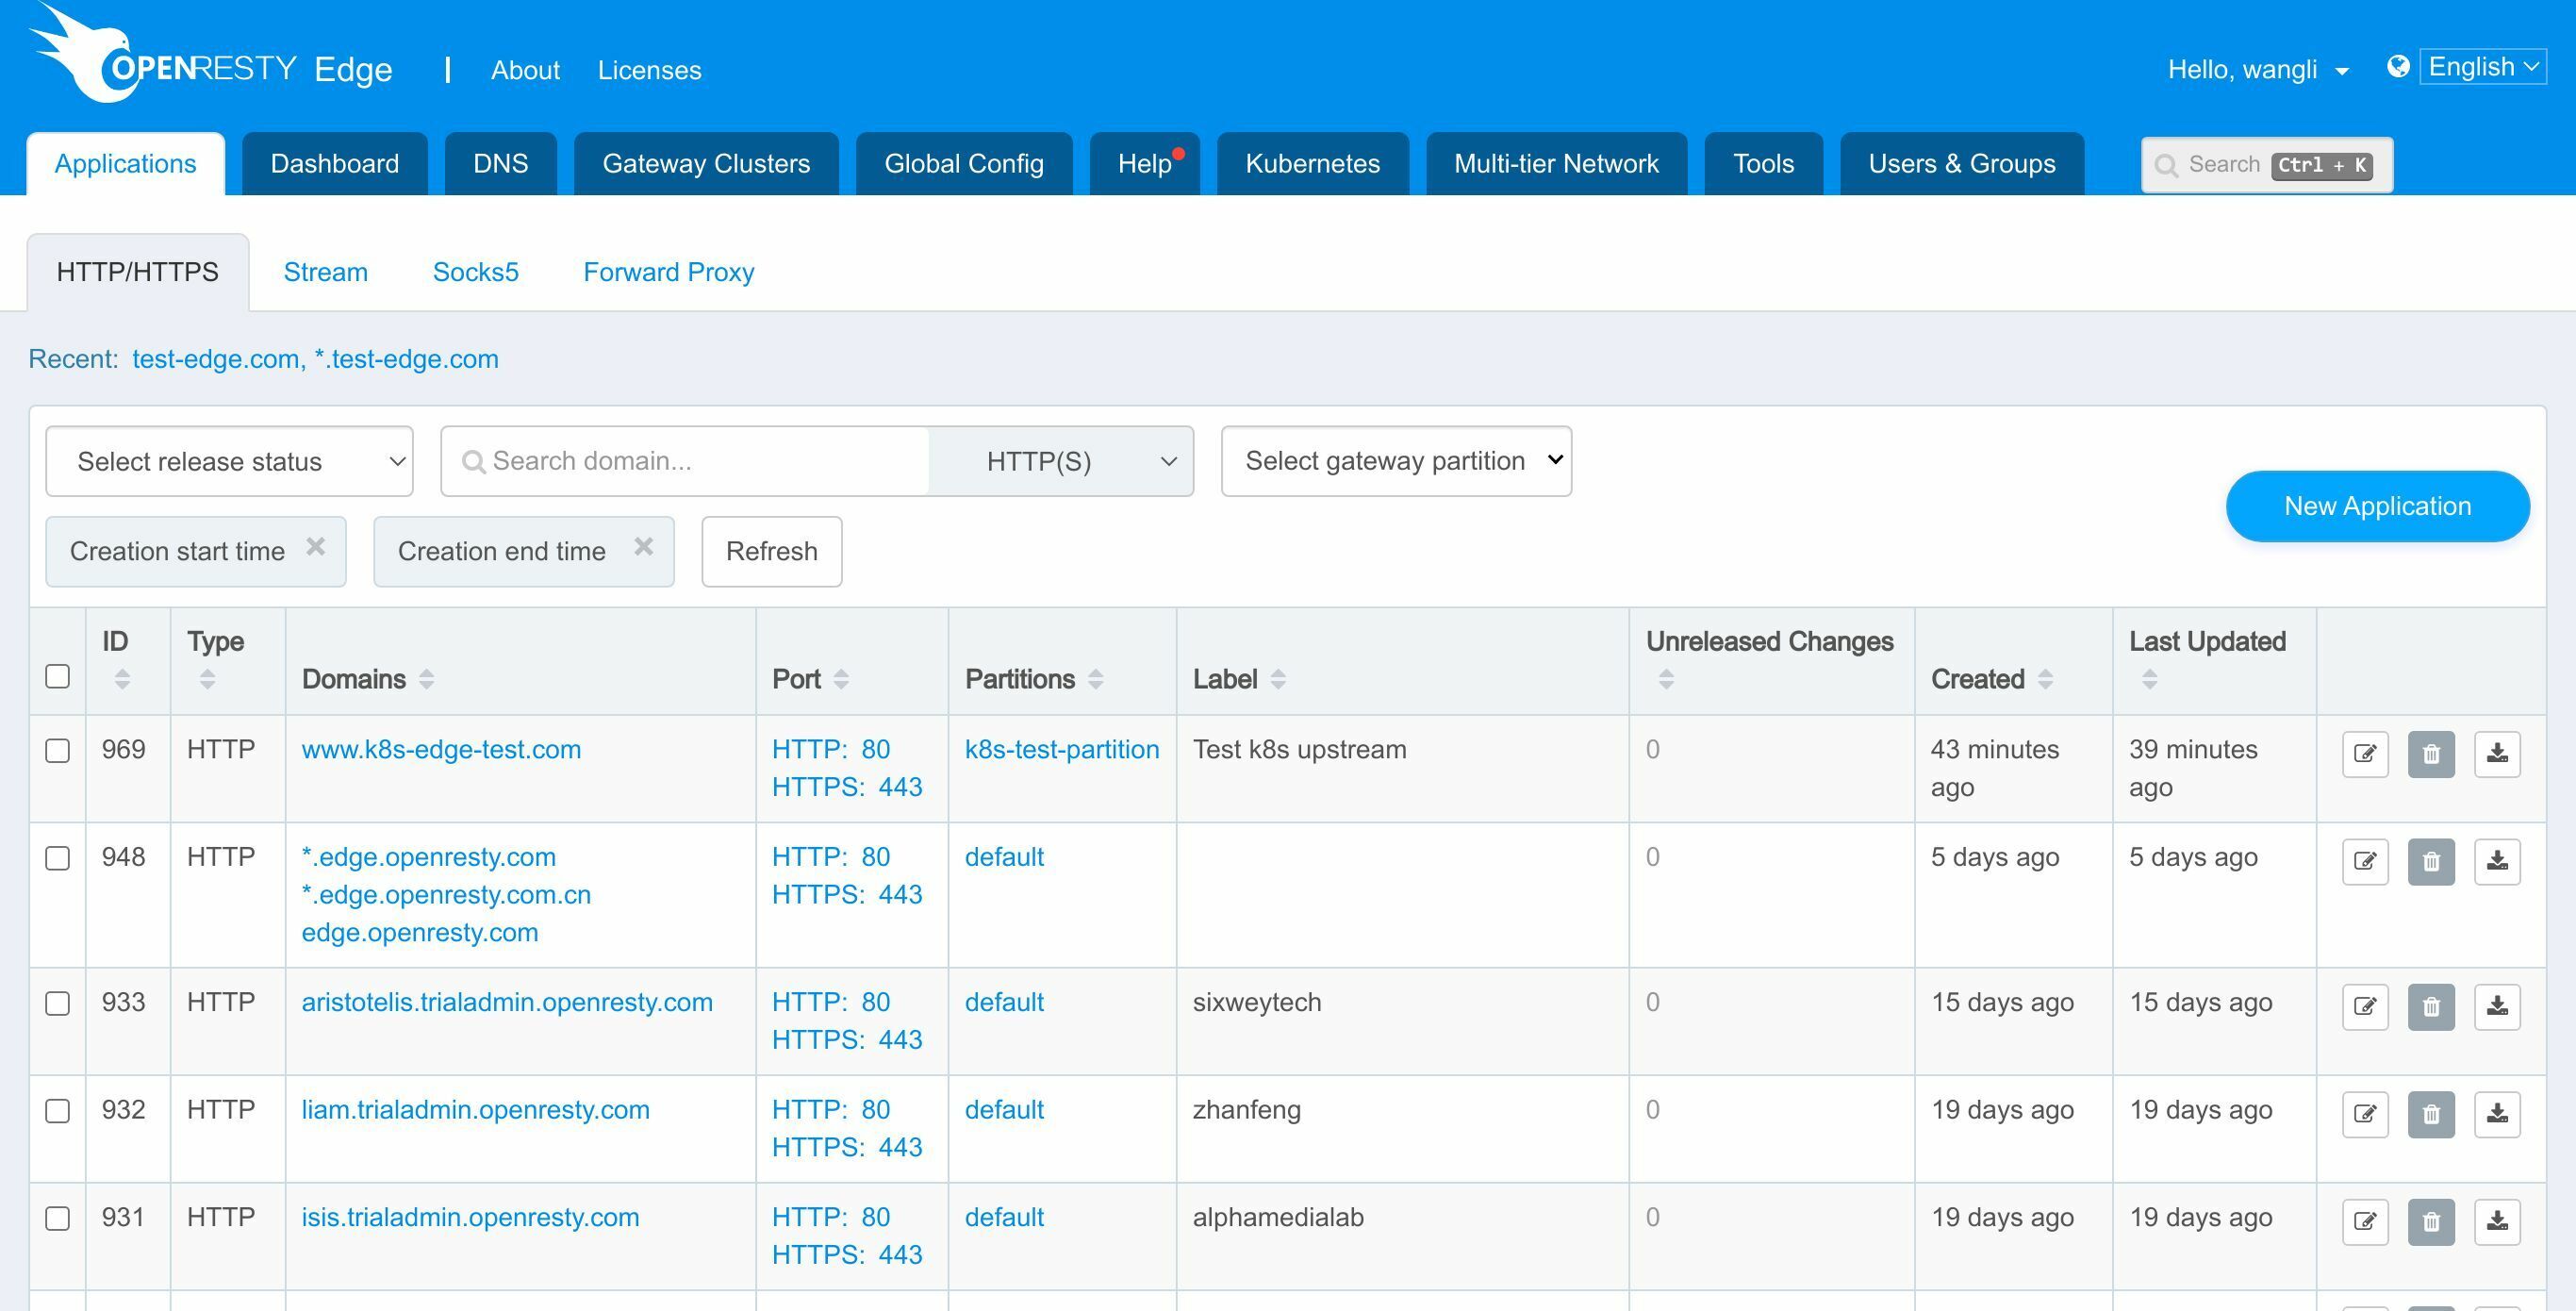
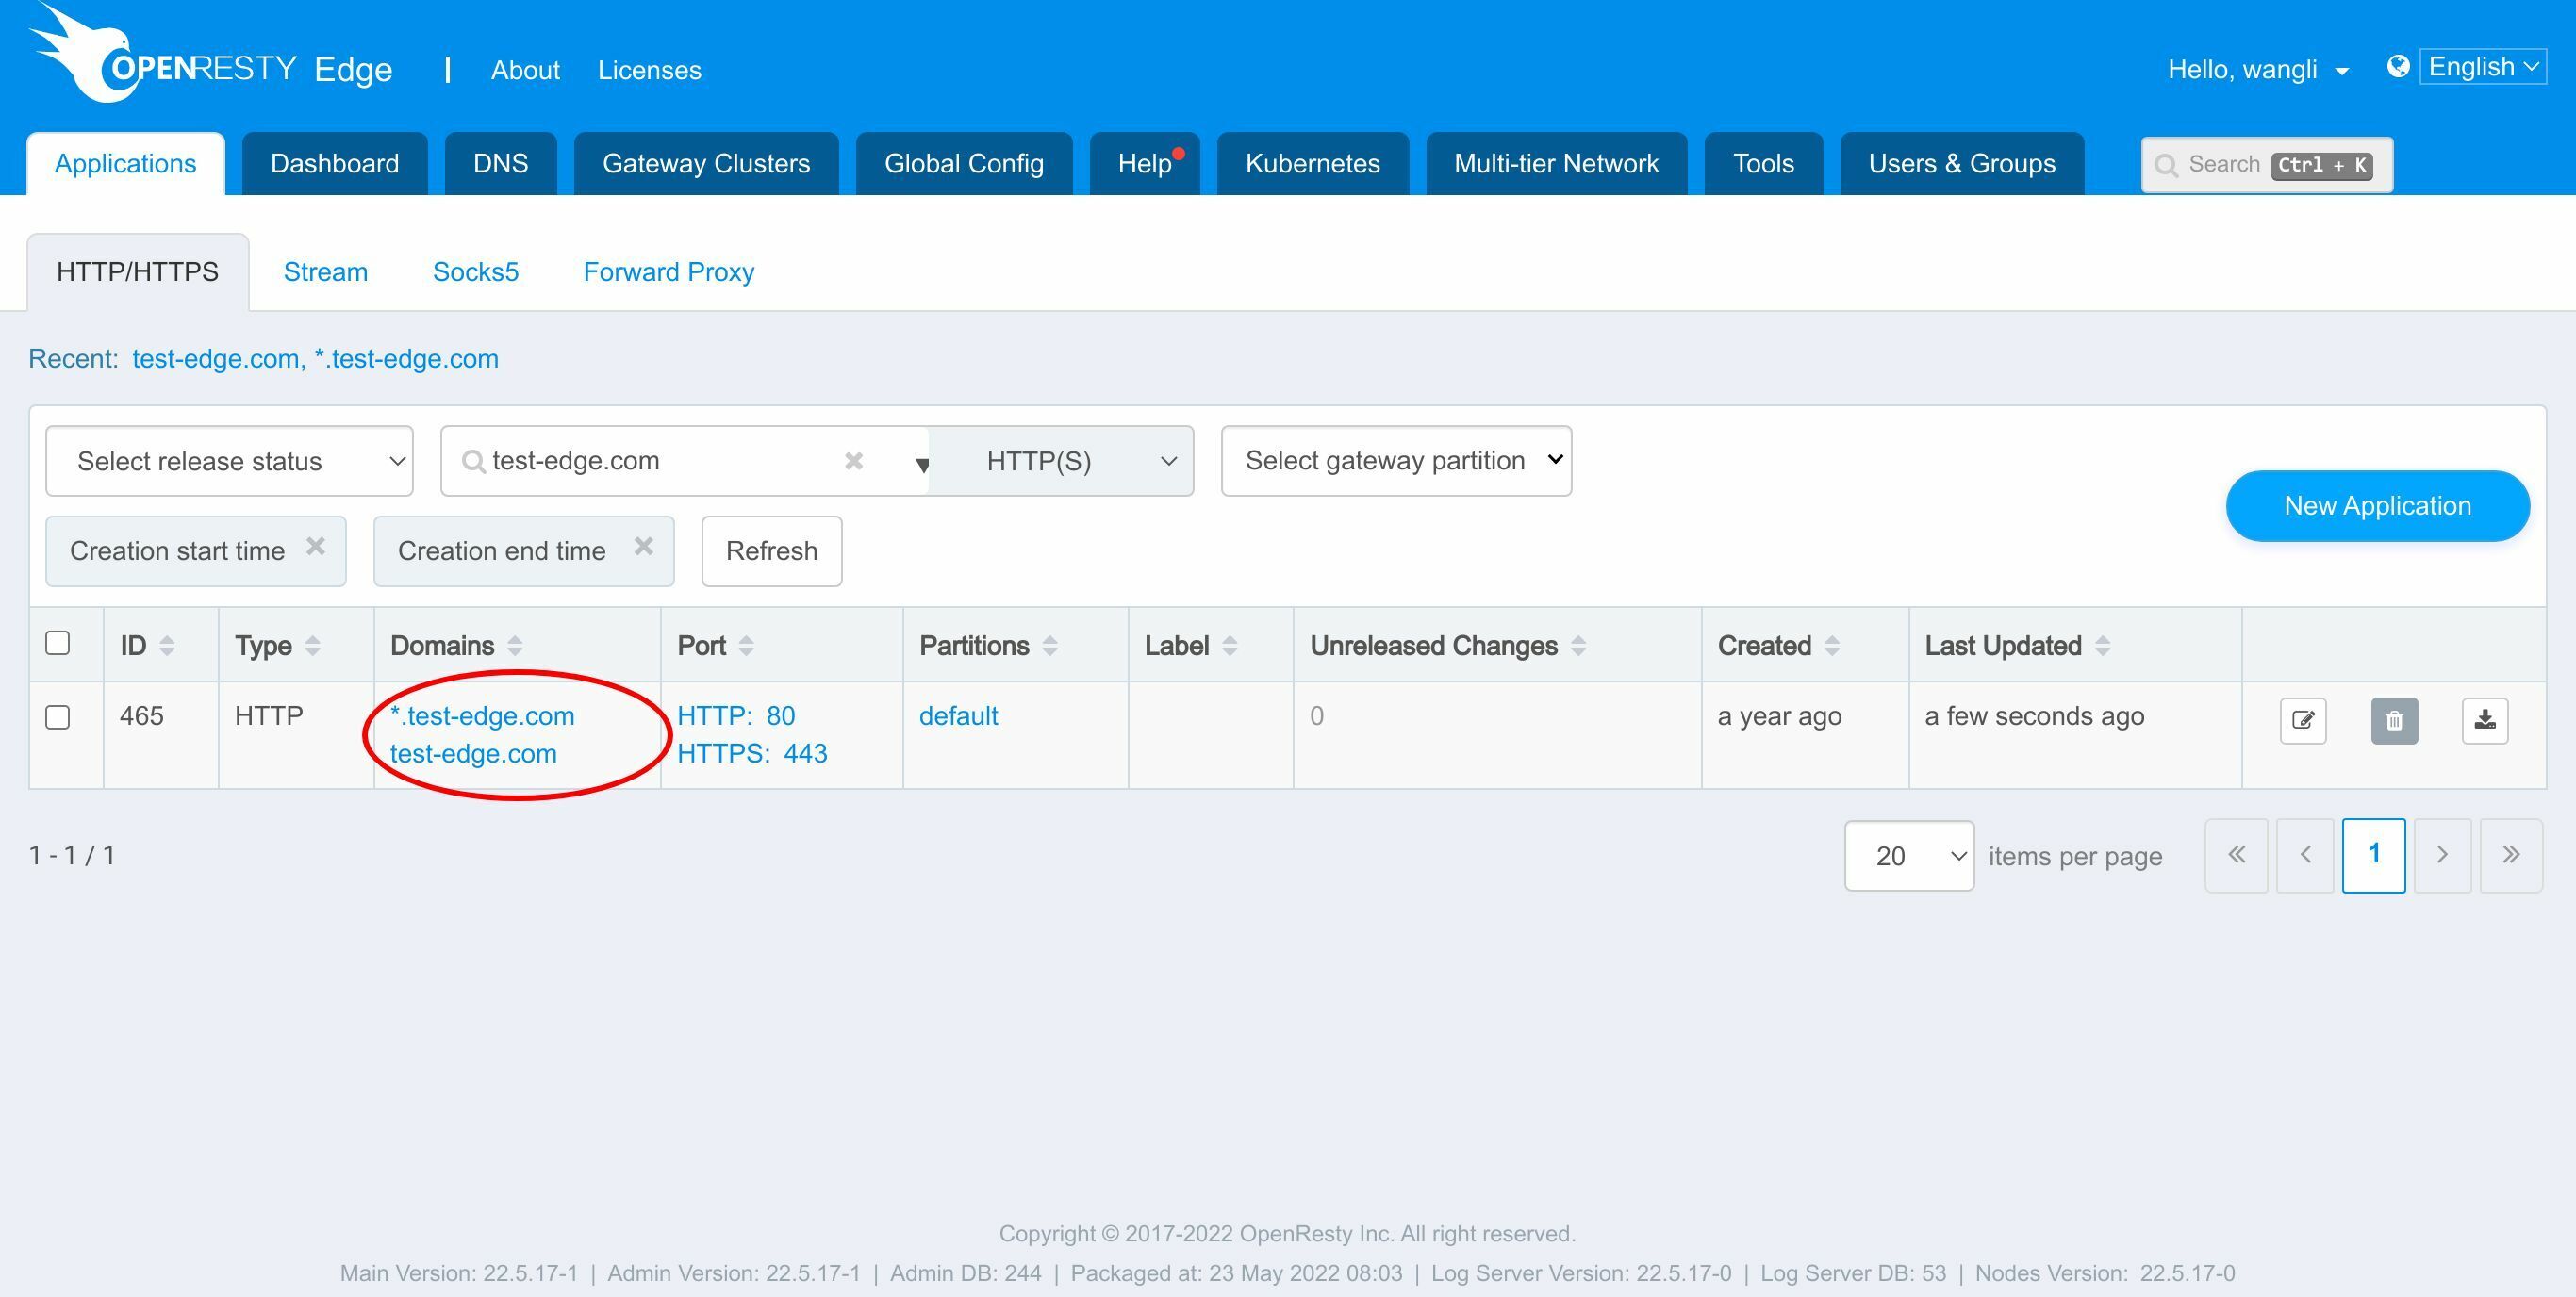
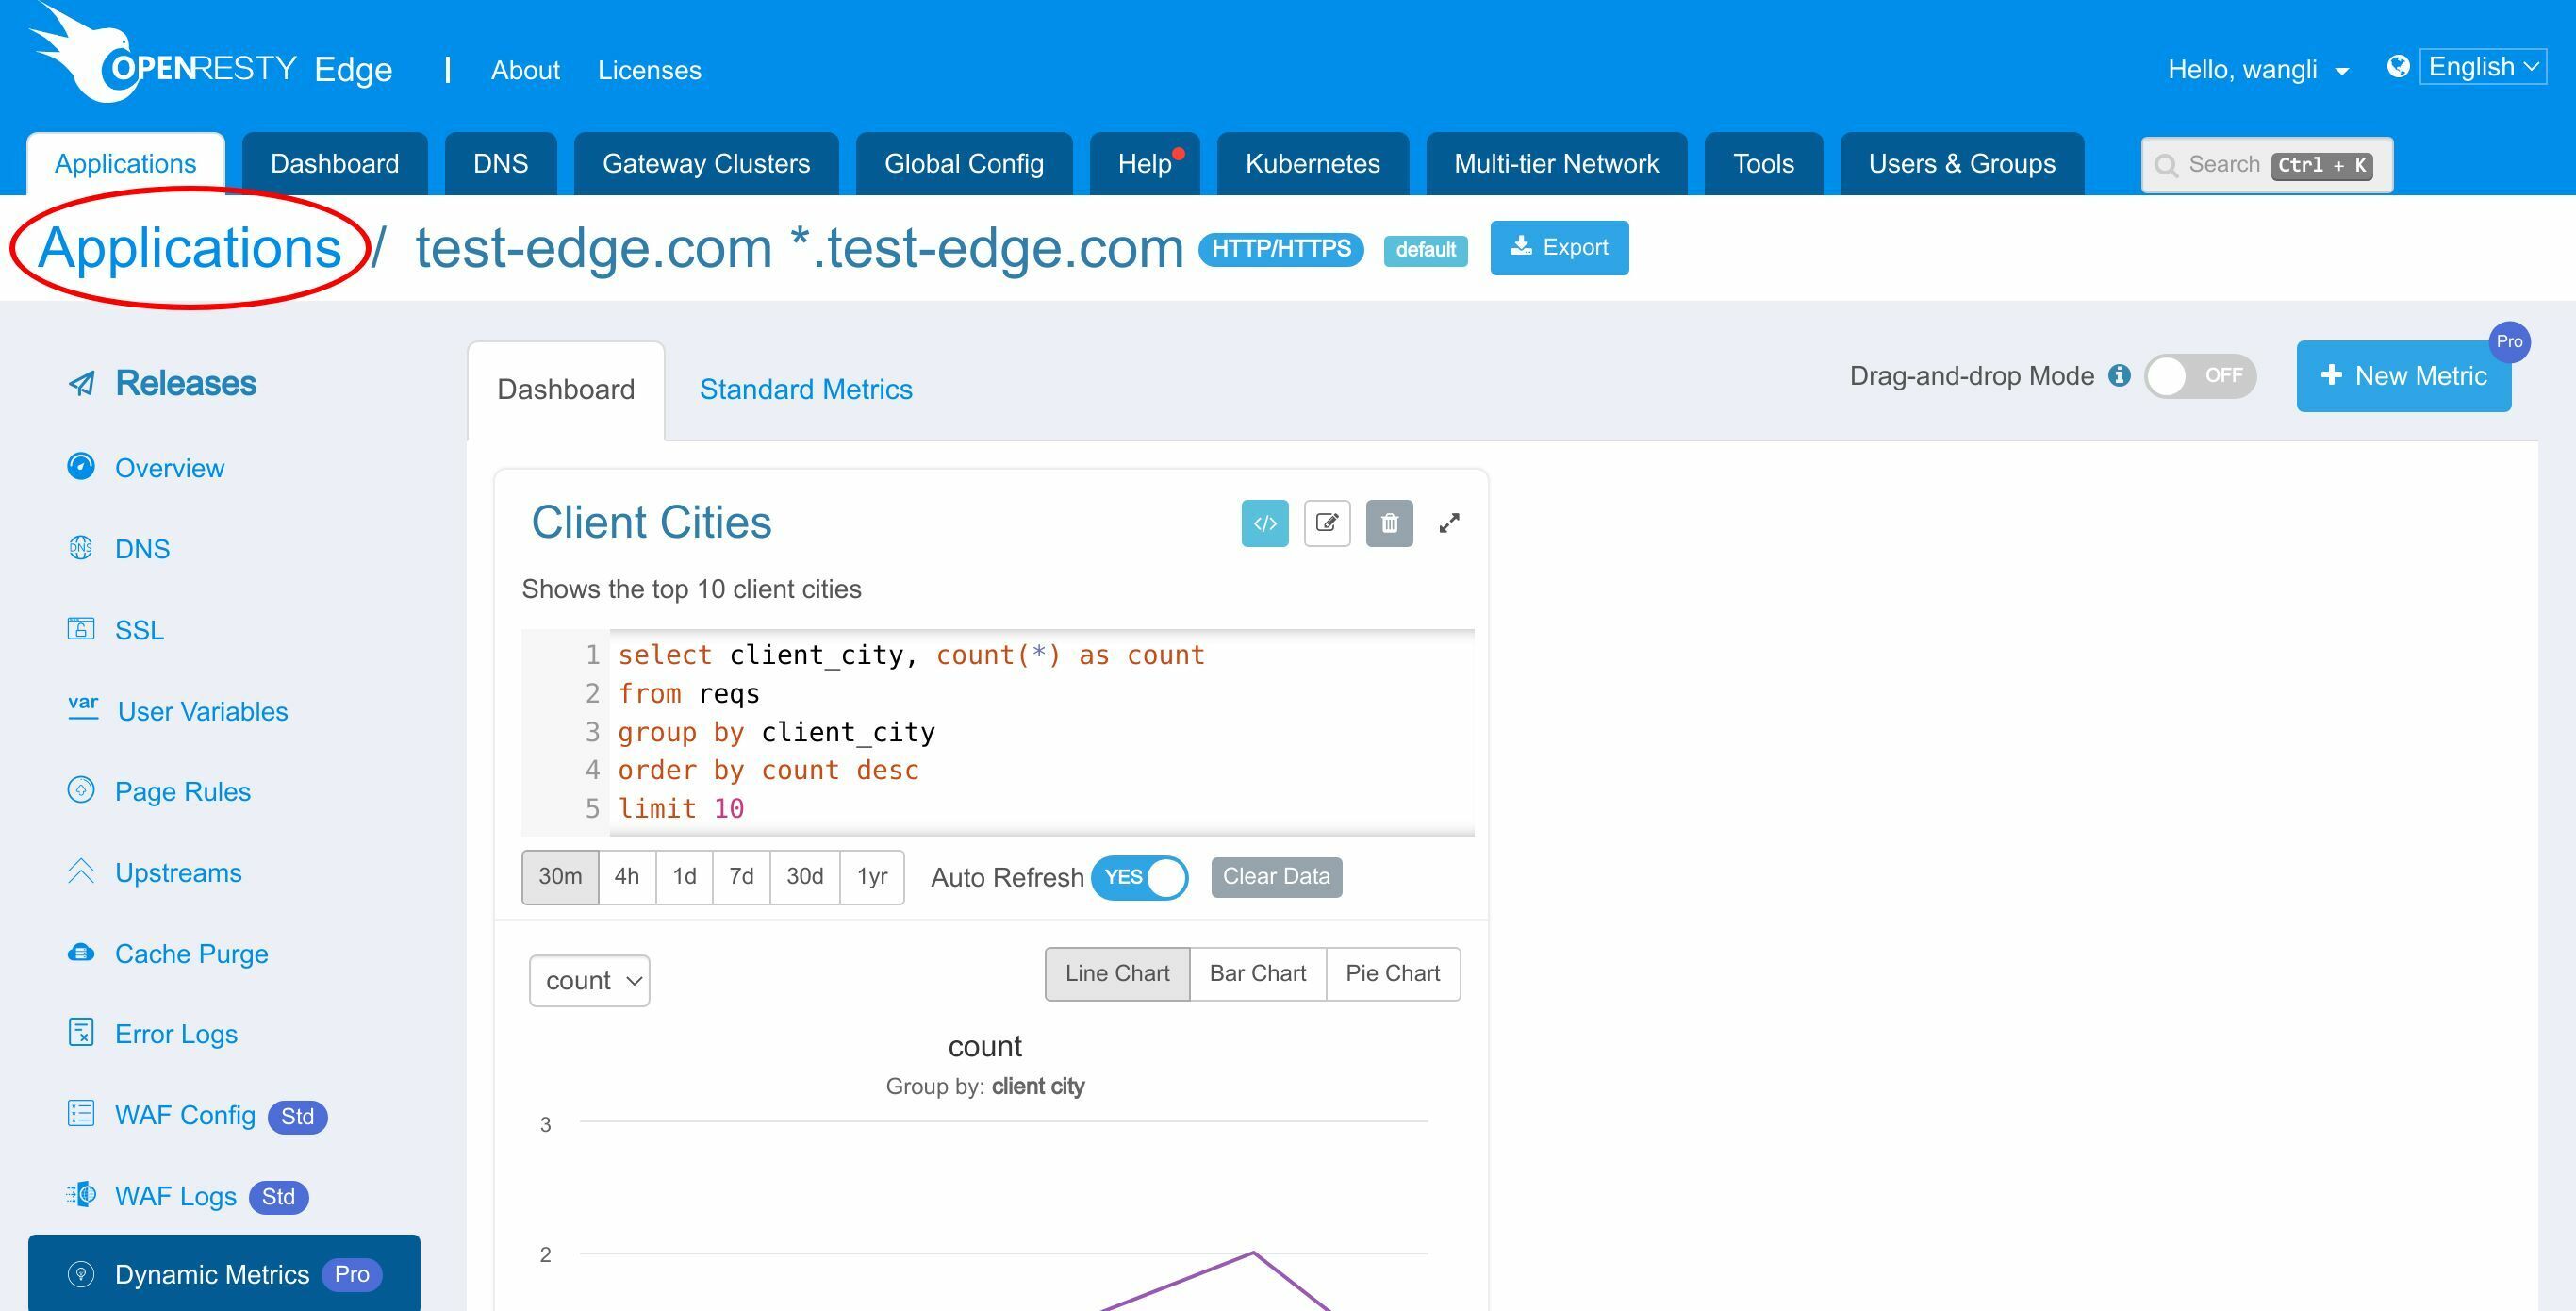
We use our continuing sample application for the test-edge.com domain.

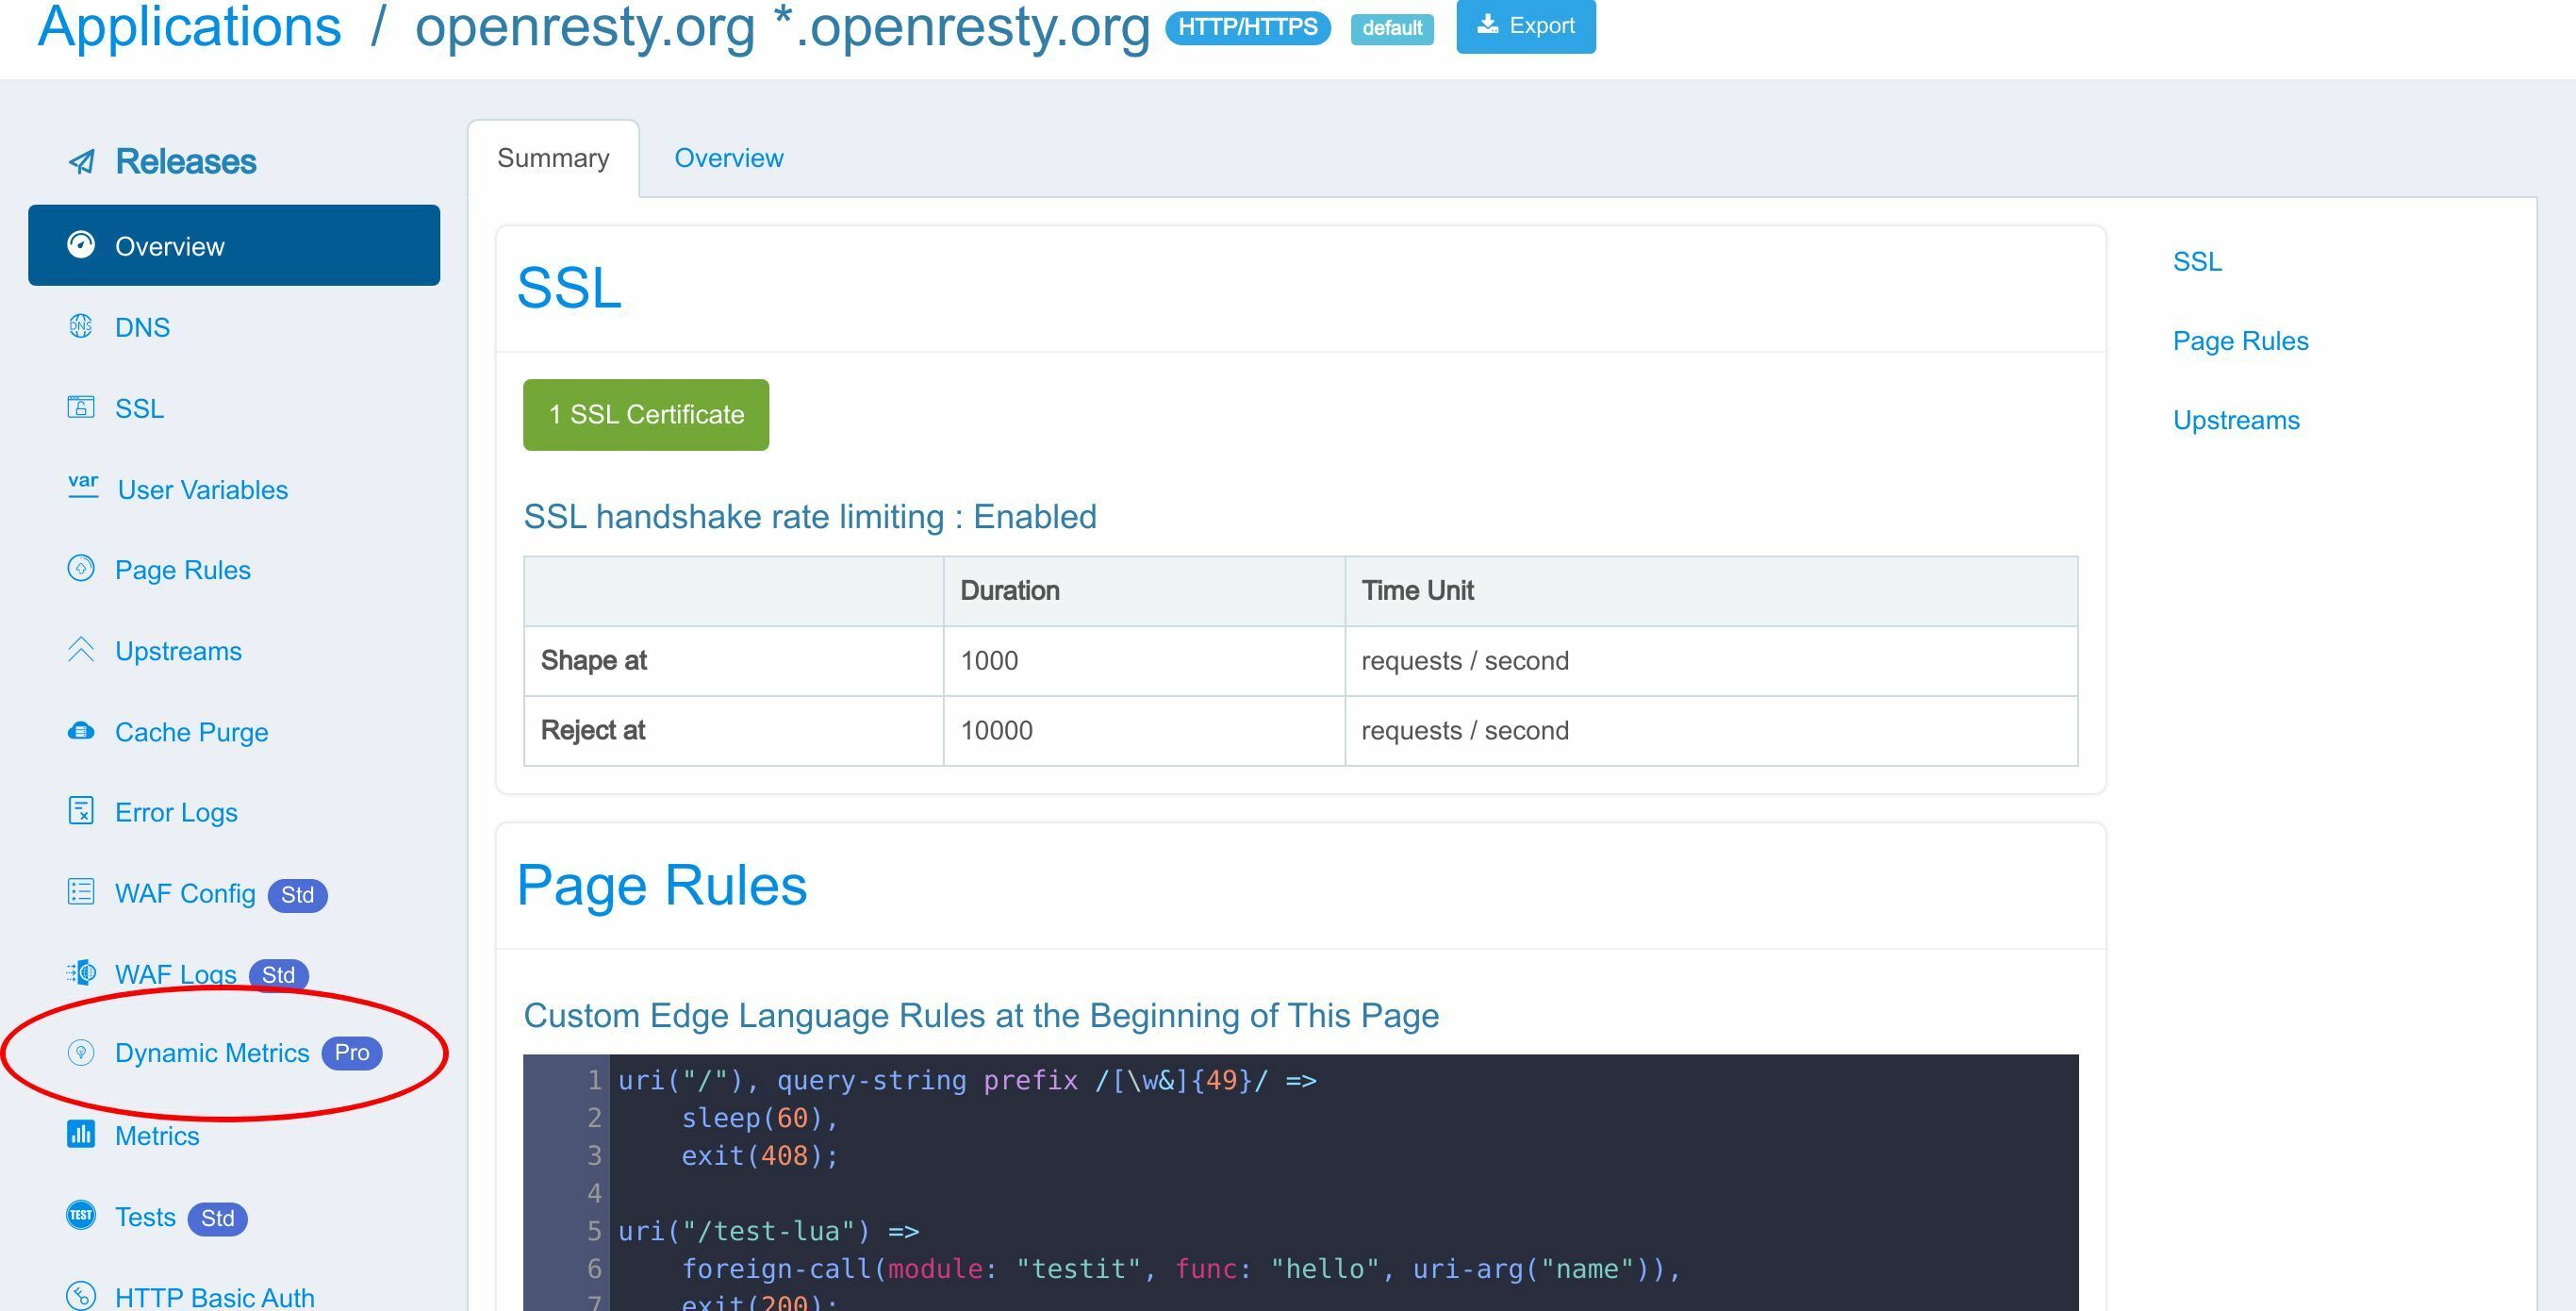
Let’s enter this application.
Click this menu to enter Dynamic Metrics page.
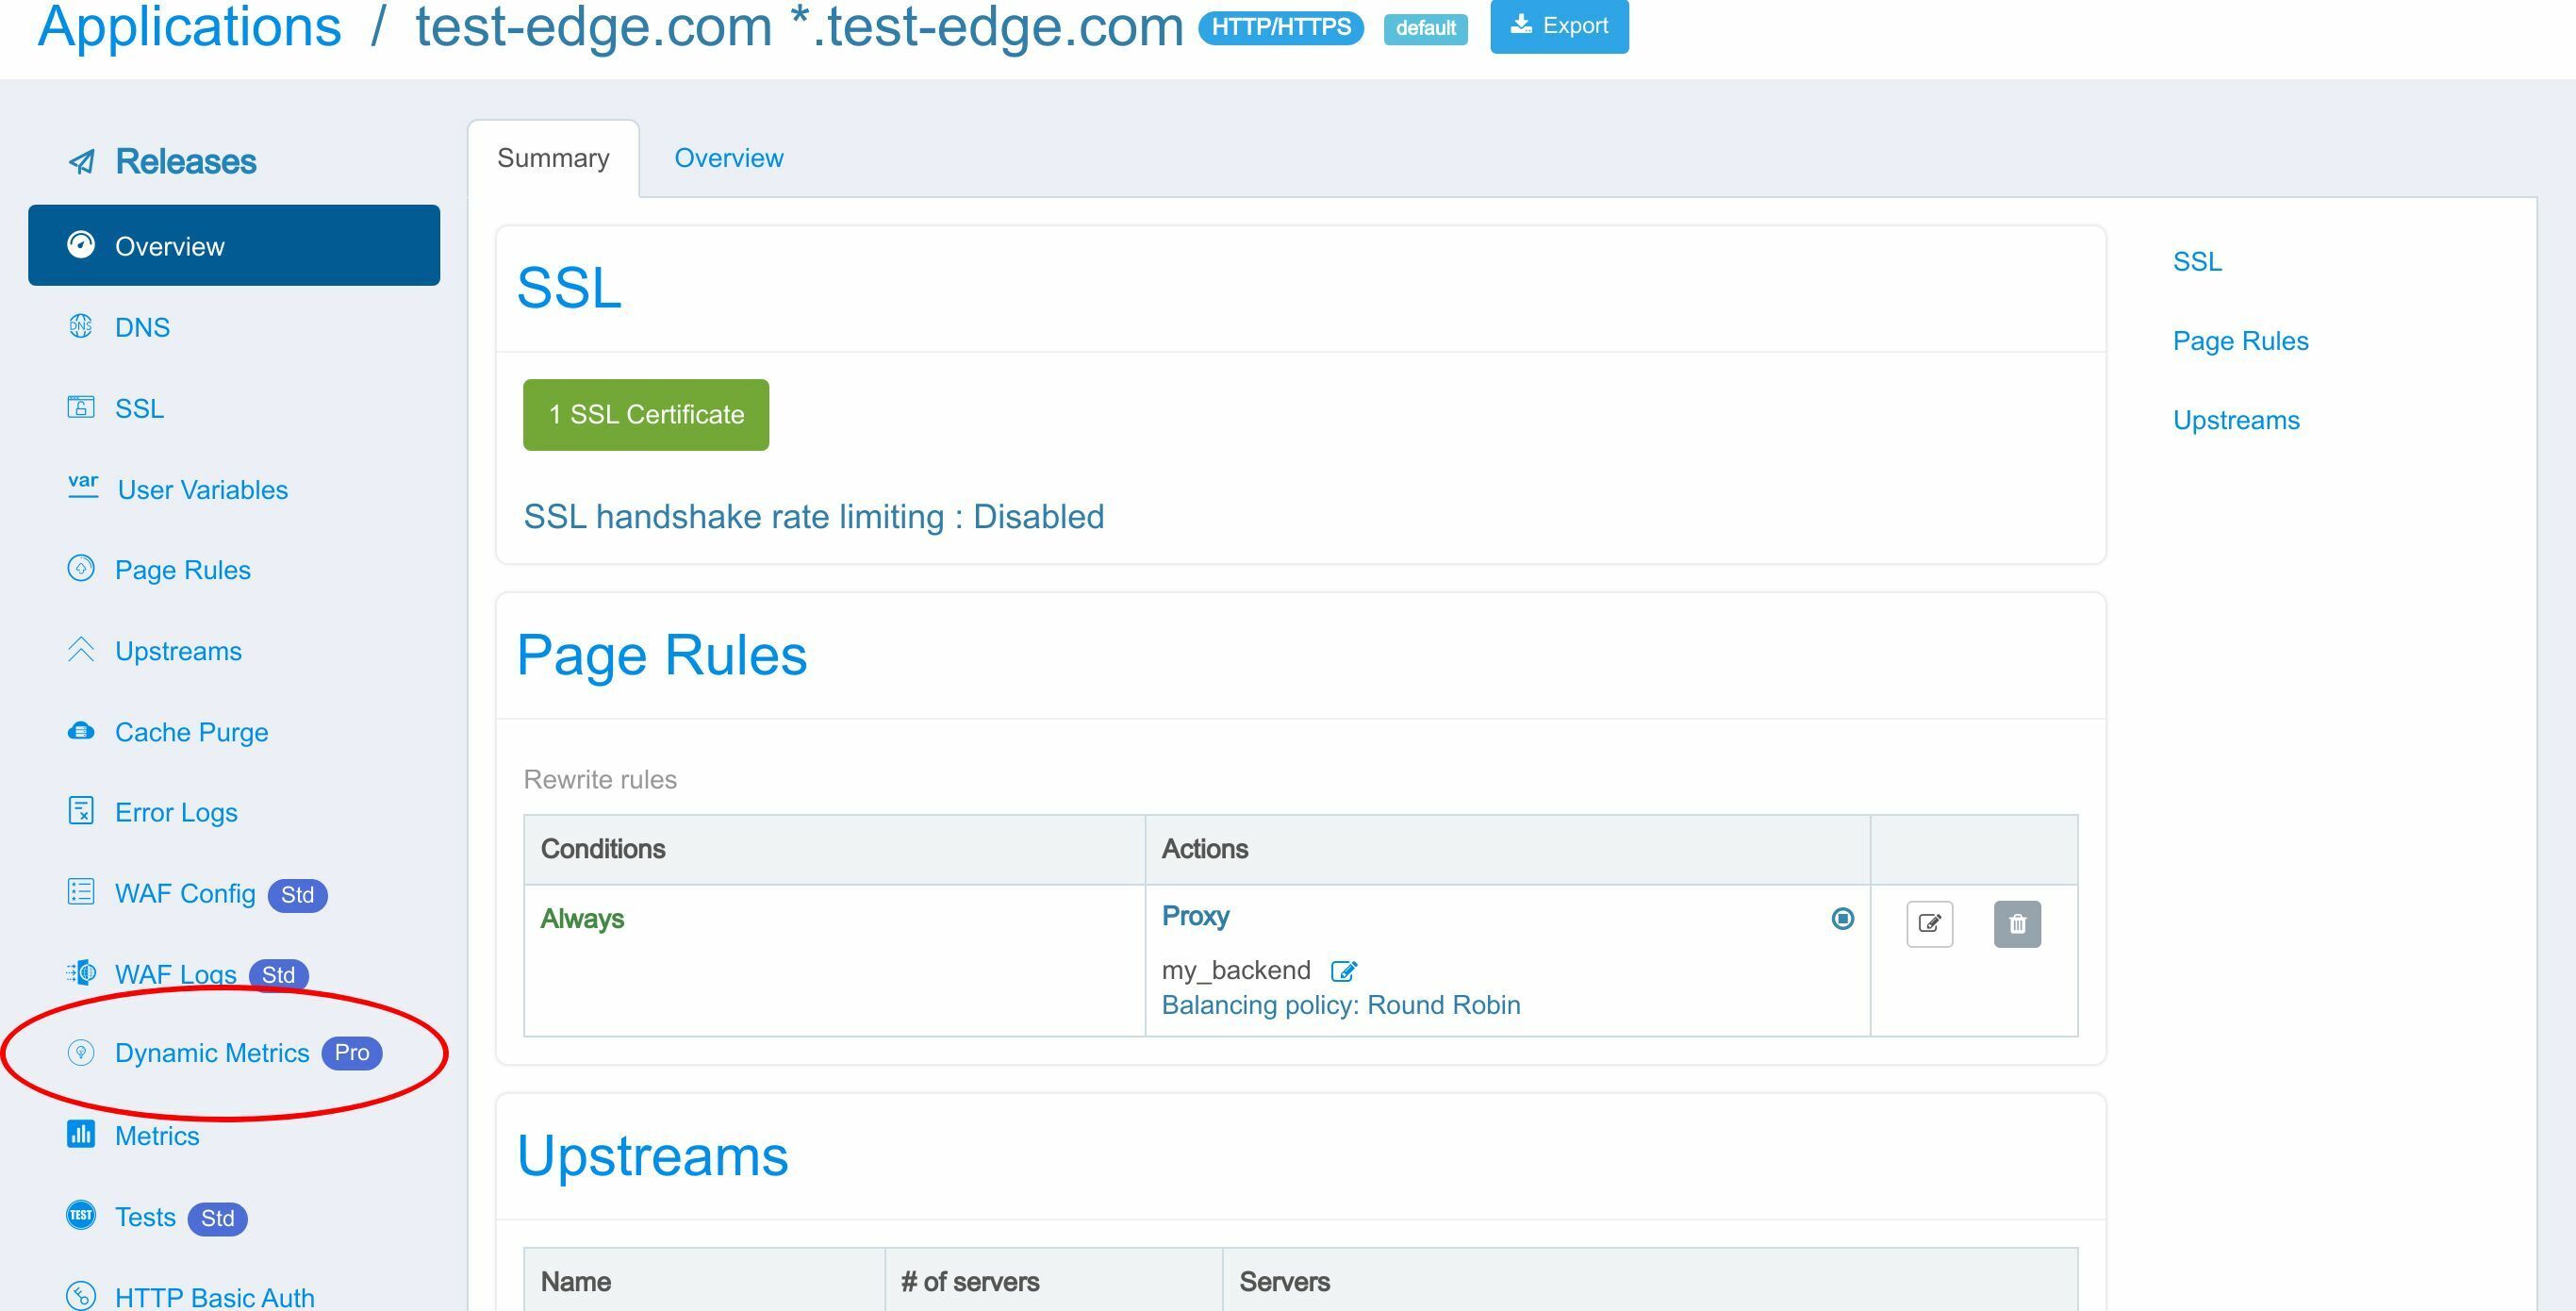
There are two types of dynamic metrics. One is custom dynamic metrics defined by users.
The other one is standard dynamic metrics predefined by OpenResty Edge.

We will focus on the custom ones today. Standard ones get covered in another tutorial.
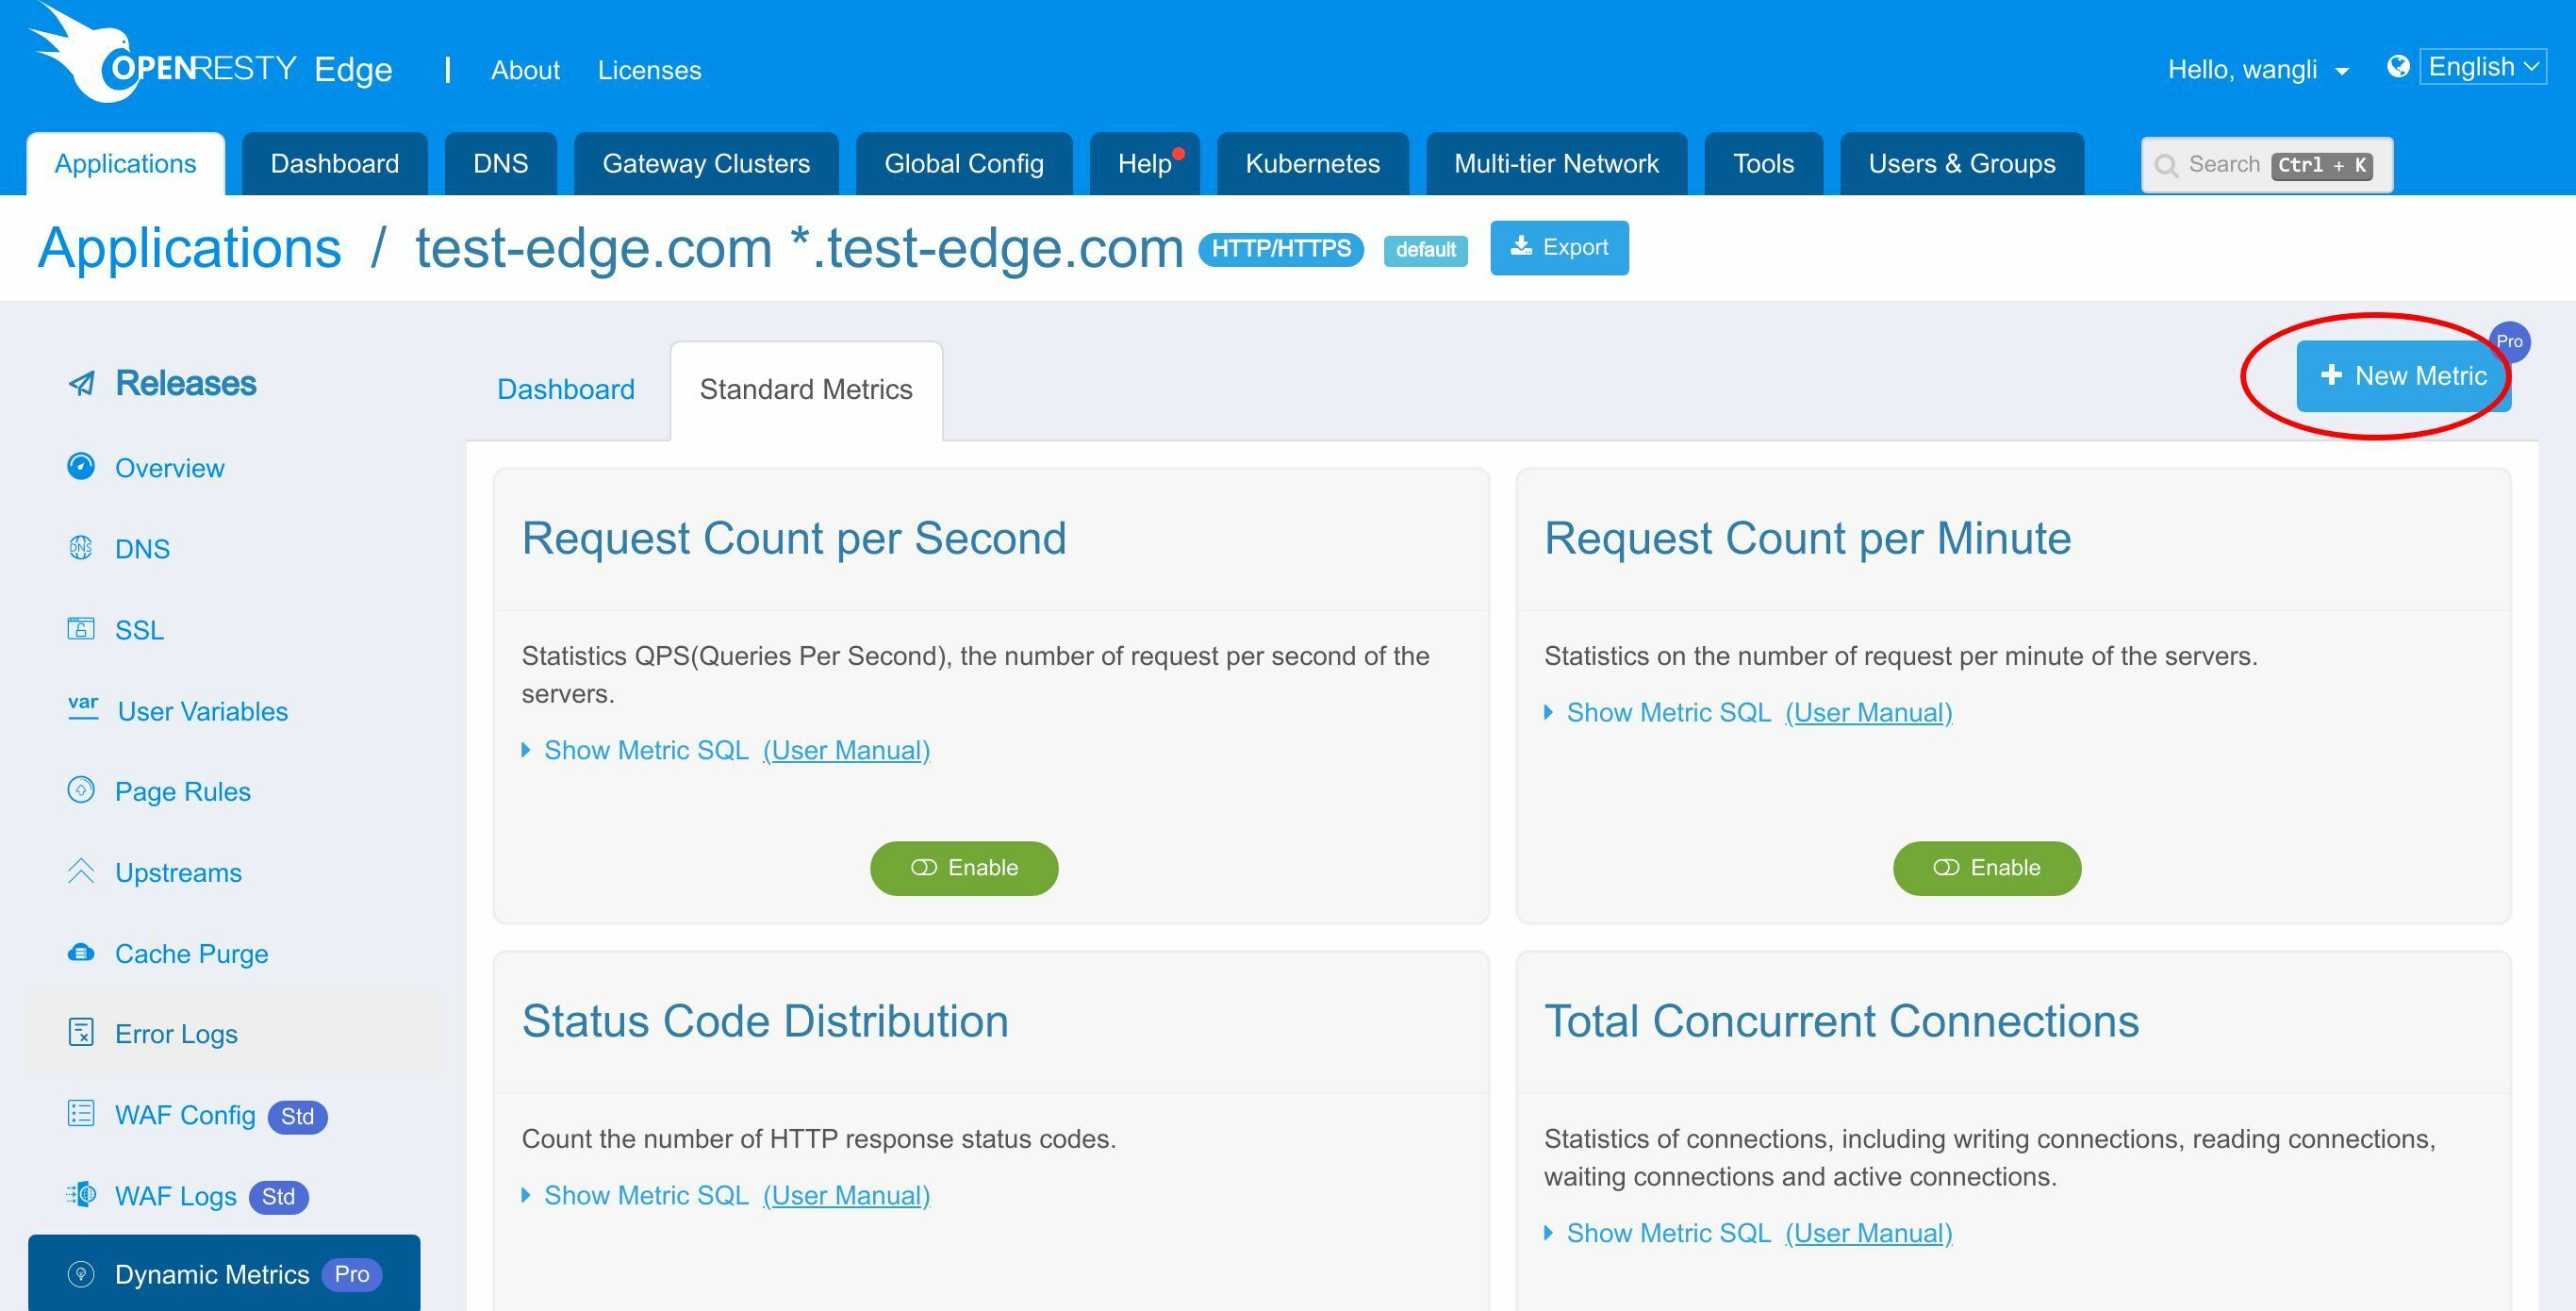
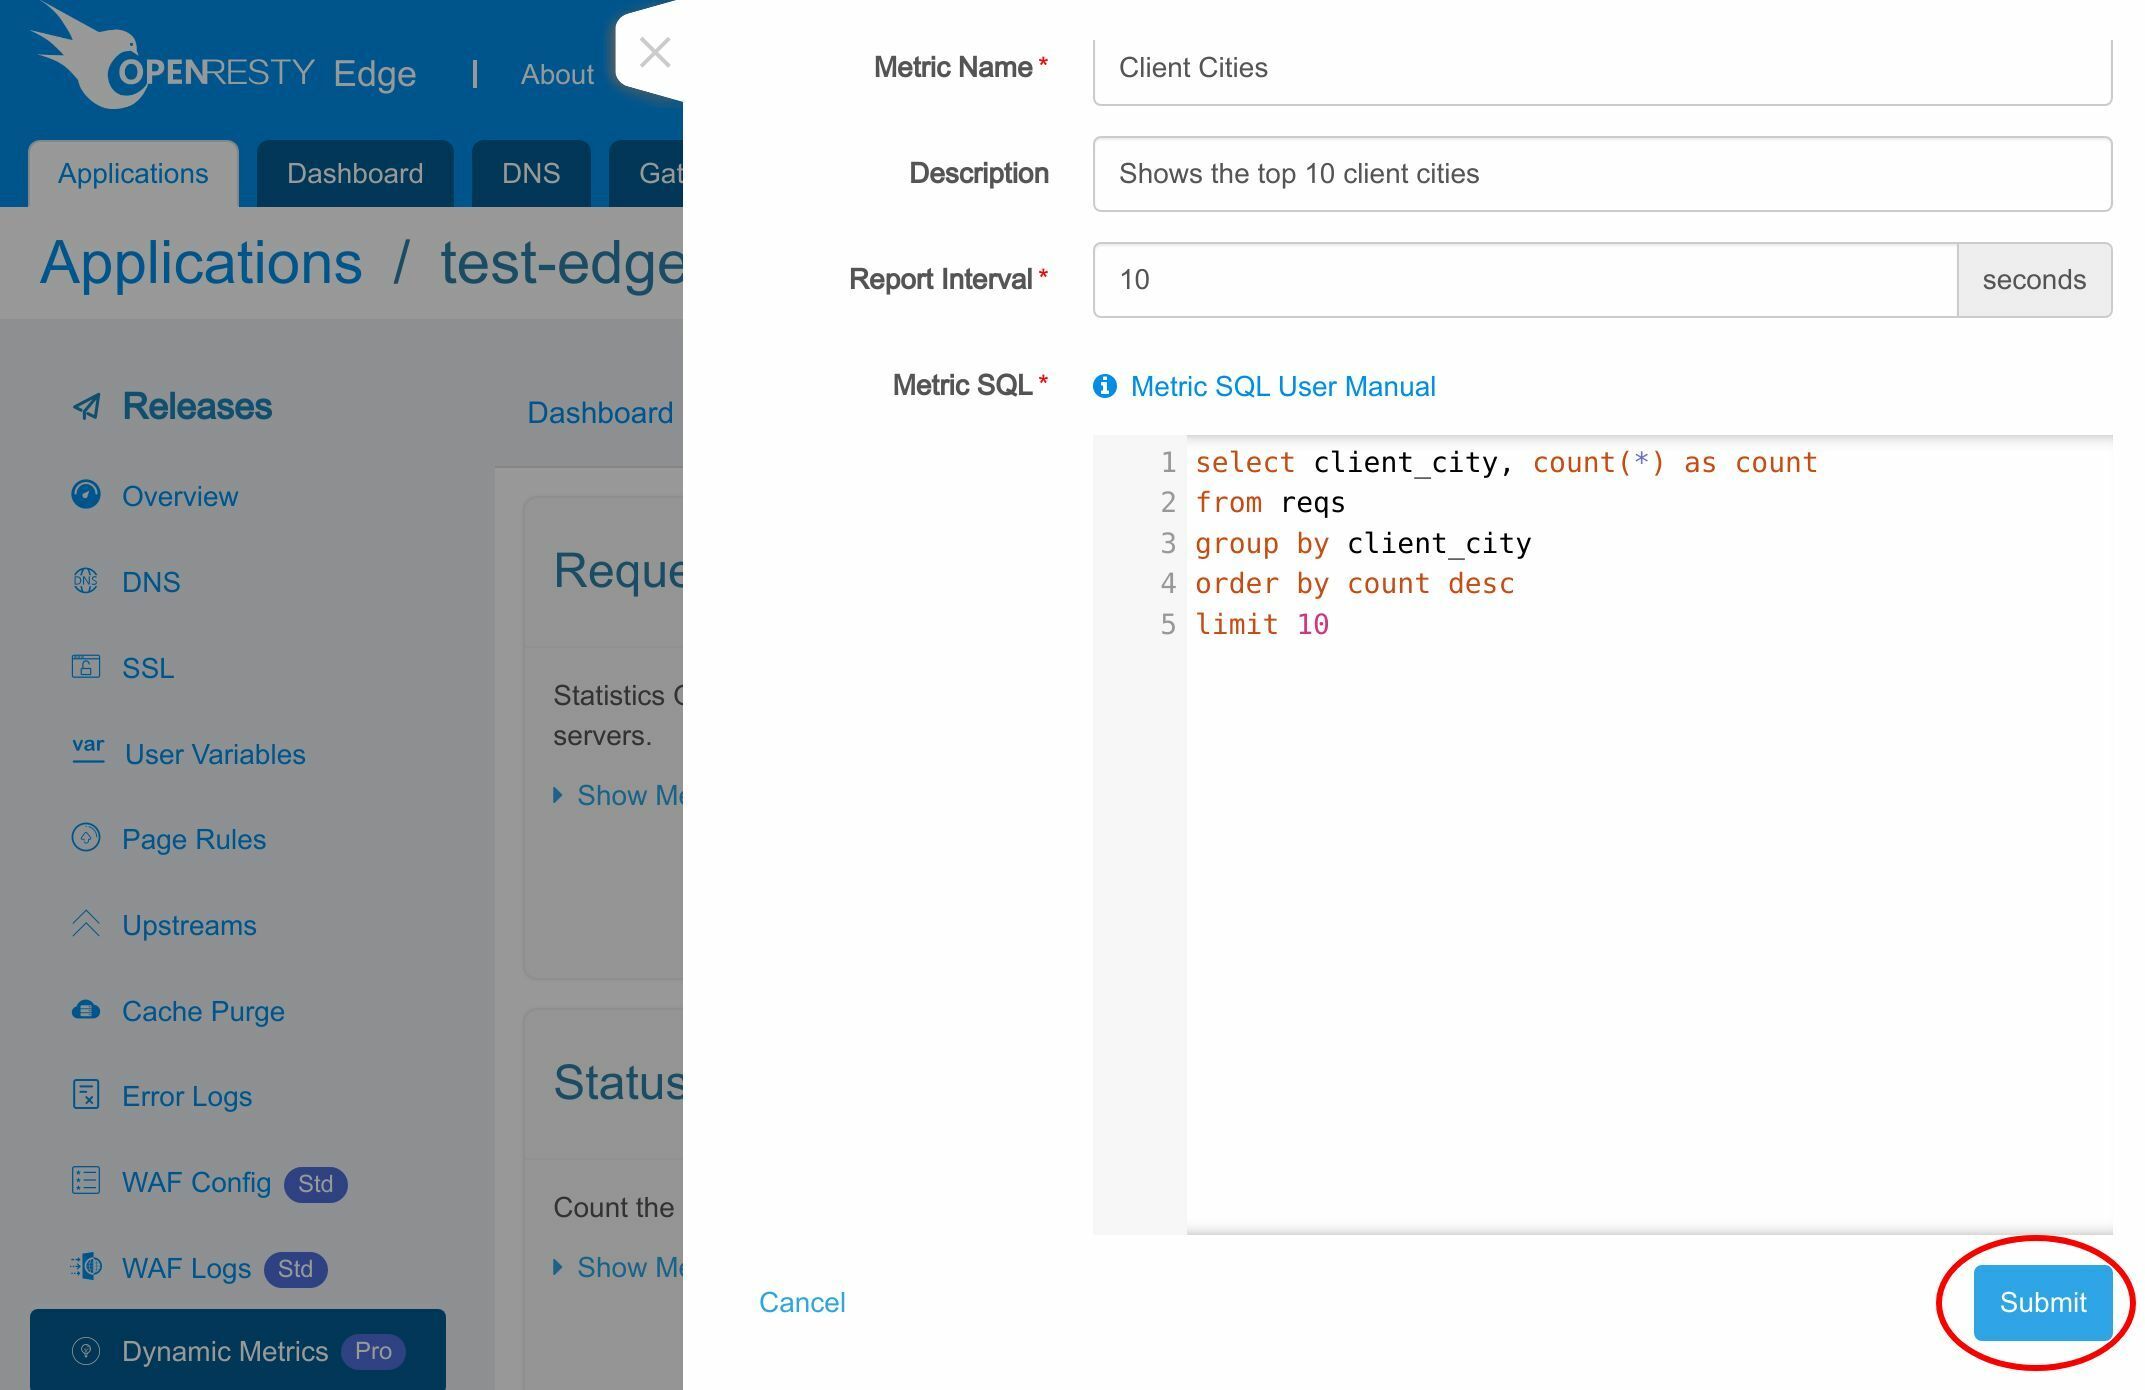
Click this button to create a new dynamic metric. This metric computes the top ten cities that send the most requests.

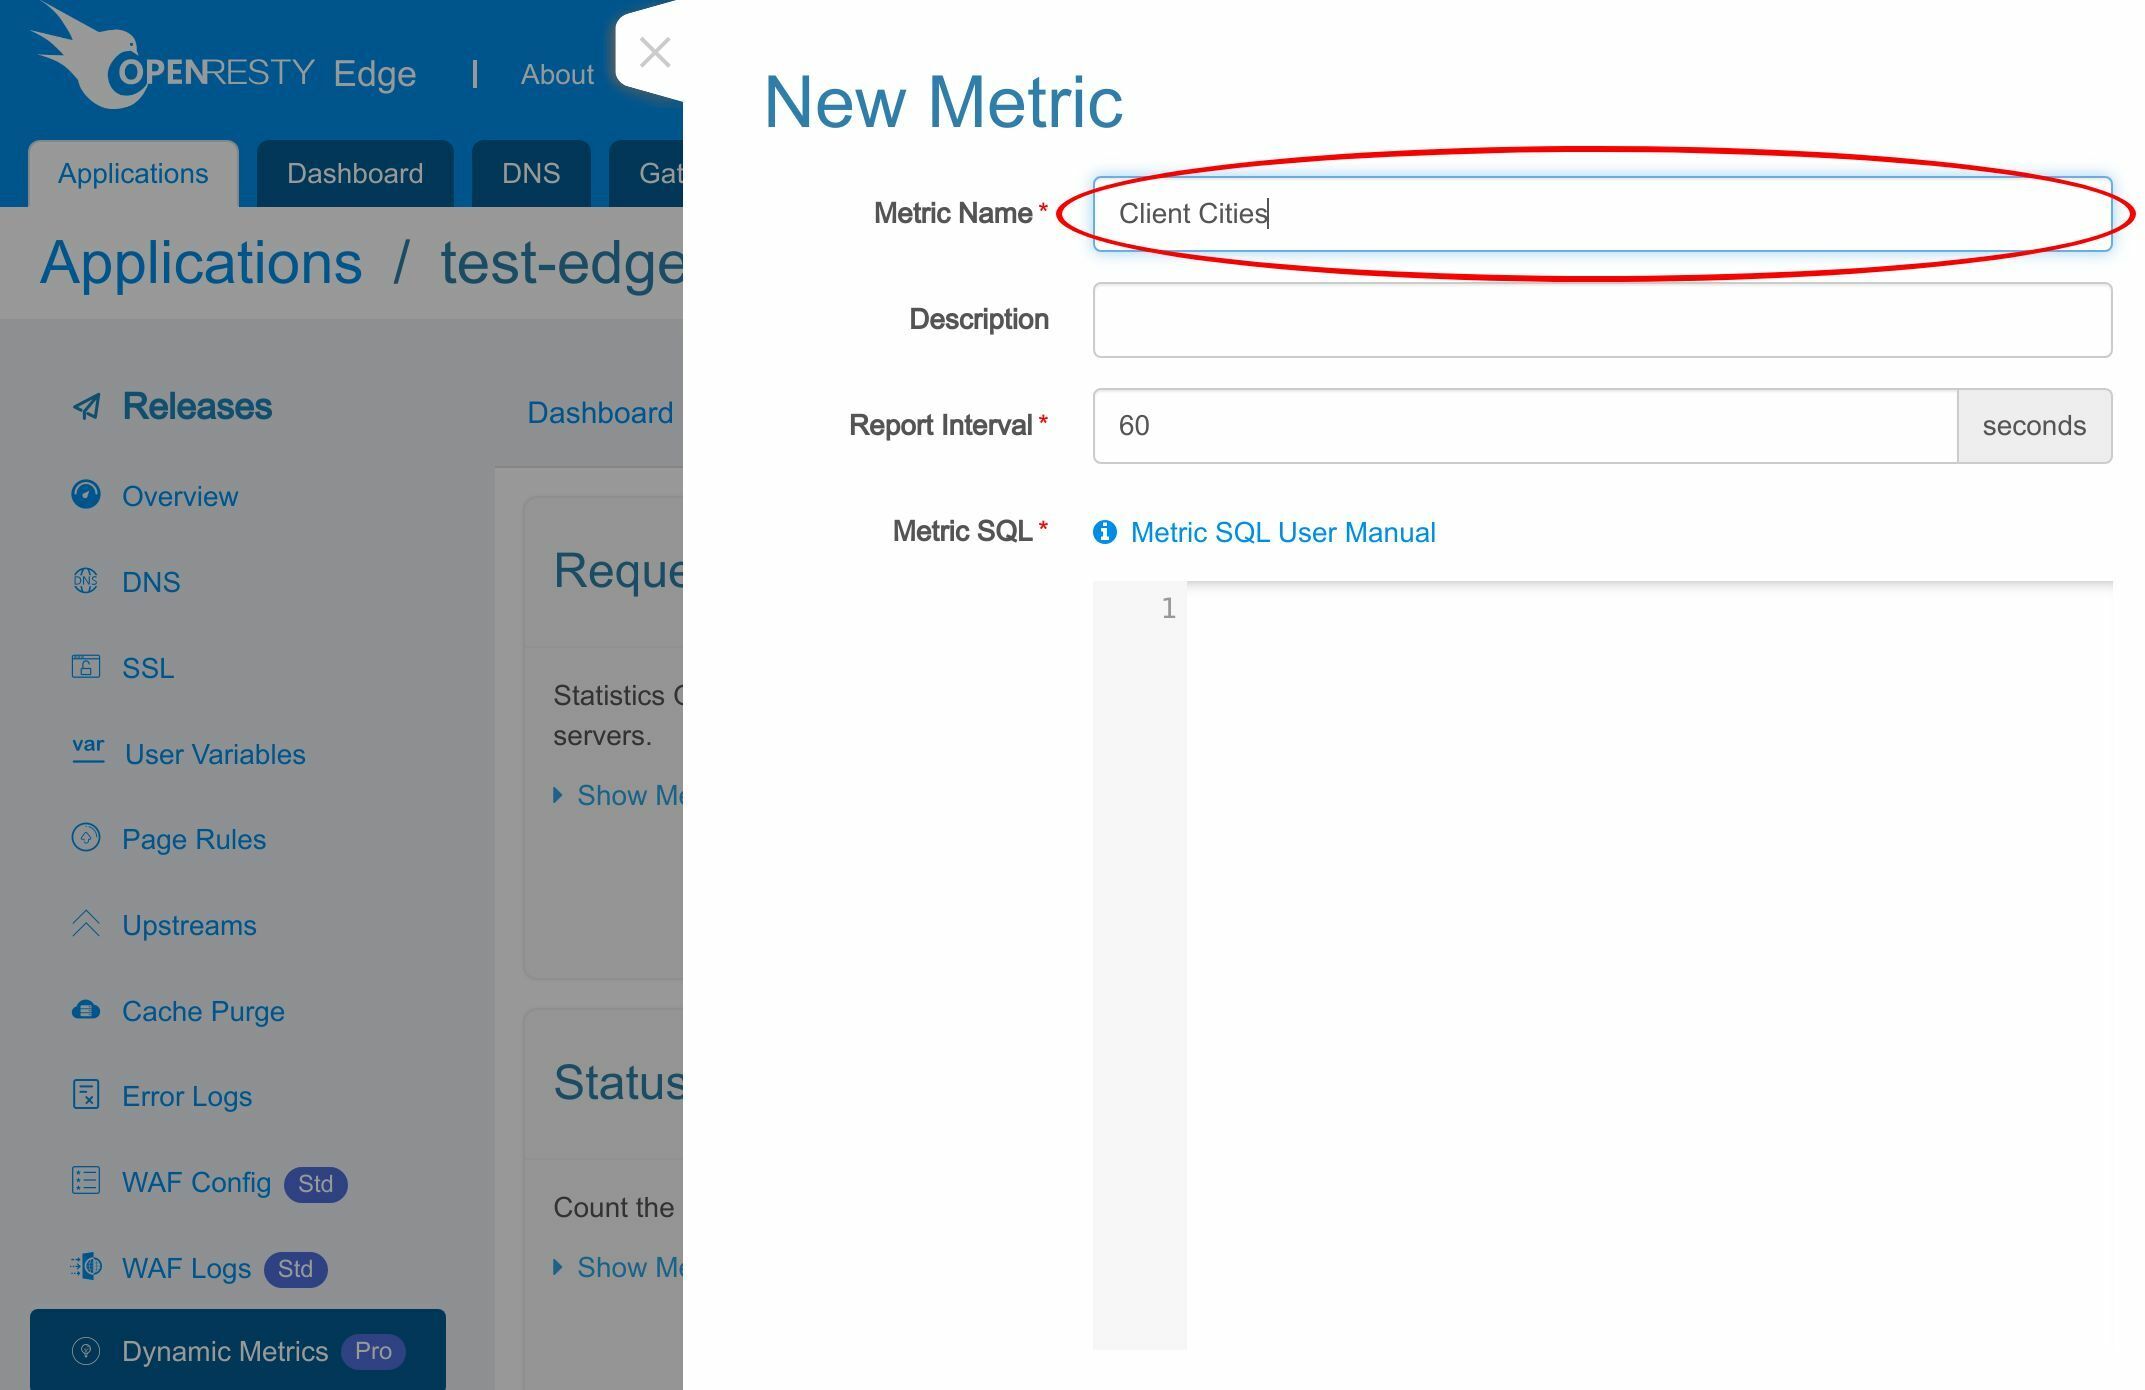
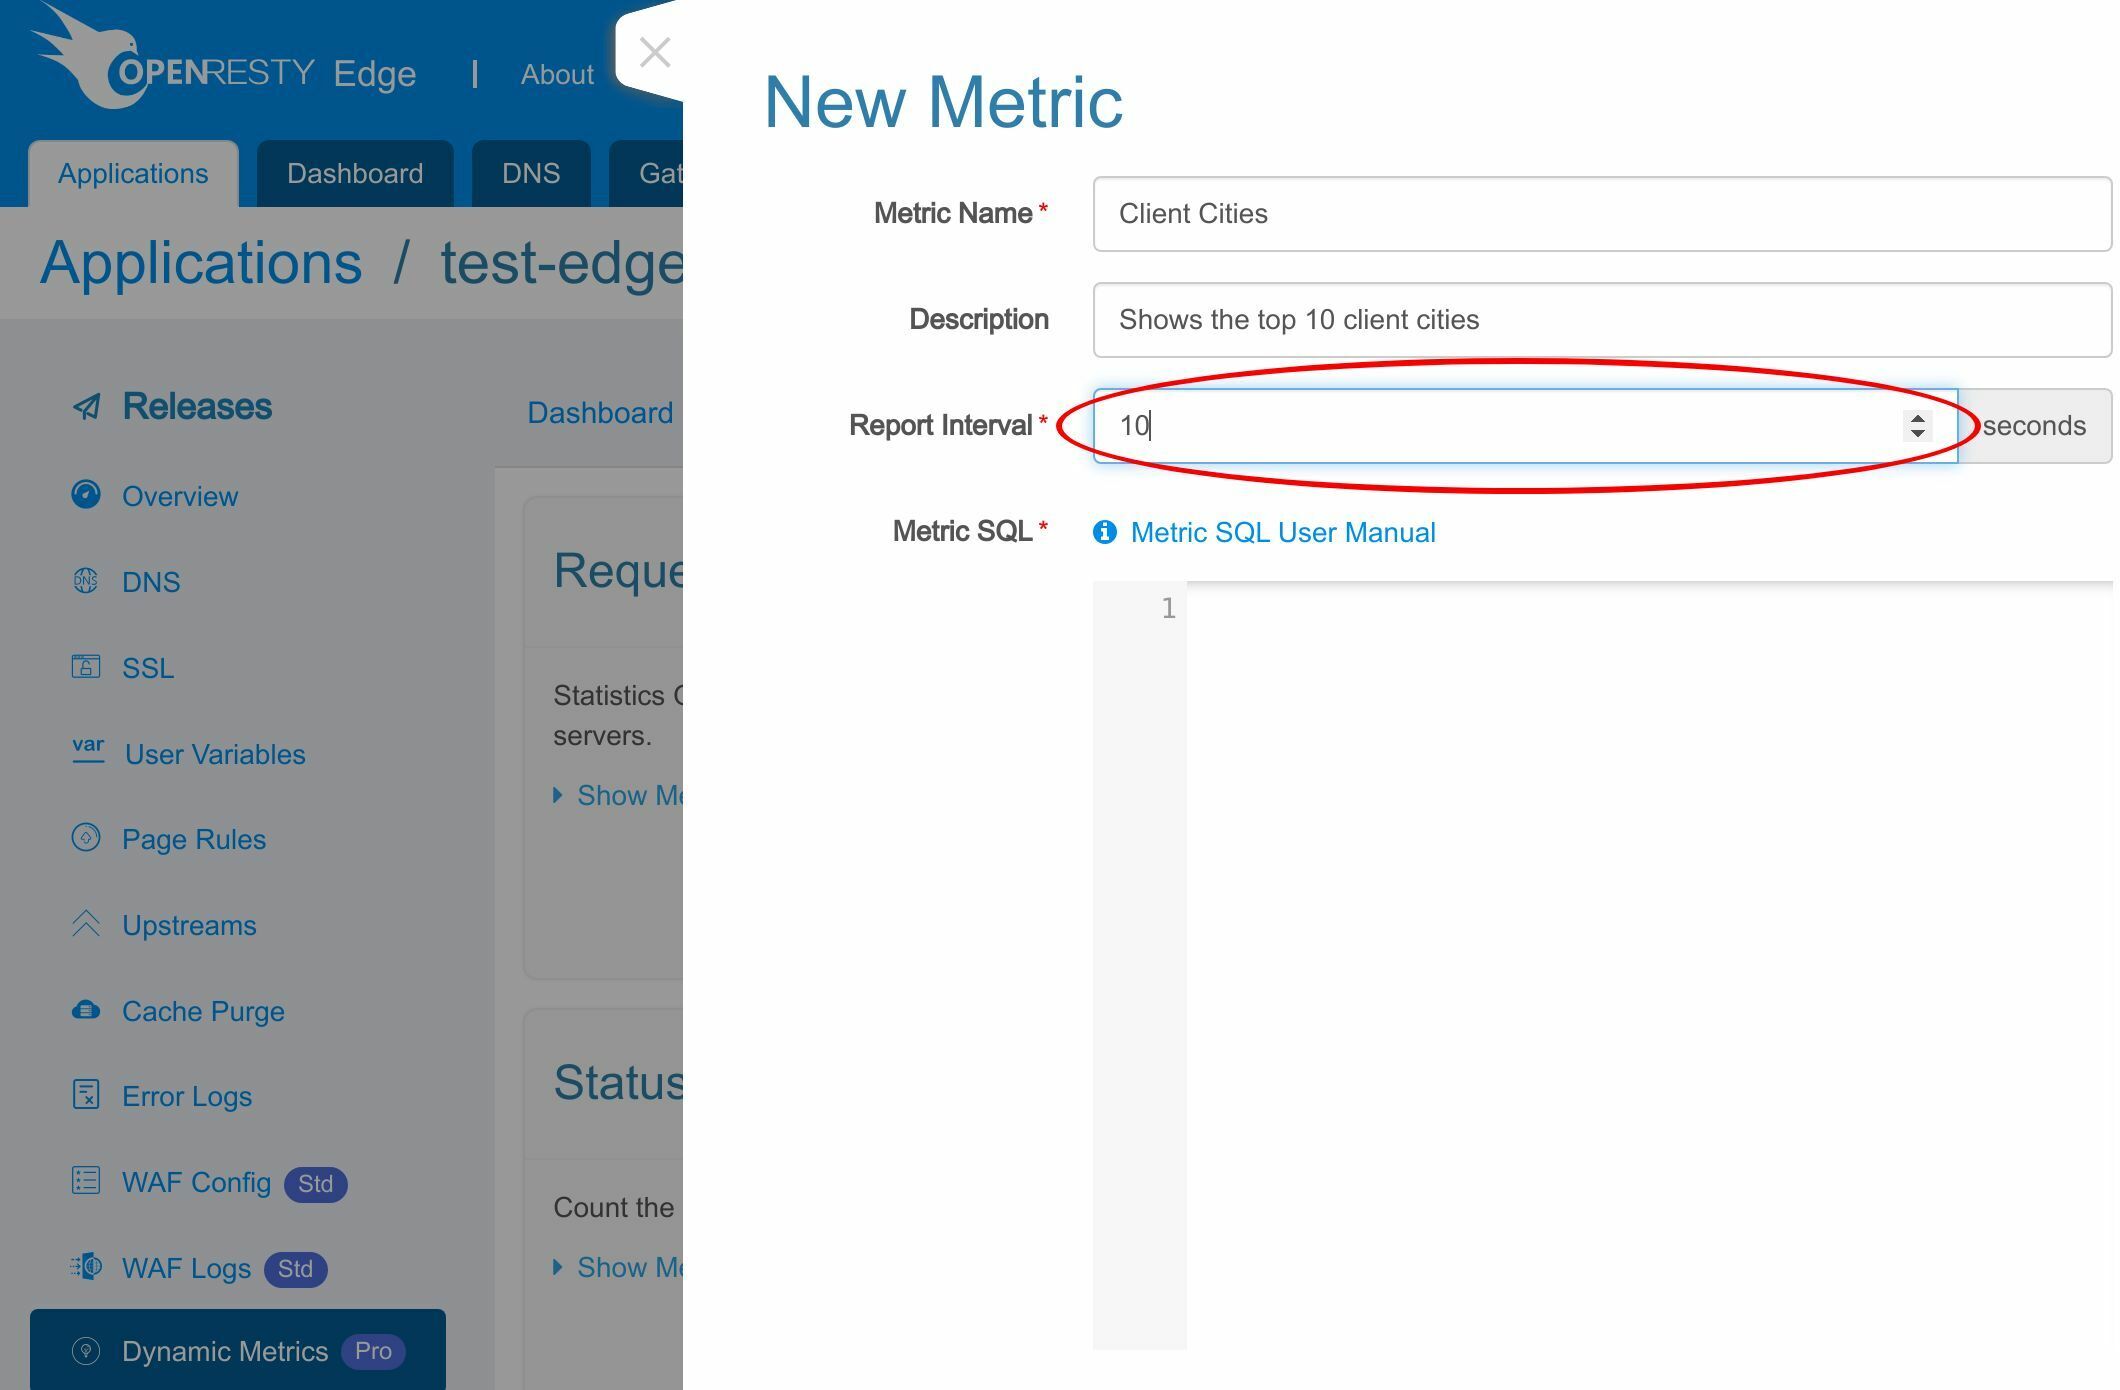
Enter a name for this metric: Client Cities.
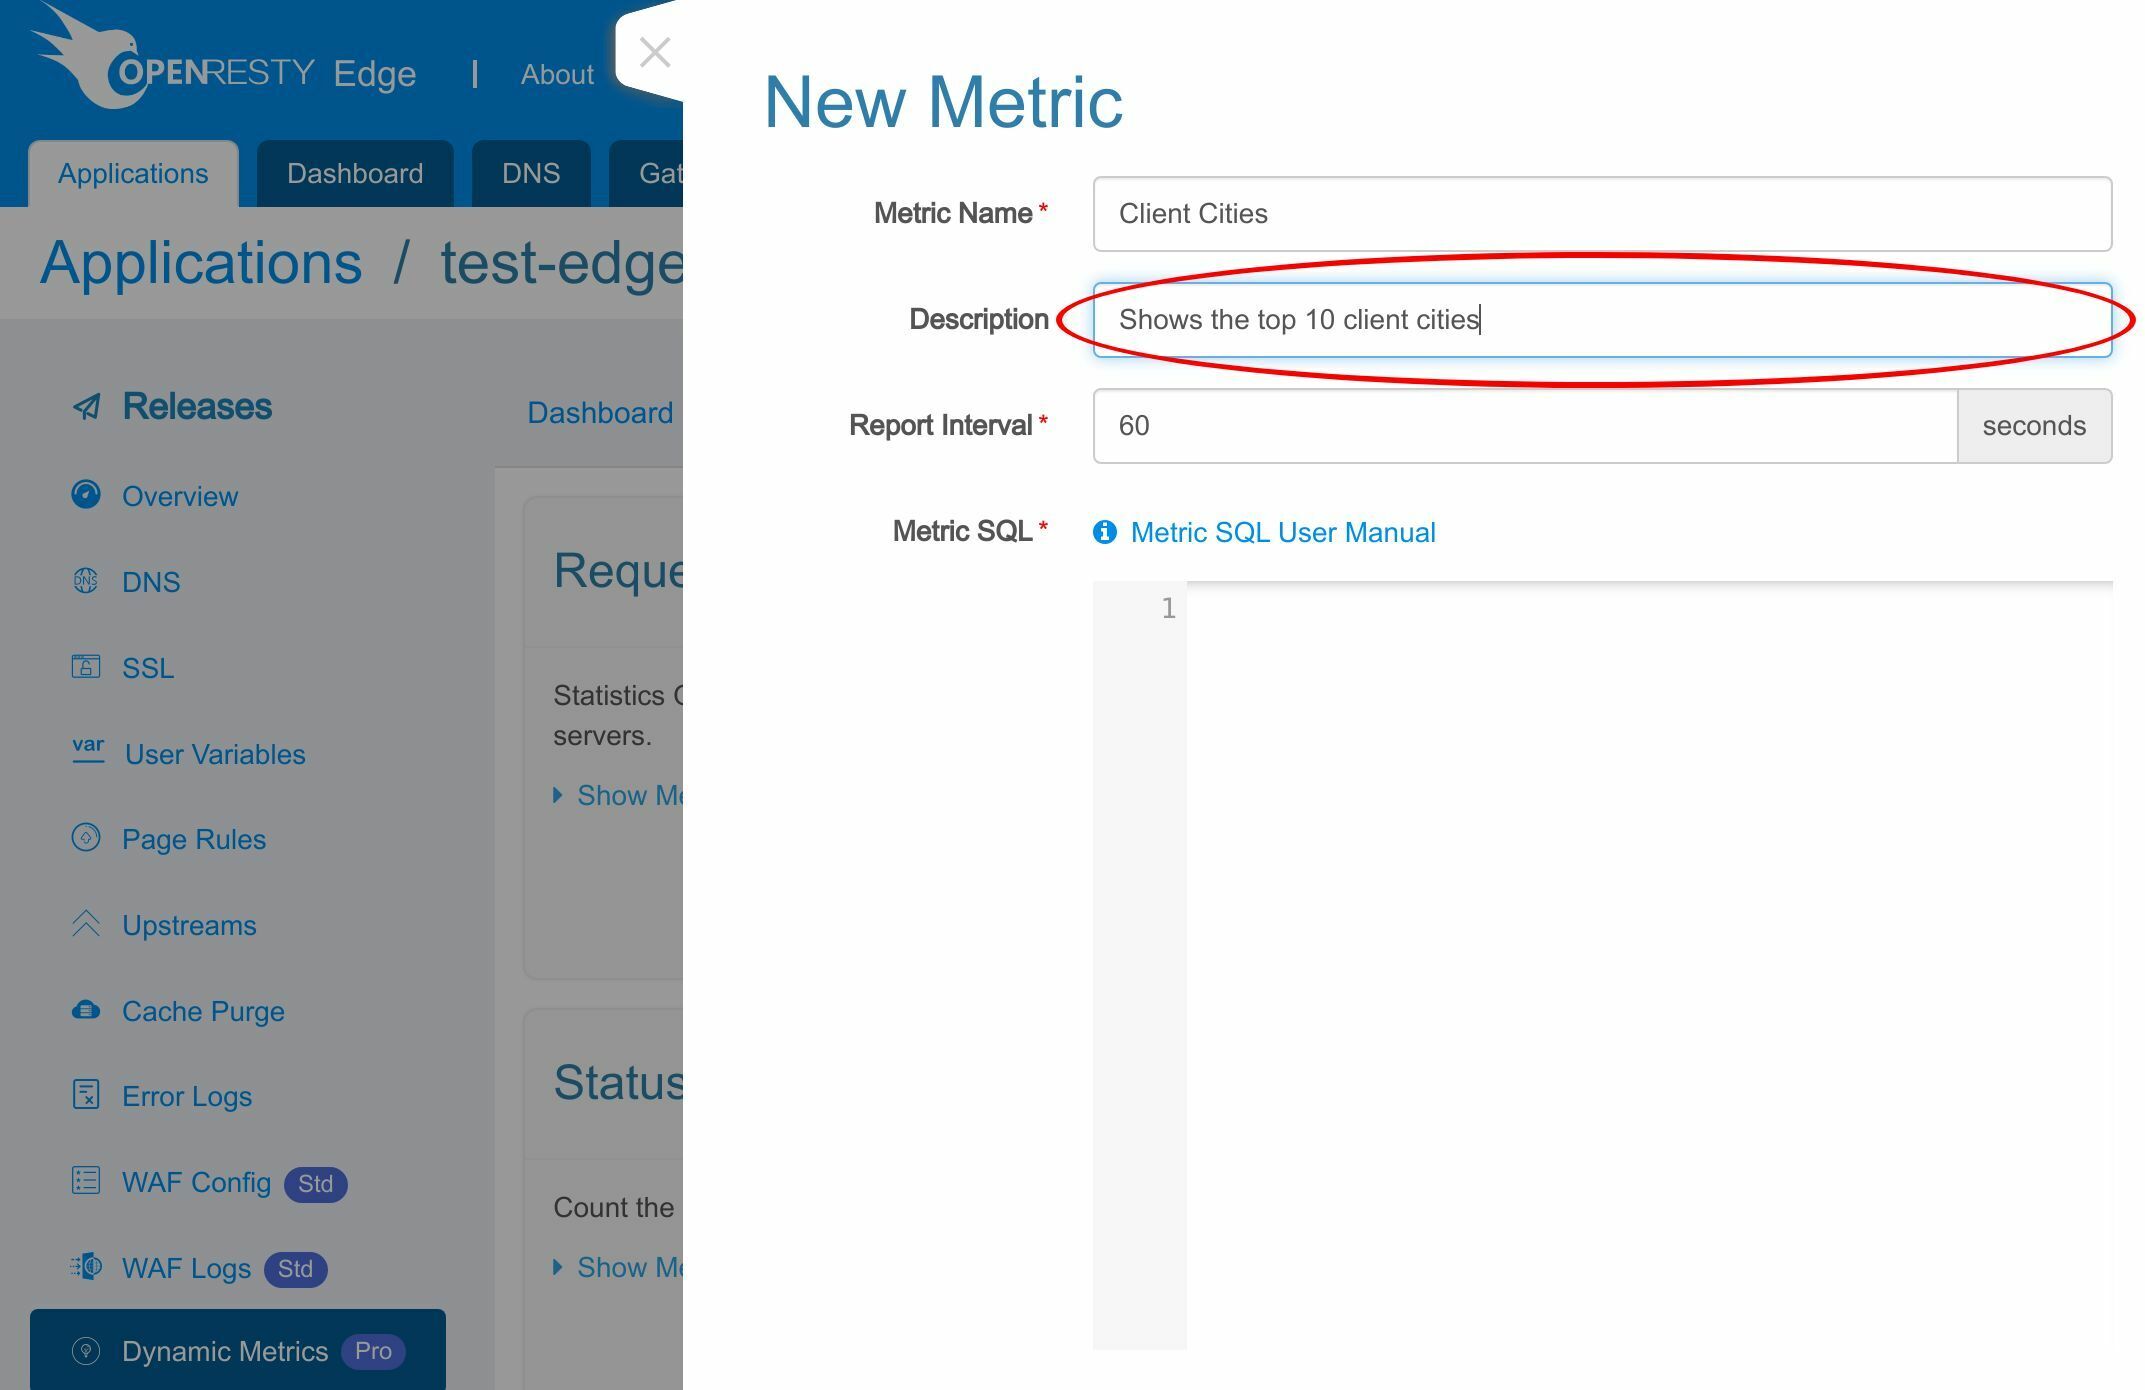
Add a description: Shows the top 10 client cities.
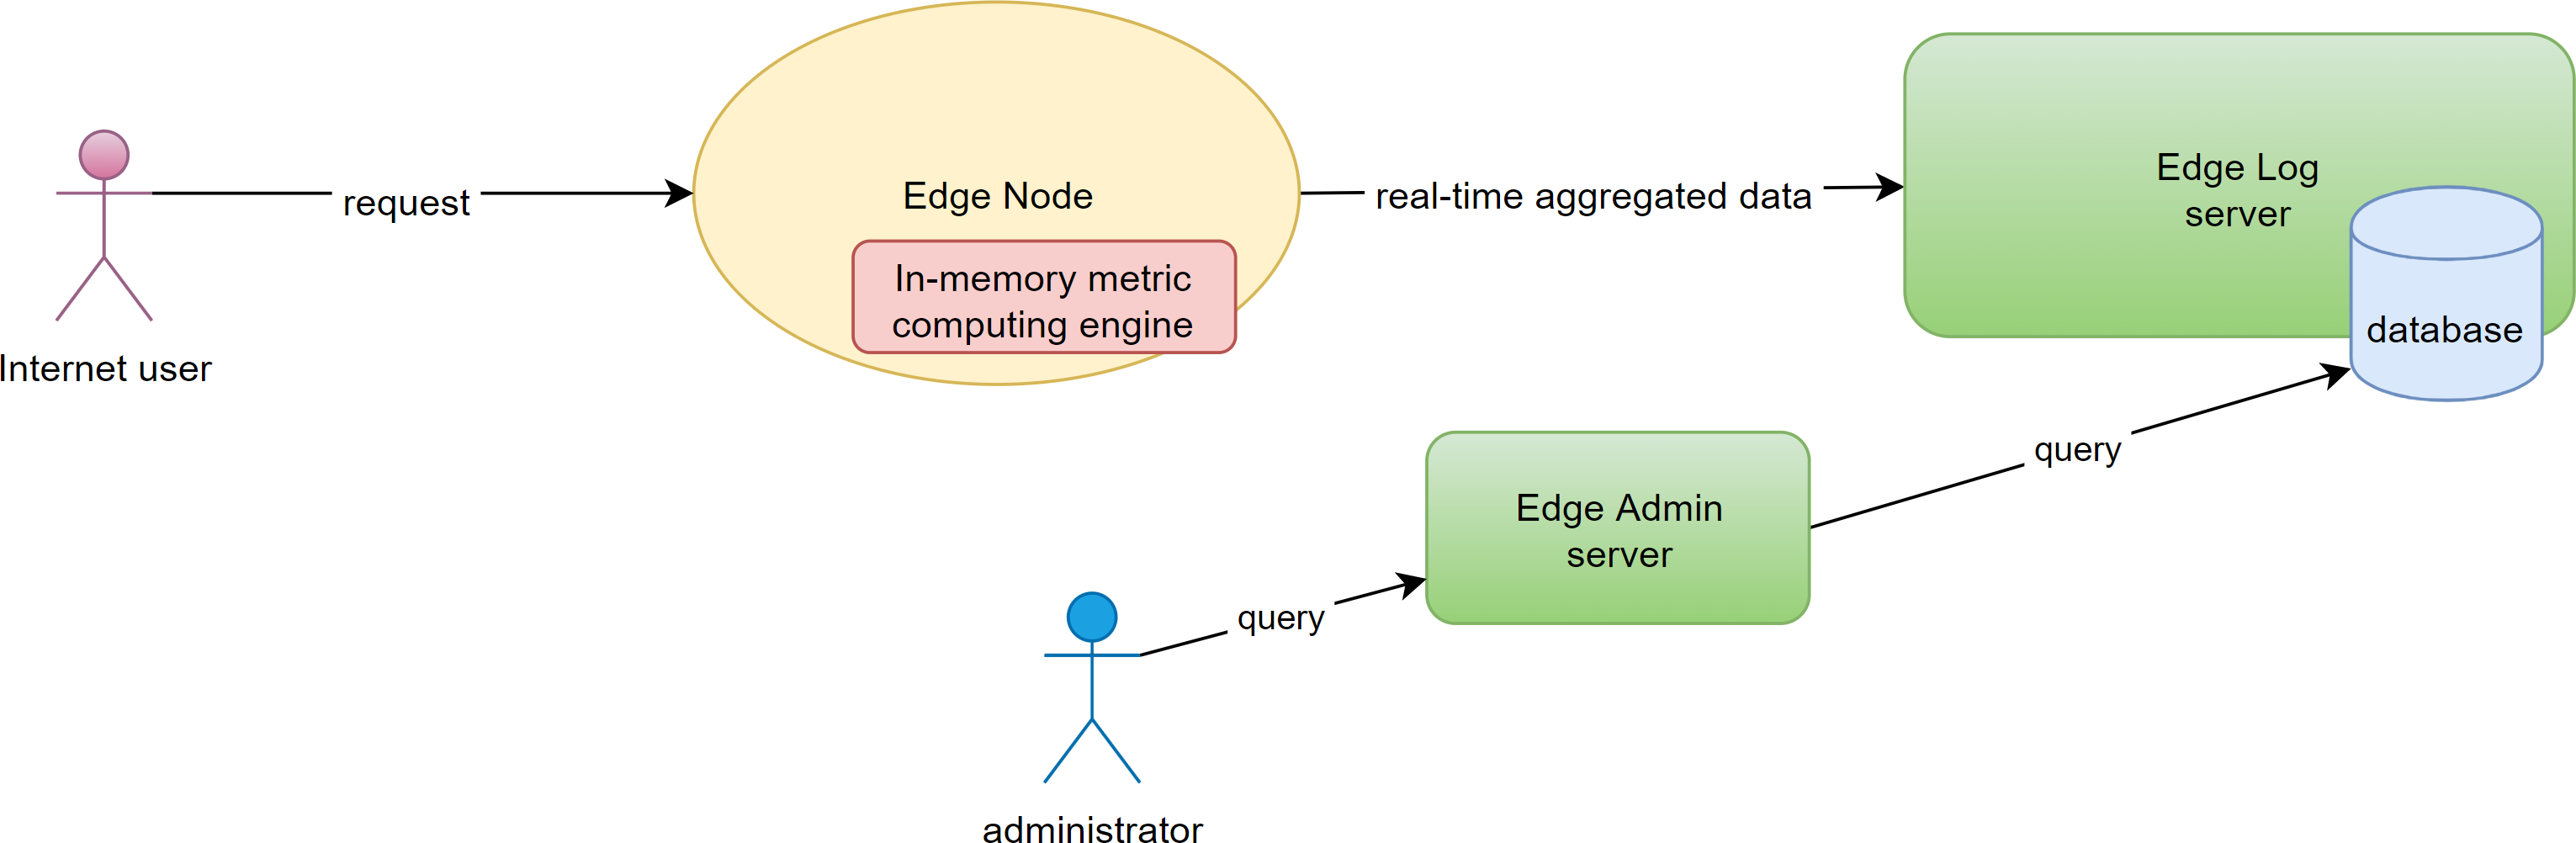
Specify the data reporting interval. It is the time period for reporting aggregated statistics from the memory of the gateway servers to the Edge Log Servers. The data then gets displayed in the Edge Admin console. Just for convenience, we use 10 seconds here. Such short reporting intervals have a relatively high overhead though.
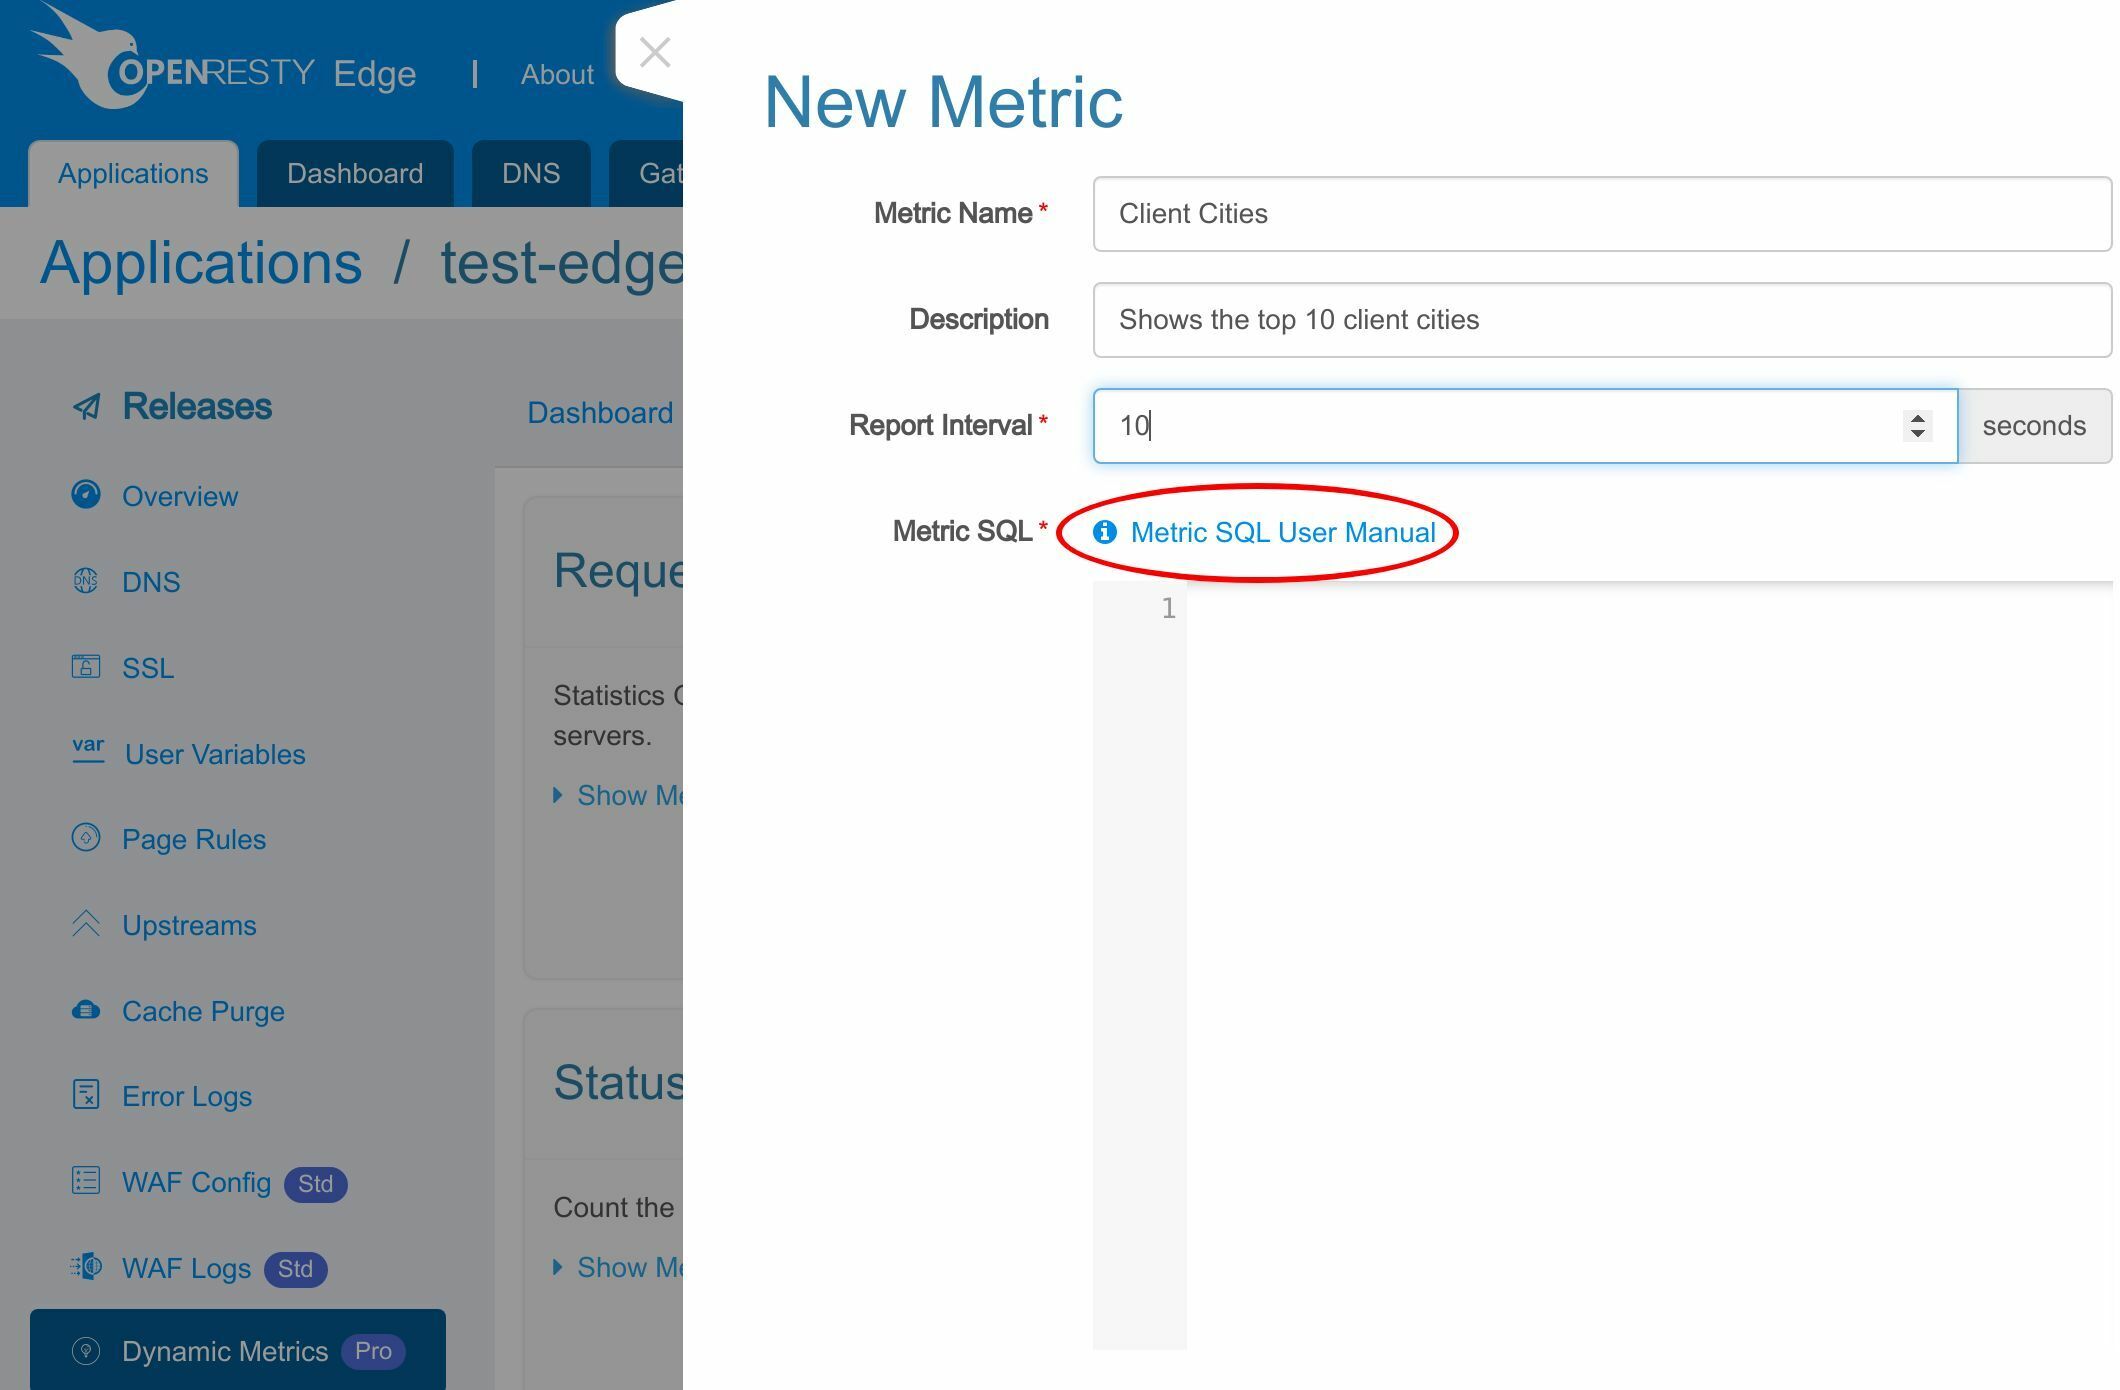
We use the Metric SQL language provided by the Edge product. It uses the popular SQL language syntax.
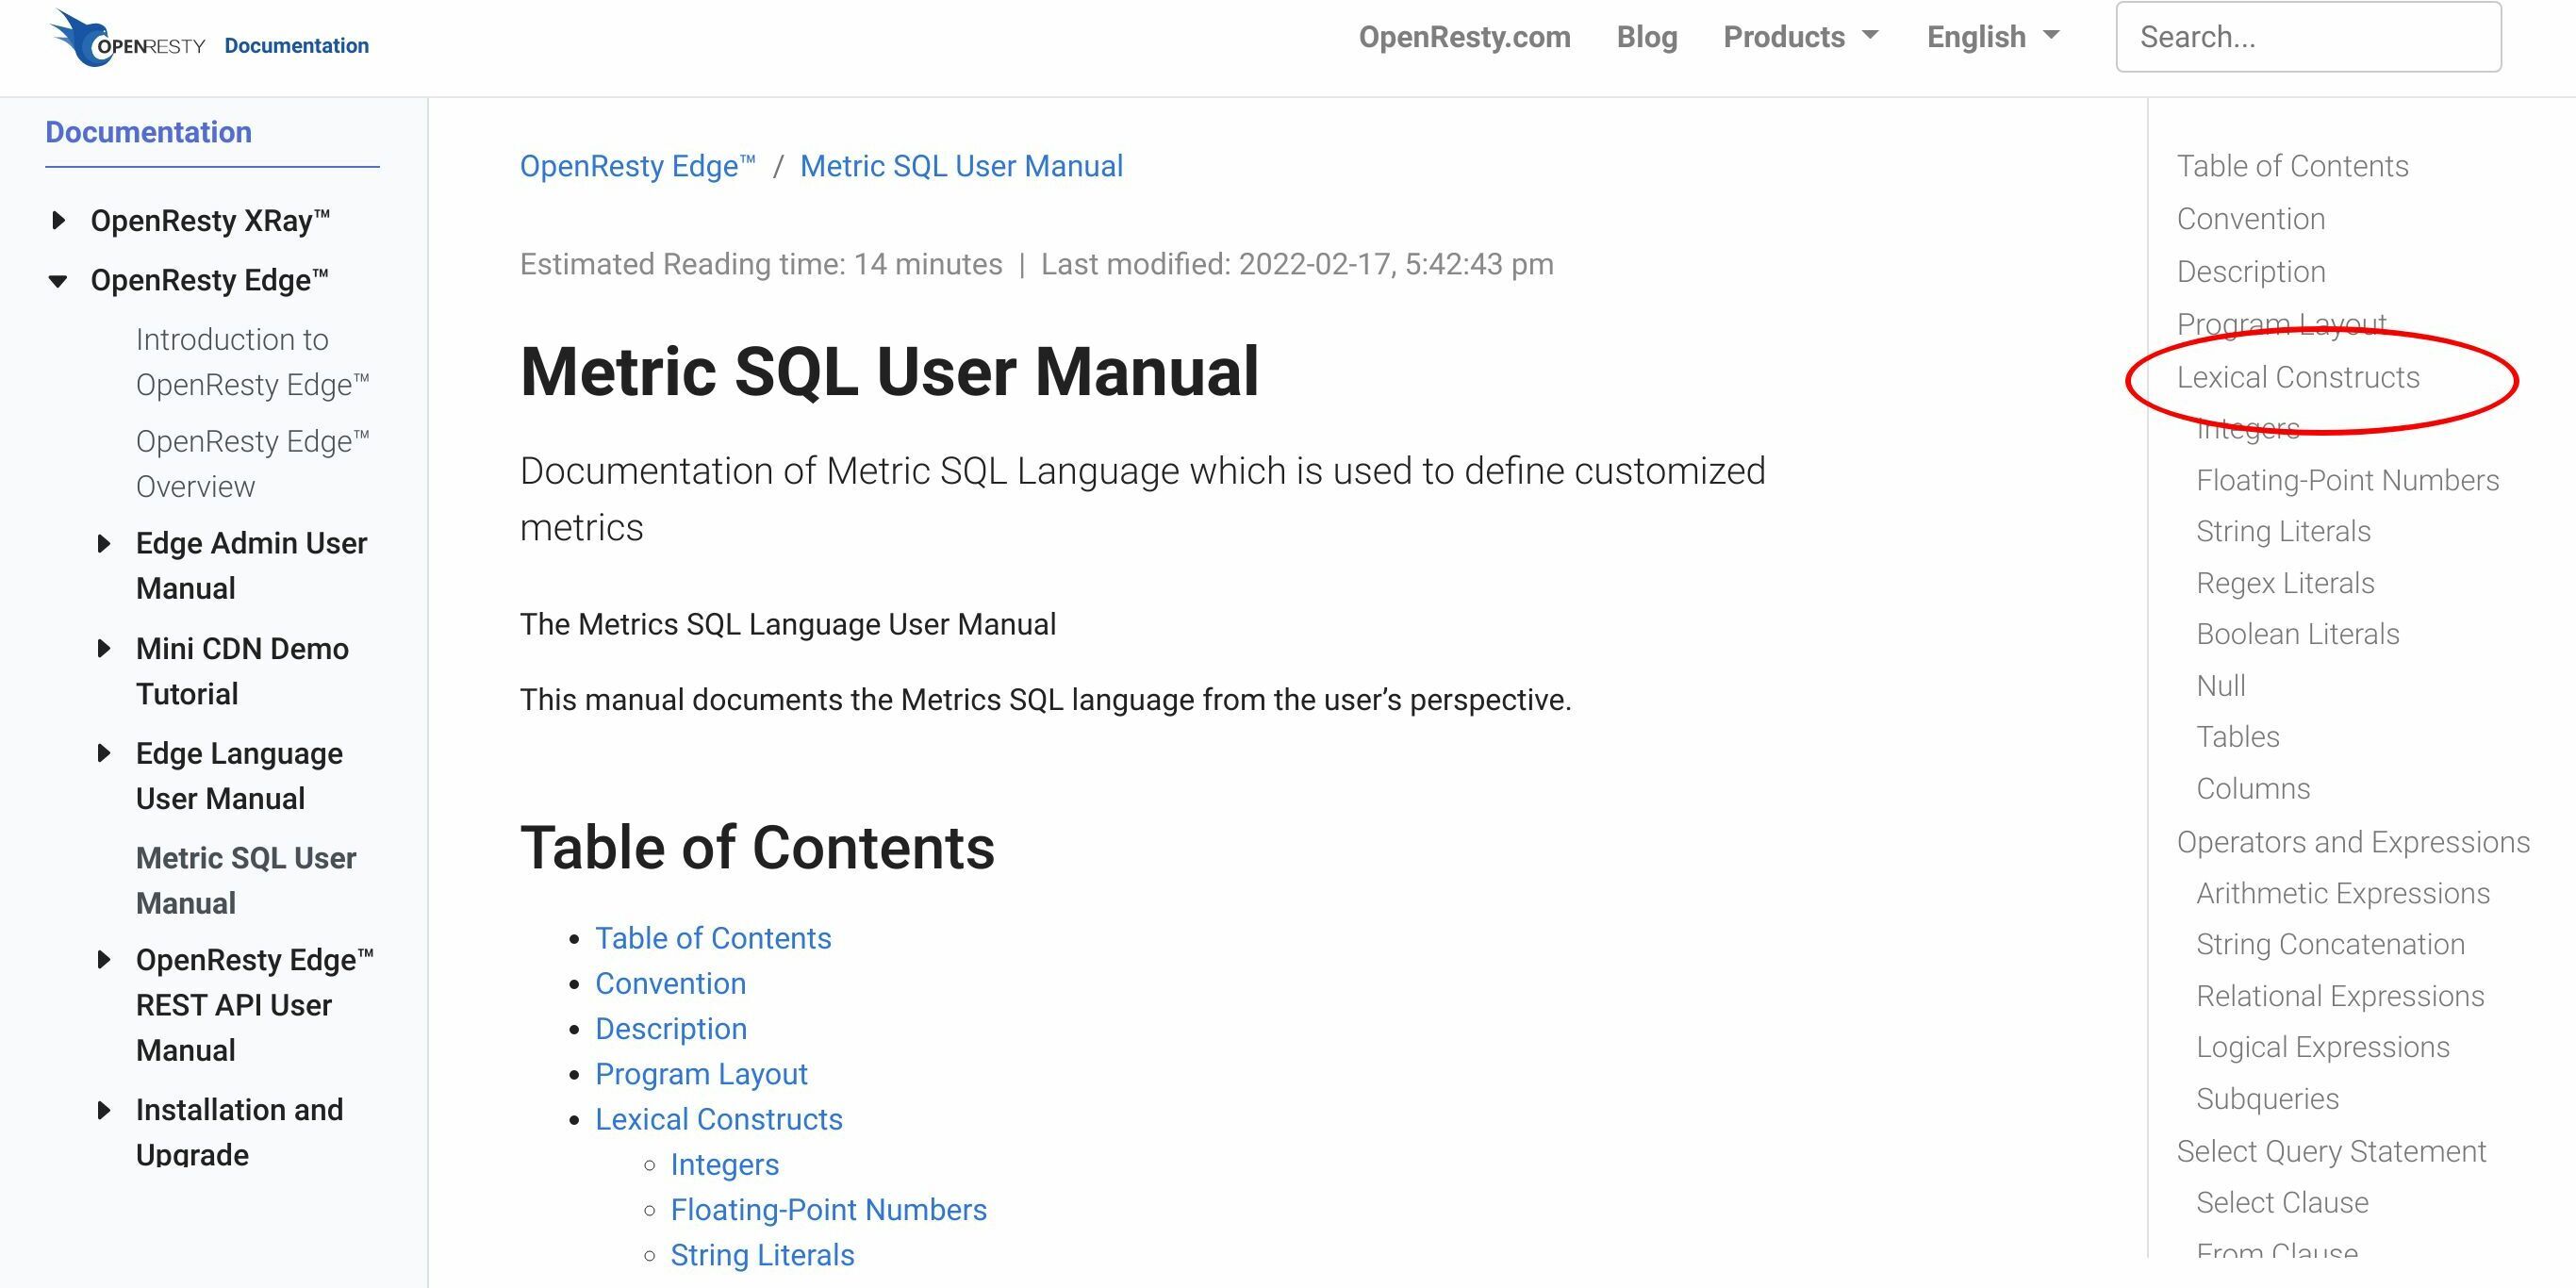
You can find the full user manual on our documentation site.
You will find a detailed description of this language, from Lexical Constructs, to Operators and Expressions, and the Select Query Statement.
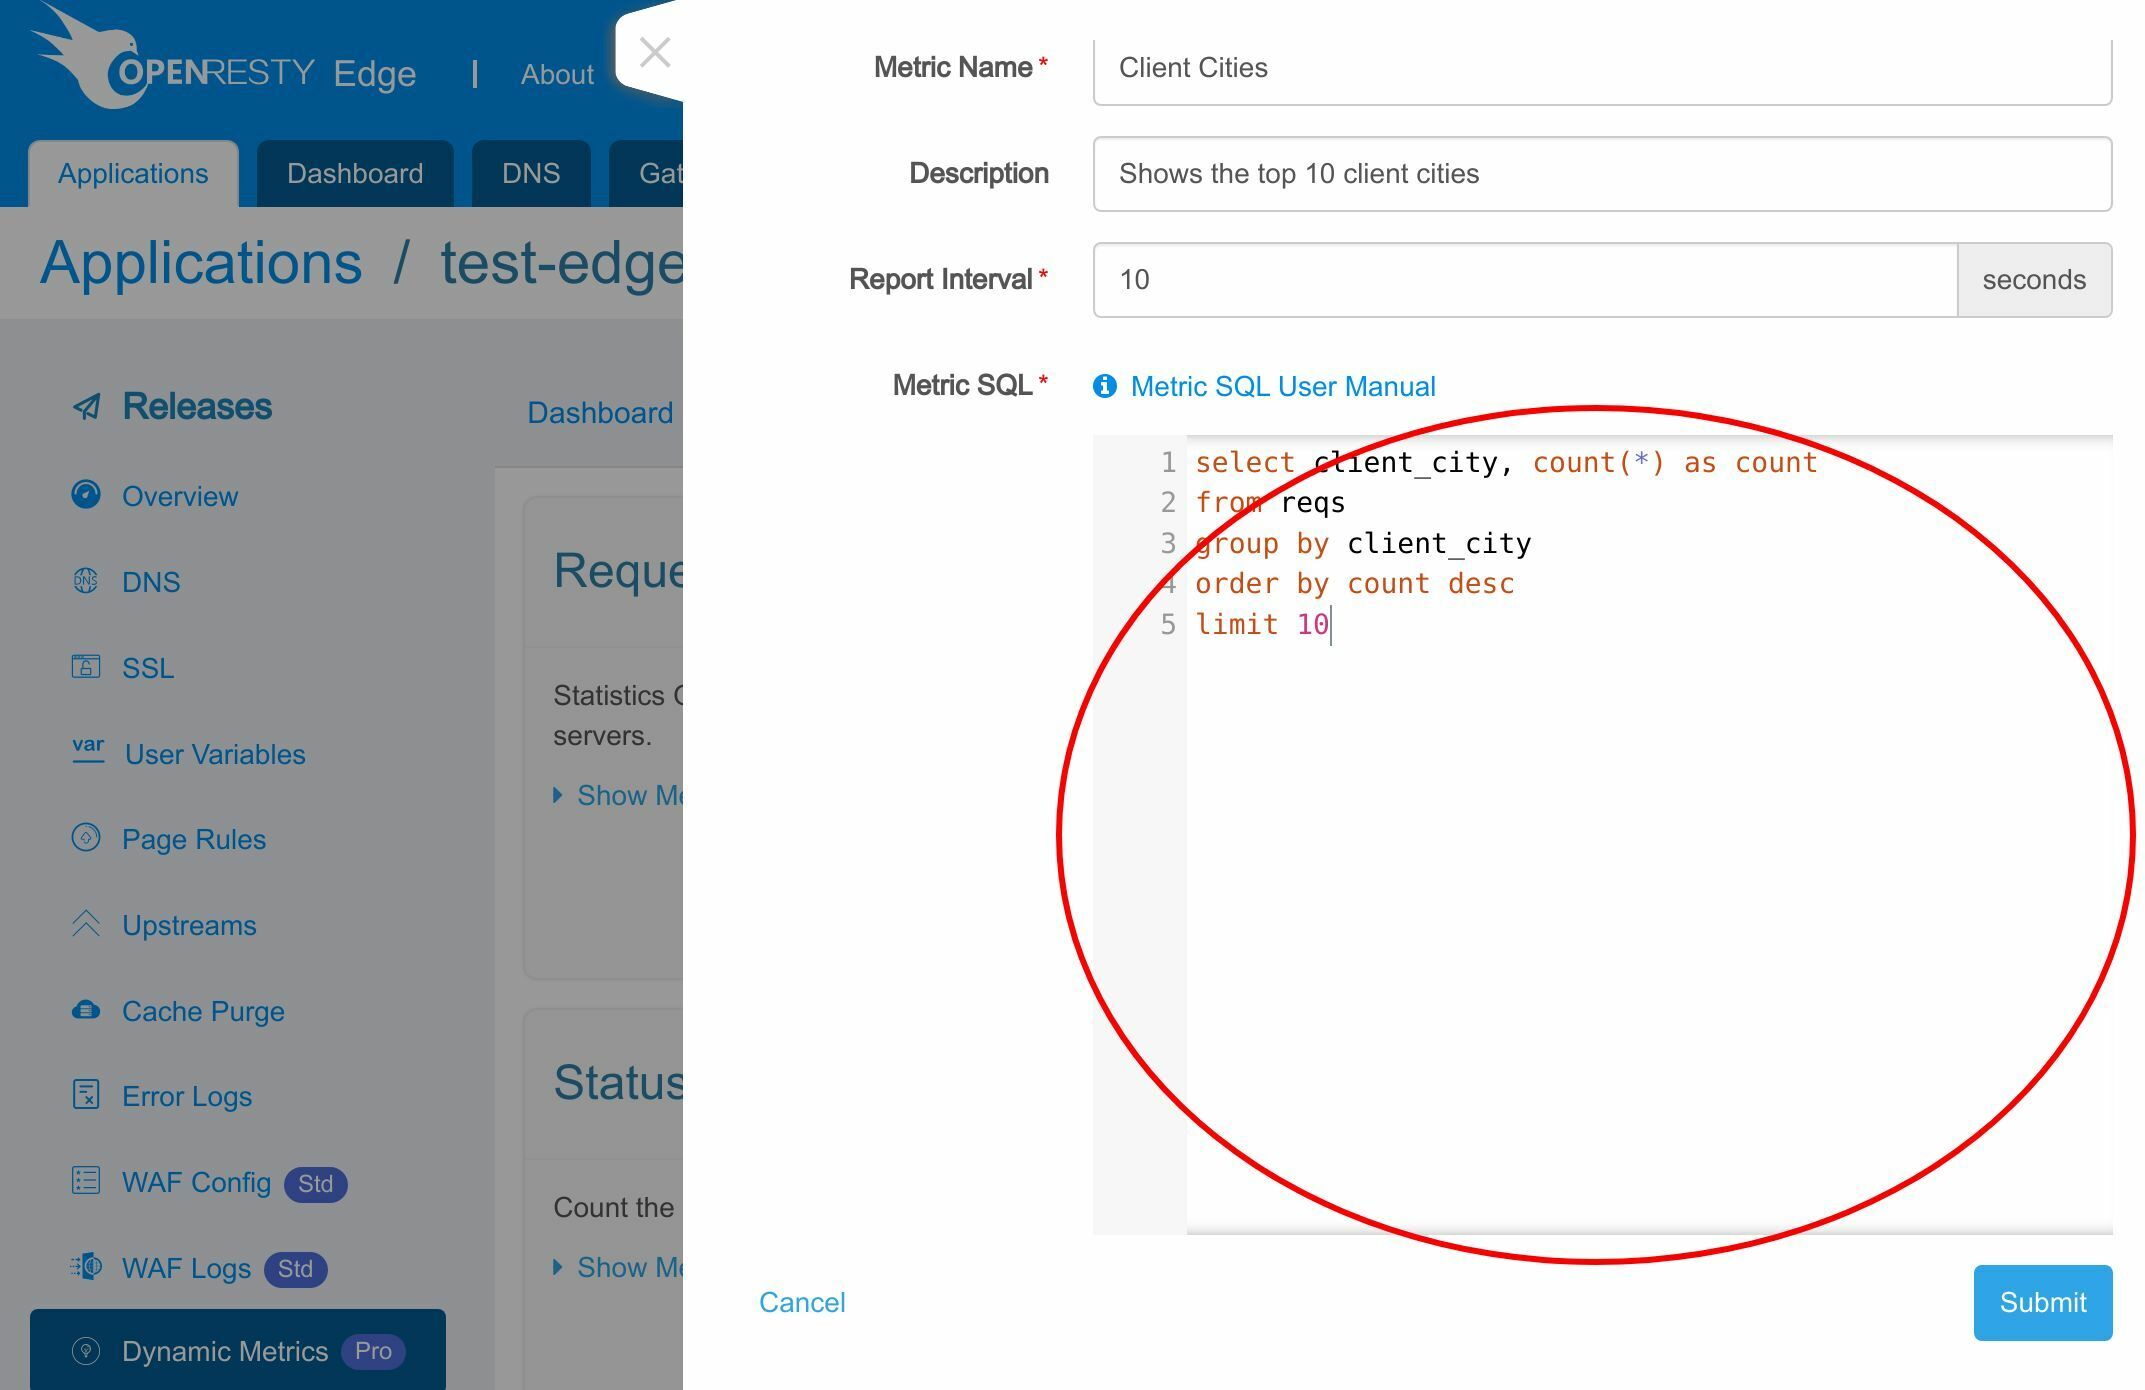
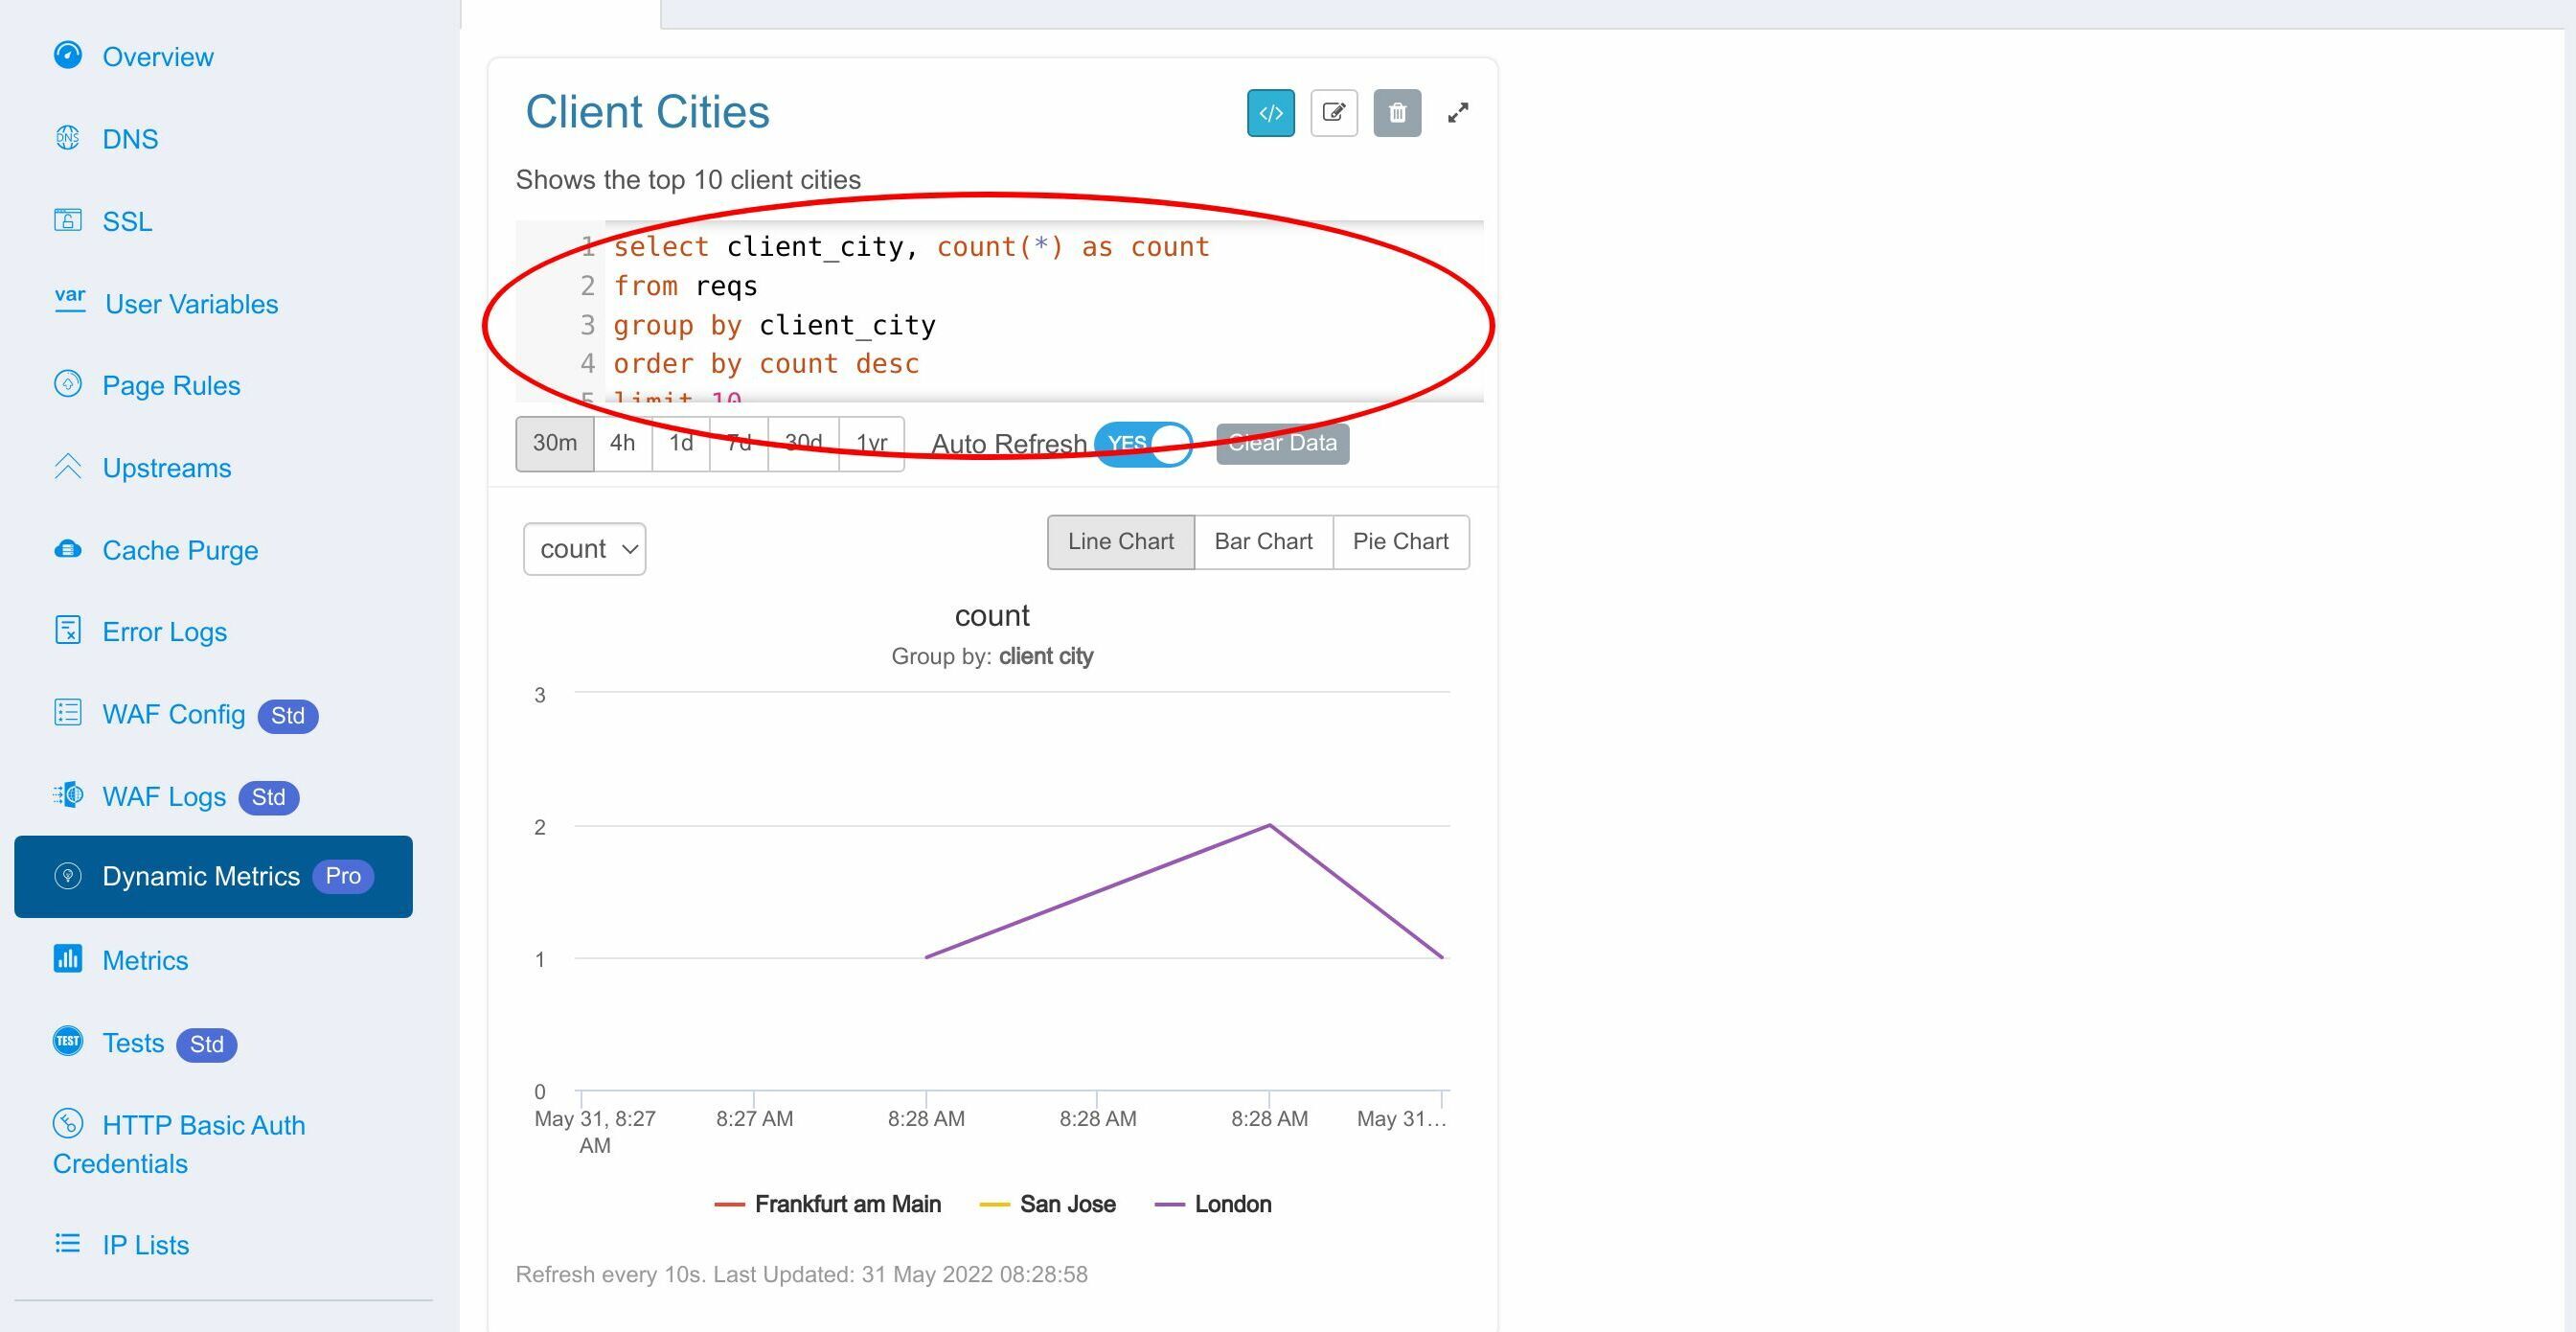
We type in the Metric SQL statement for this metric. We select client cities, from all requests, grouping by cities that send requests, sorting cities in descending order. And we only keep the top 10 cities.
select client_city, count(*) as count
from reqs
group by client_city
order by count desc
limit 10
Save this metric.
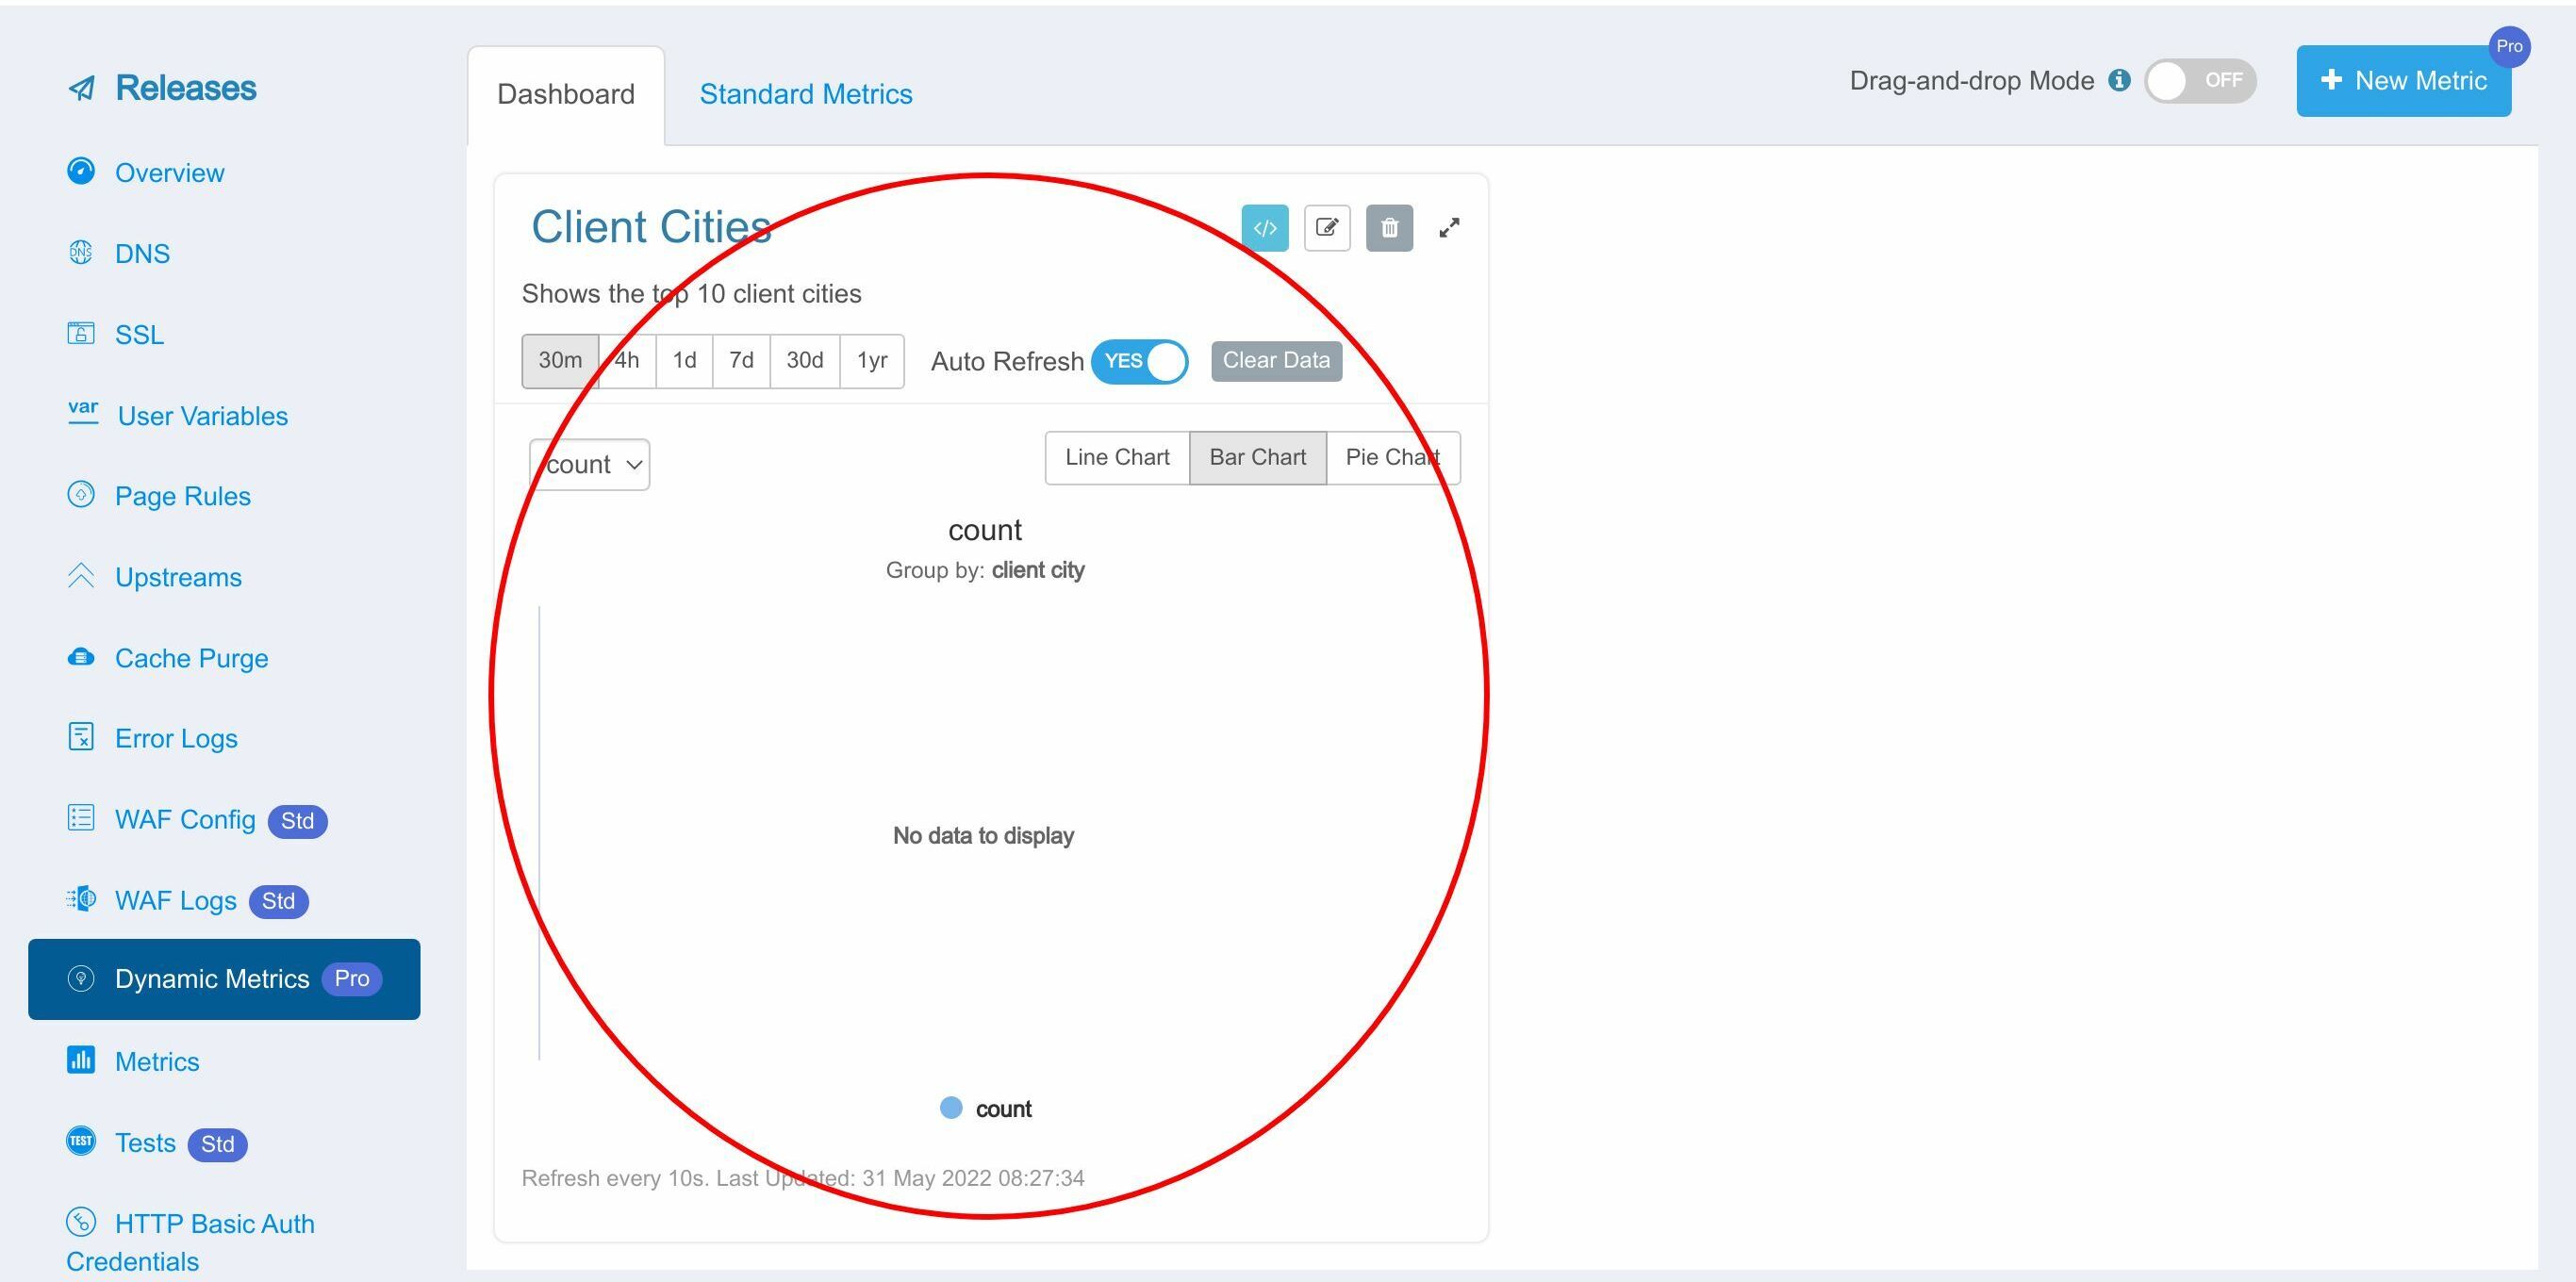
This metric is saved correctly.
Test
New dynamic metrics take effect immediately and do not require separate configuration releases. Now let’s send requests and see how it works.
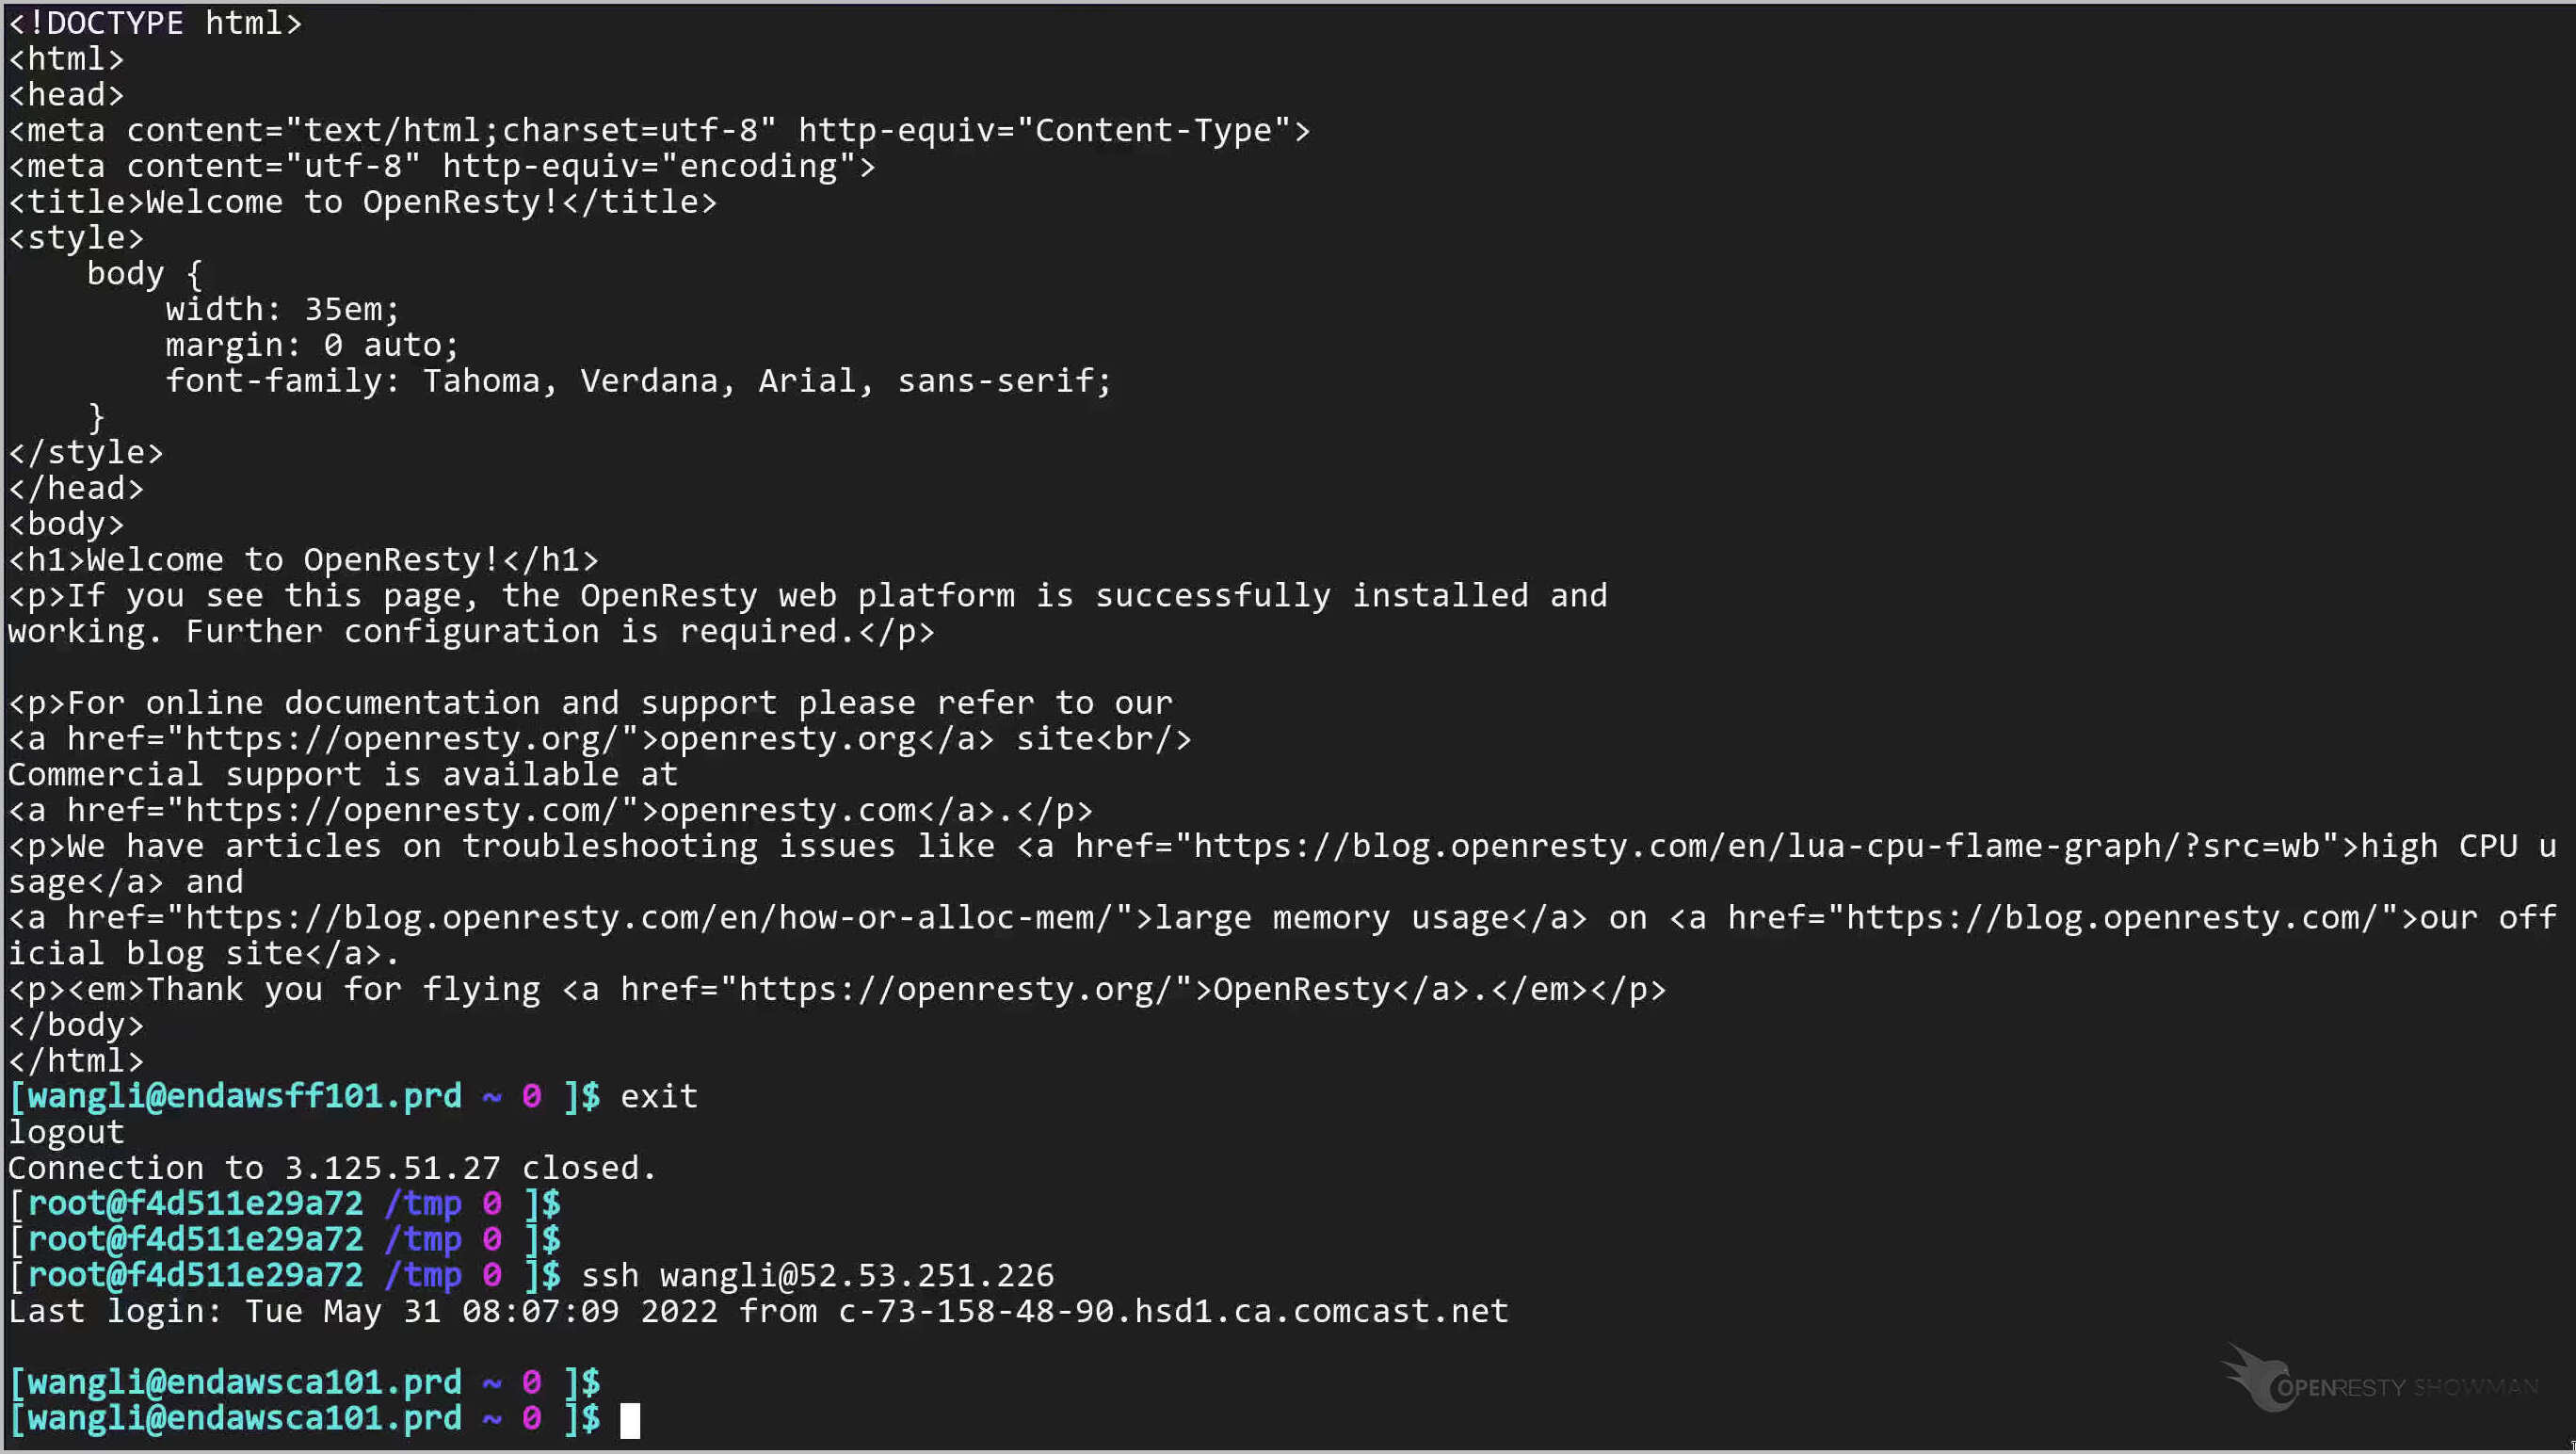
On the terminal, we log onto a remote server in the Frankfurt city of Germany.
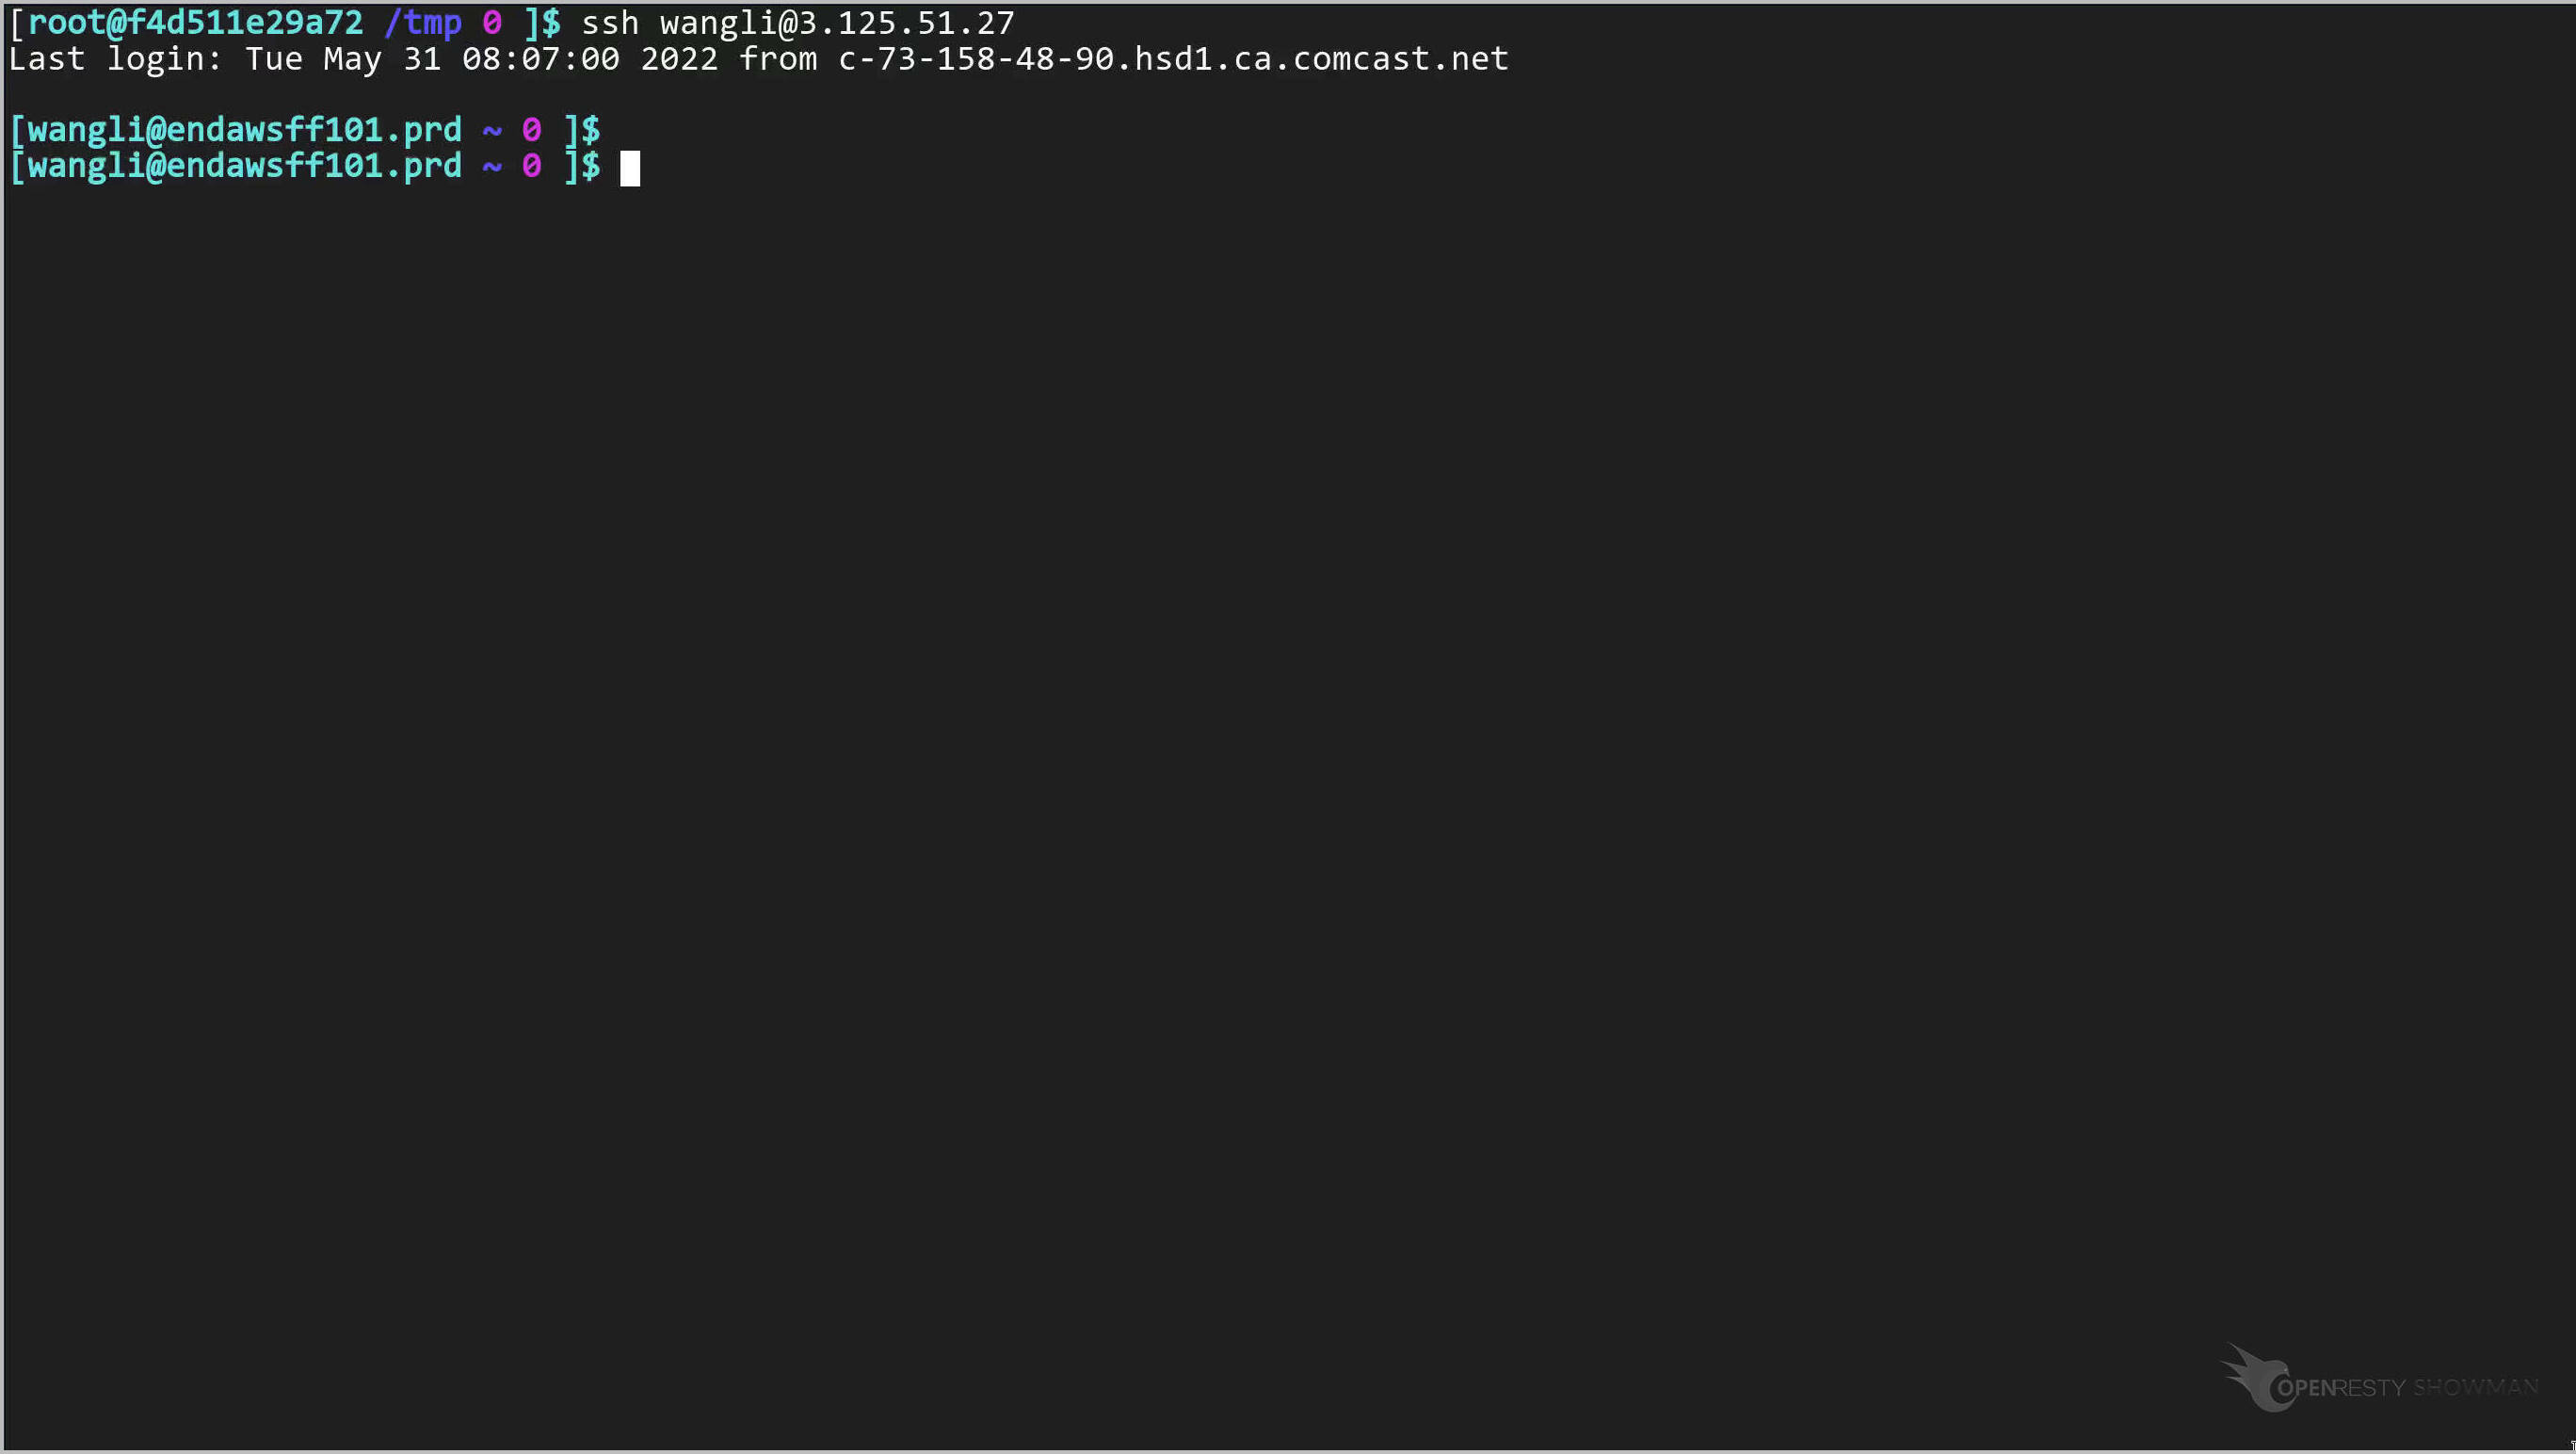
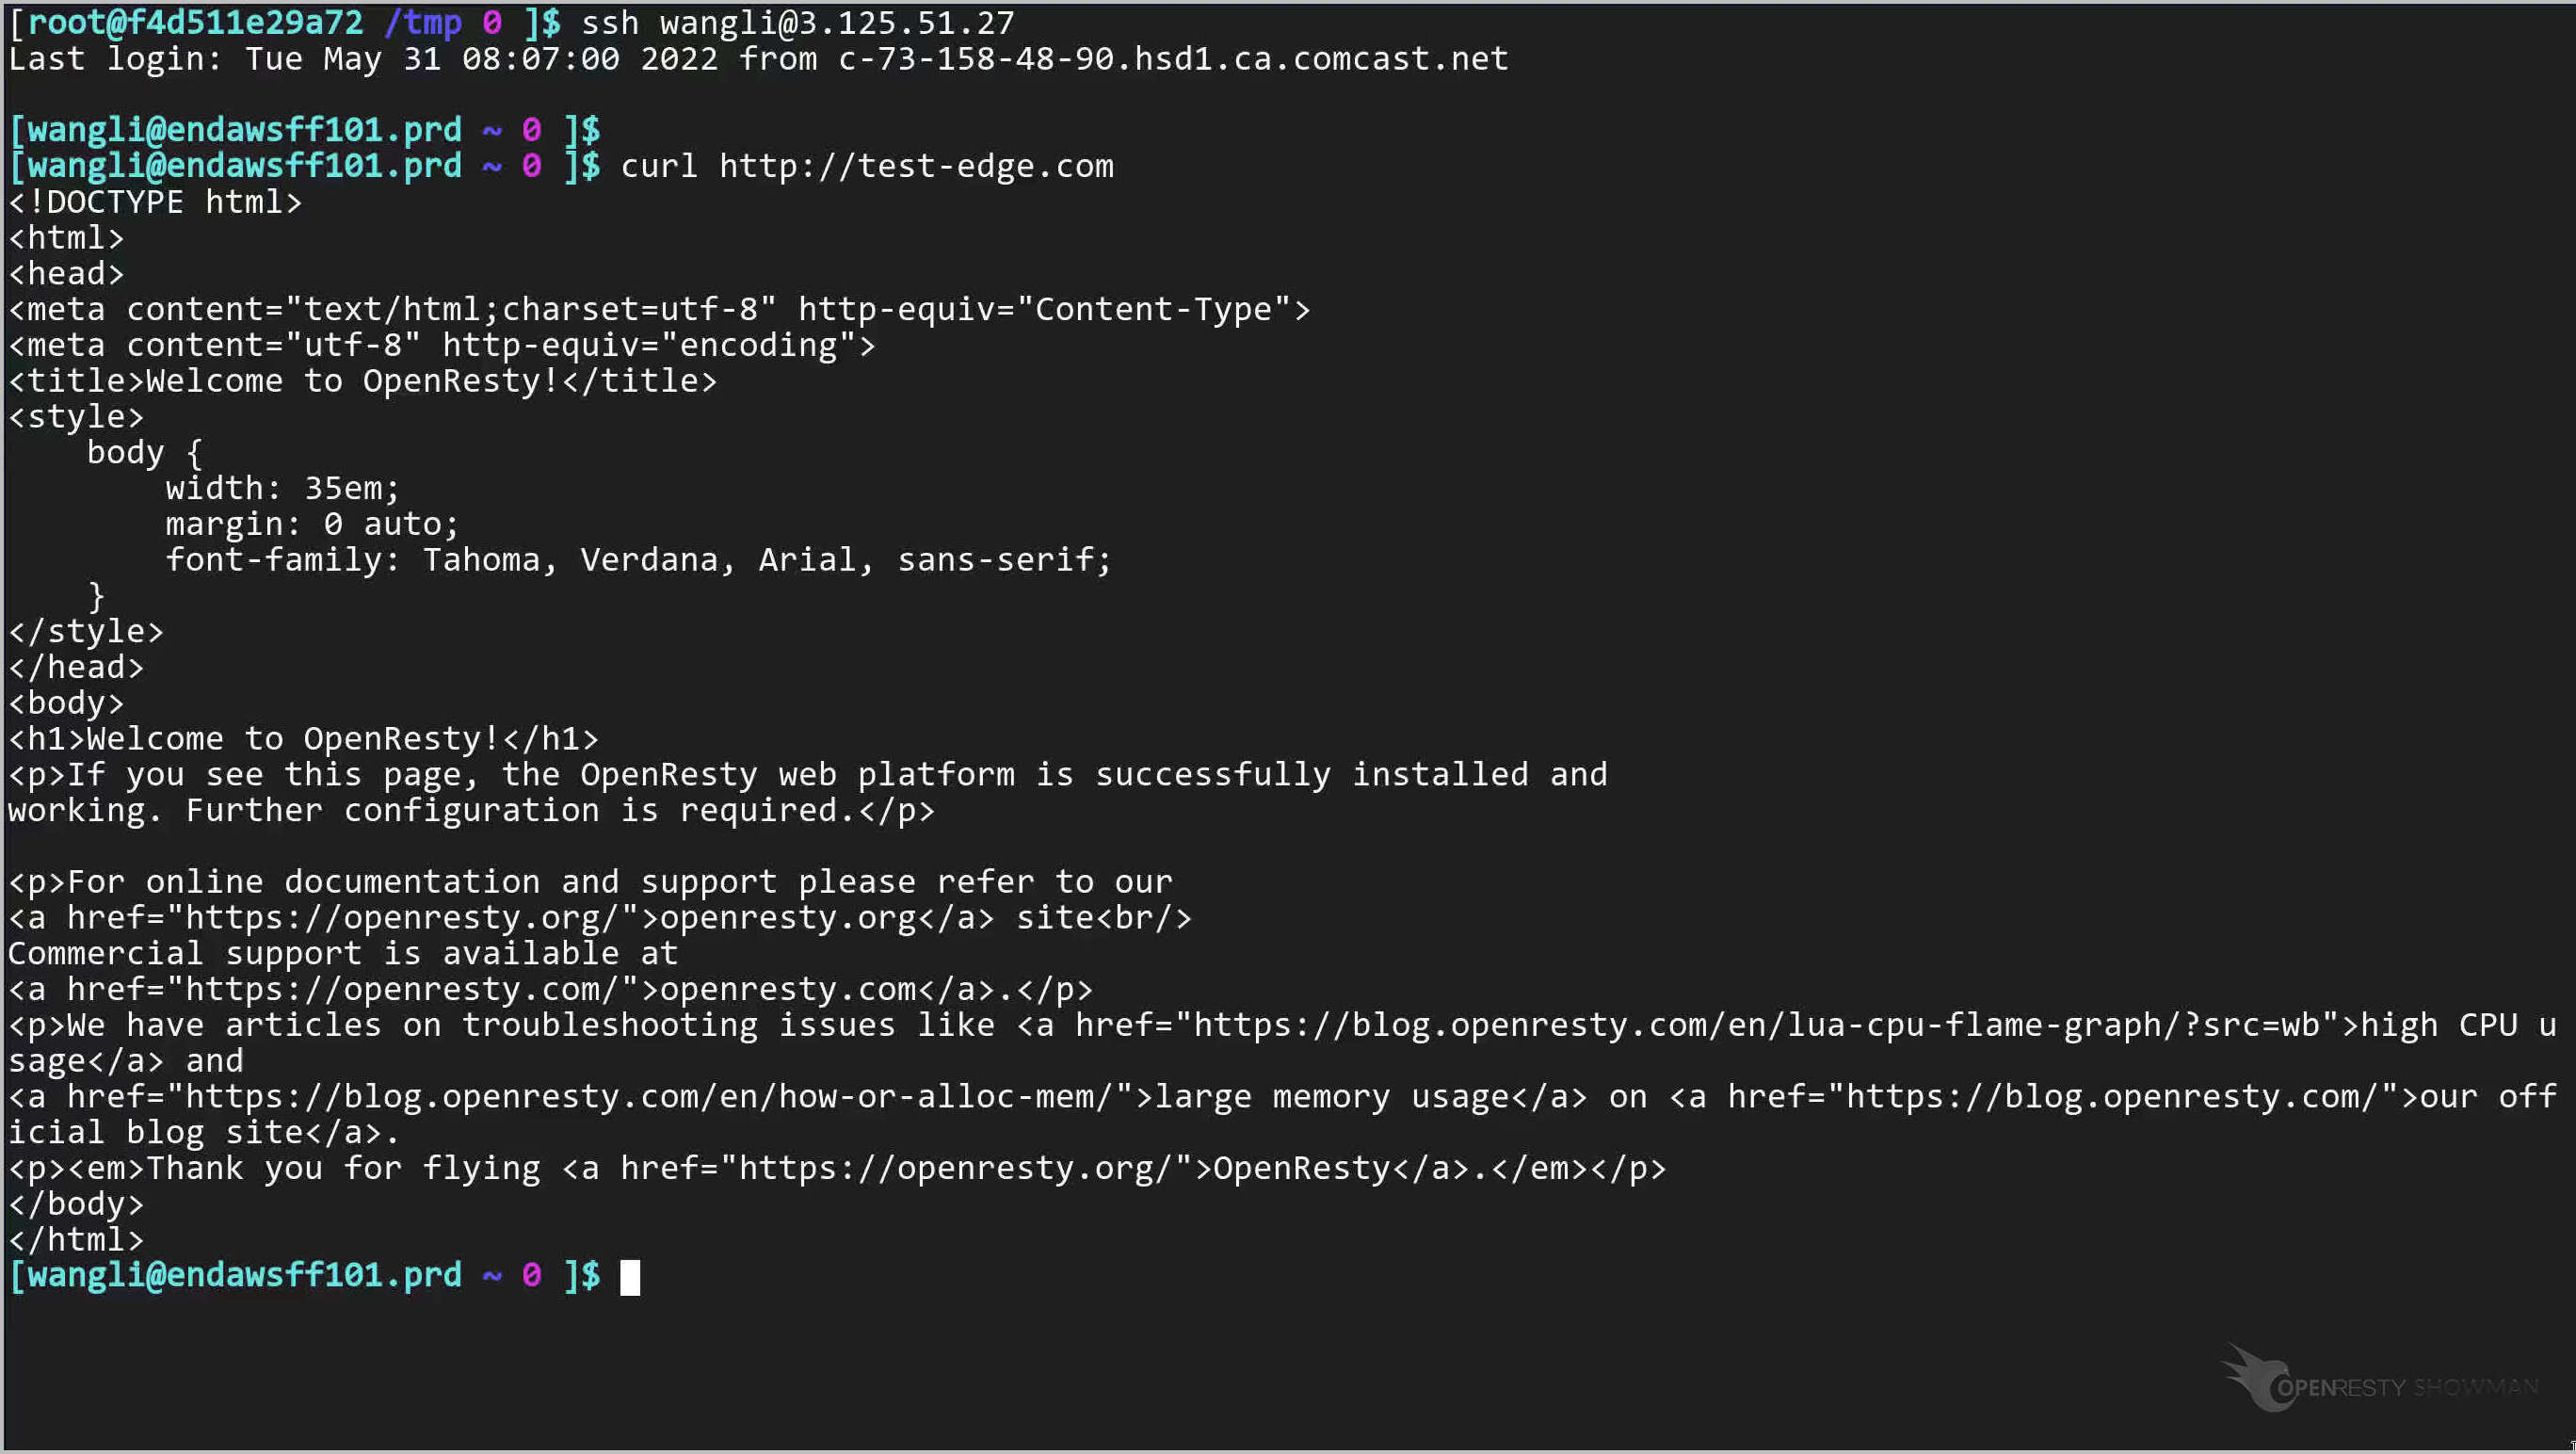
Send an HTTP request with the curl command-line utility.
curl http://test-edge.com
Quit the server.
Then we log onto another server in the San Jose city of the US.
Send a request as well.
curl http://test-edge.com
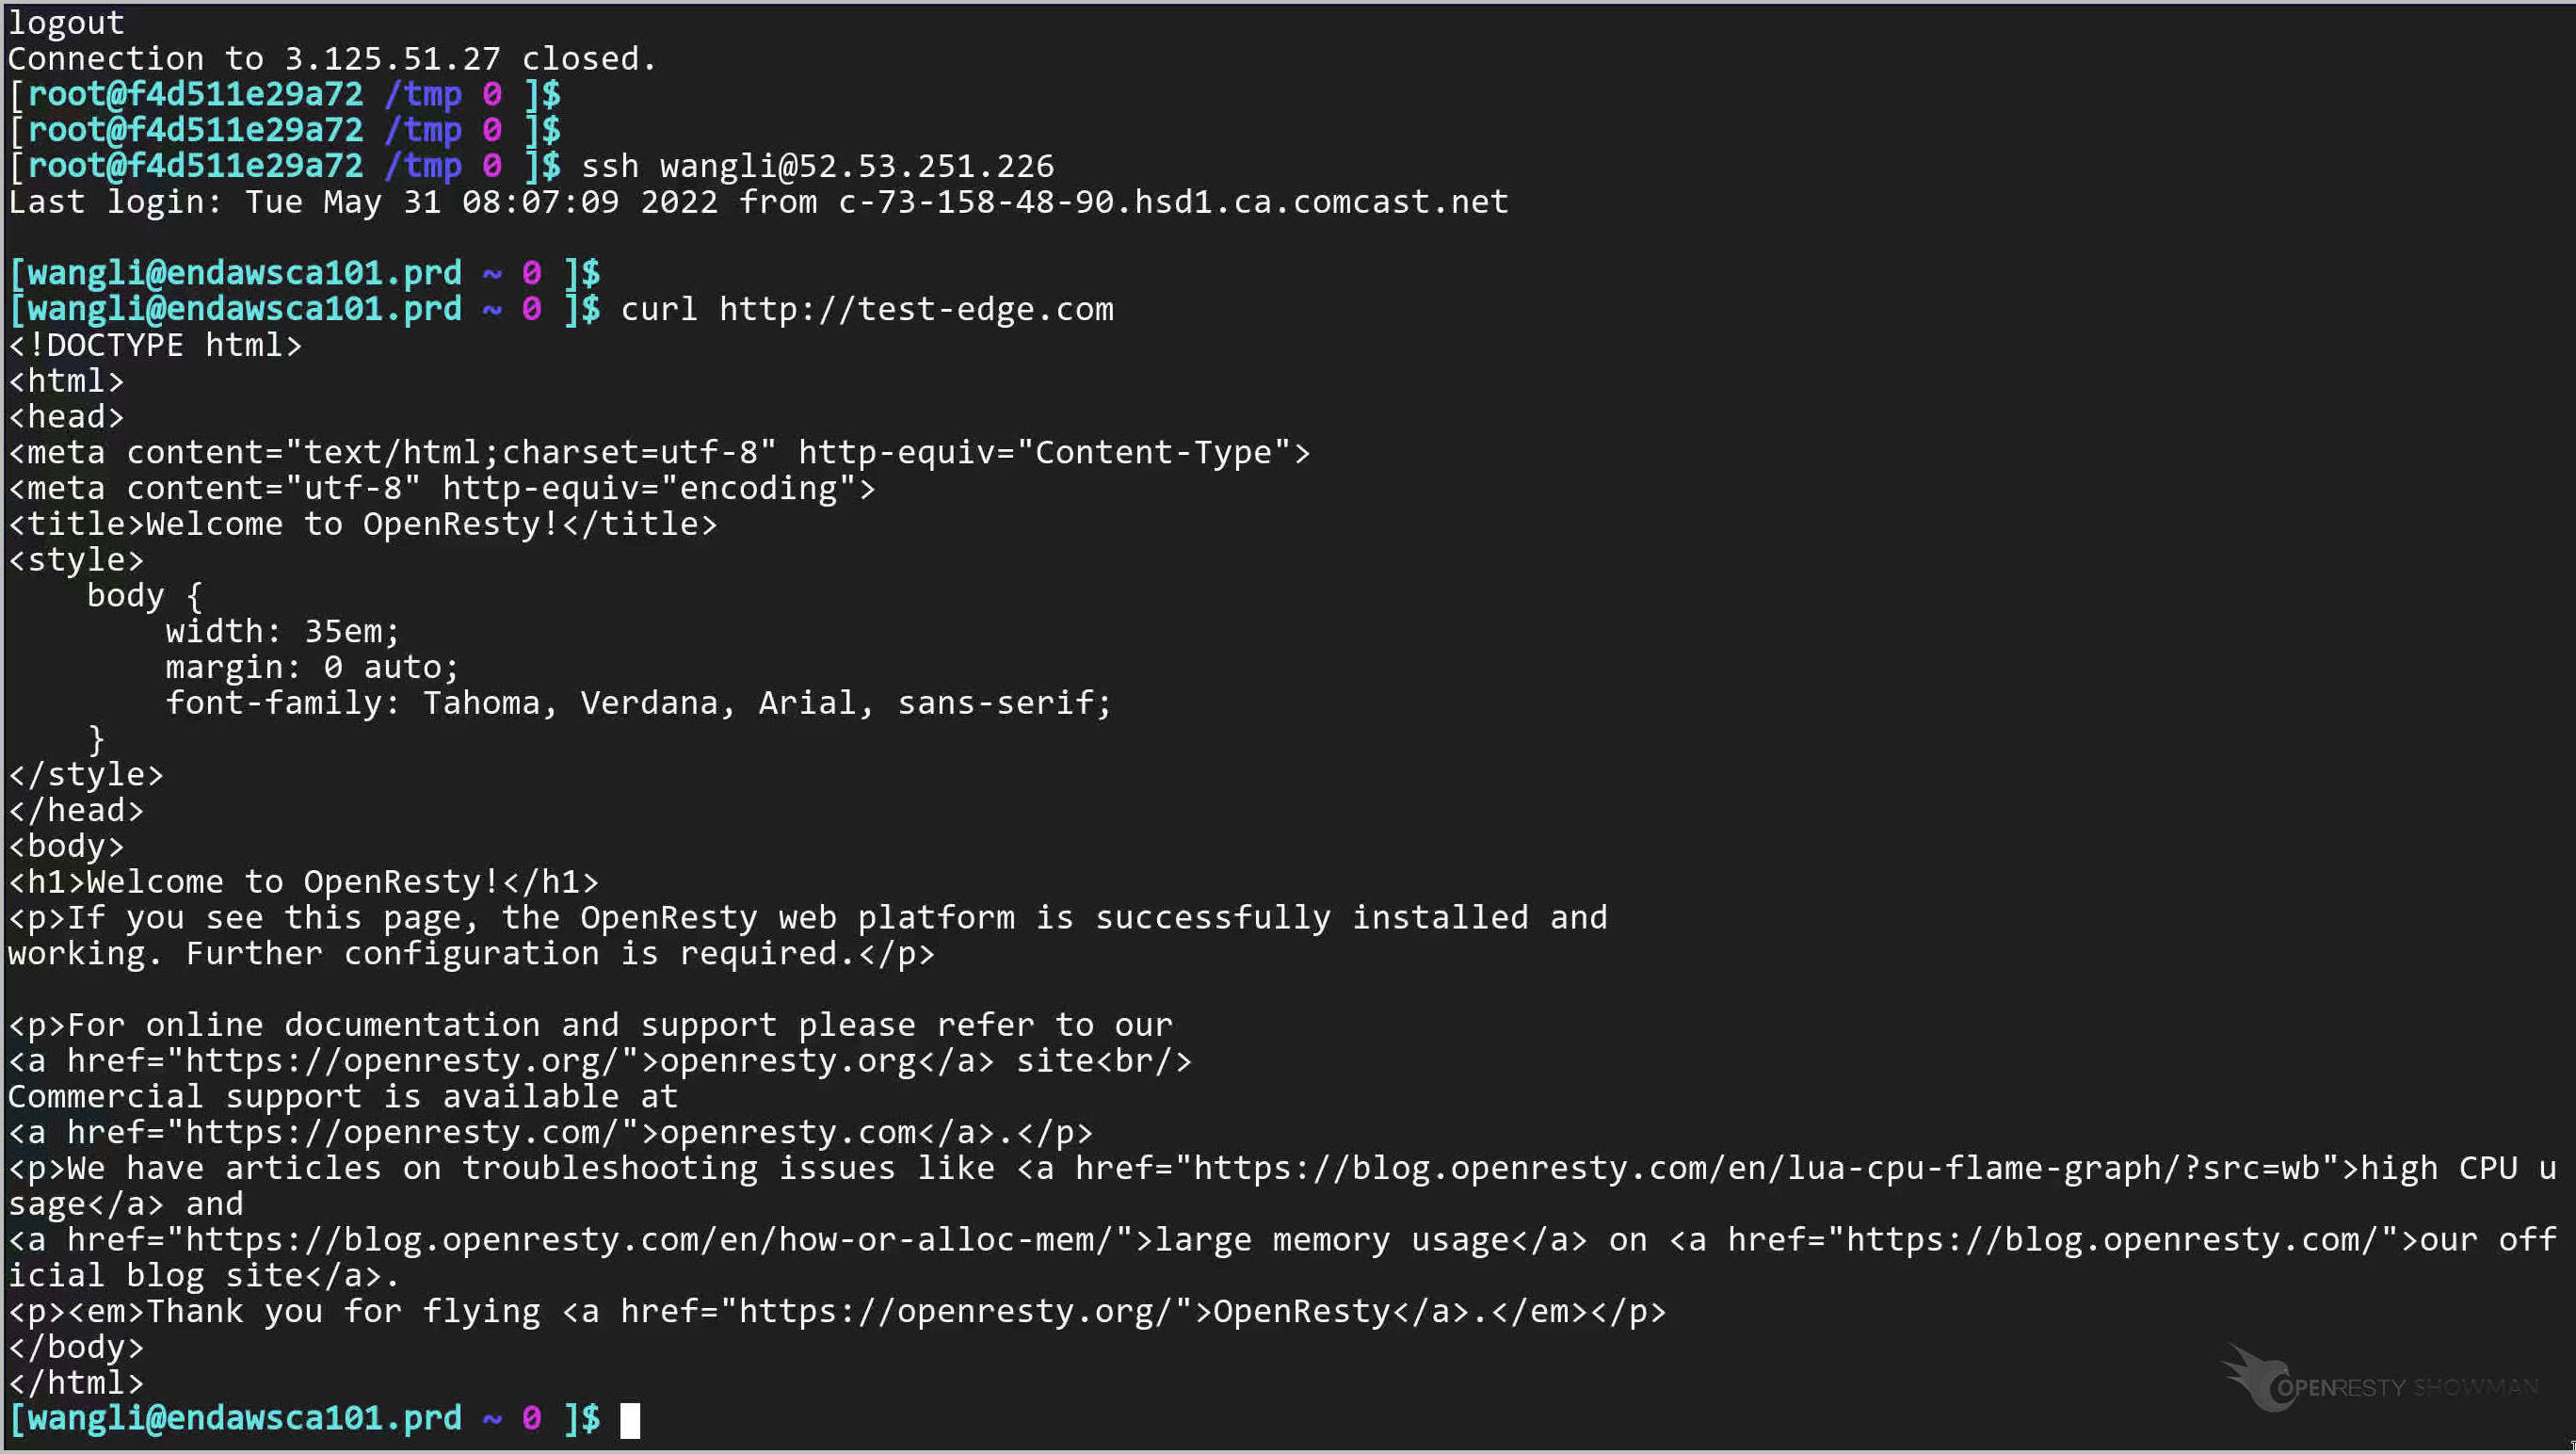
Exit the server.
Now let’s do this on a third server in London, UK. This time we are going to send four requests.
Send the first one.
curl http://test-edge.com
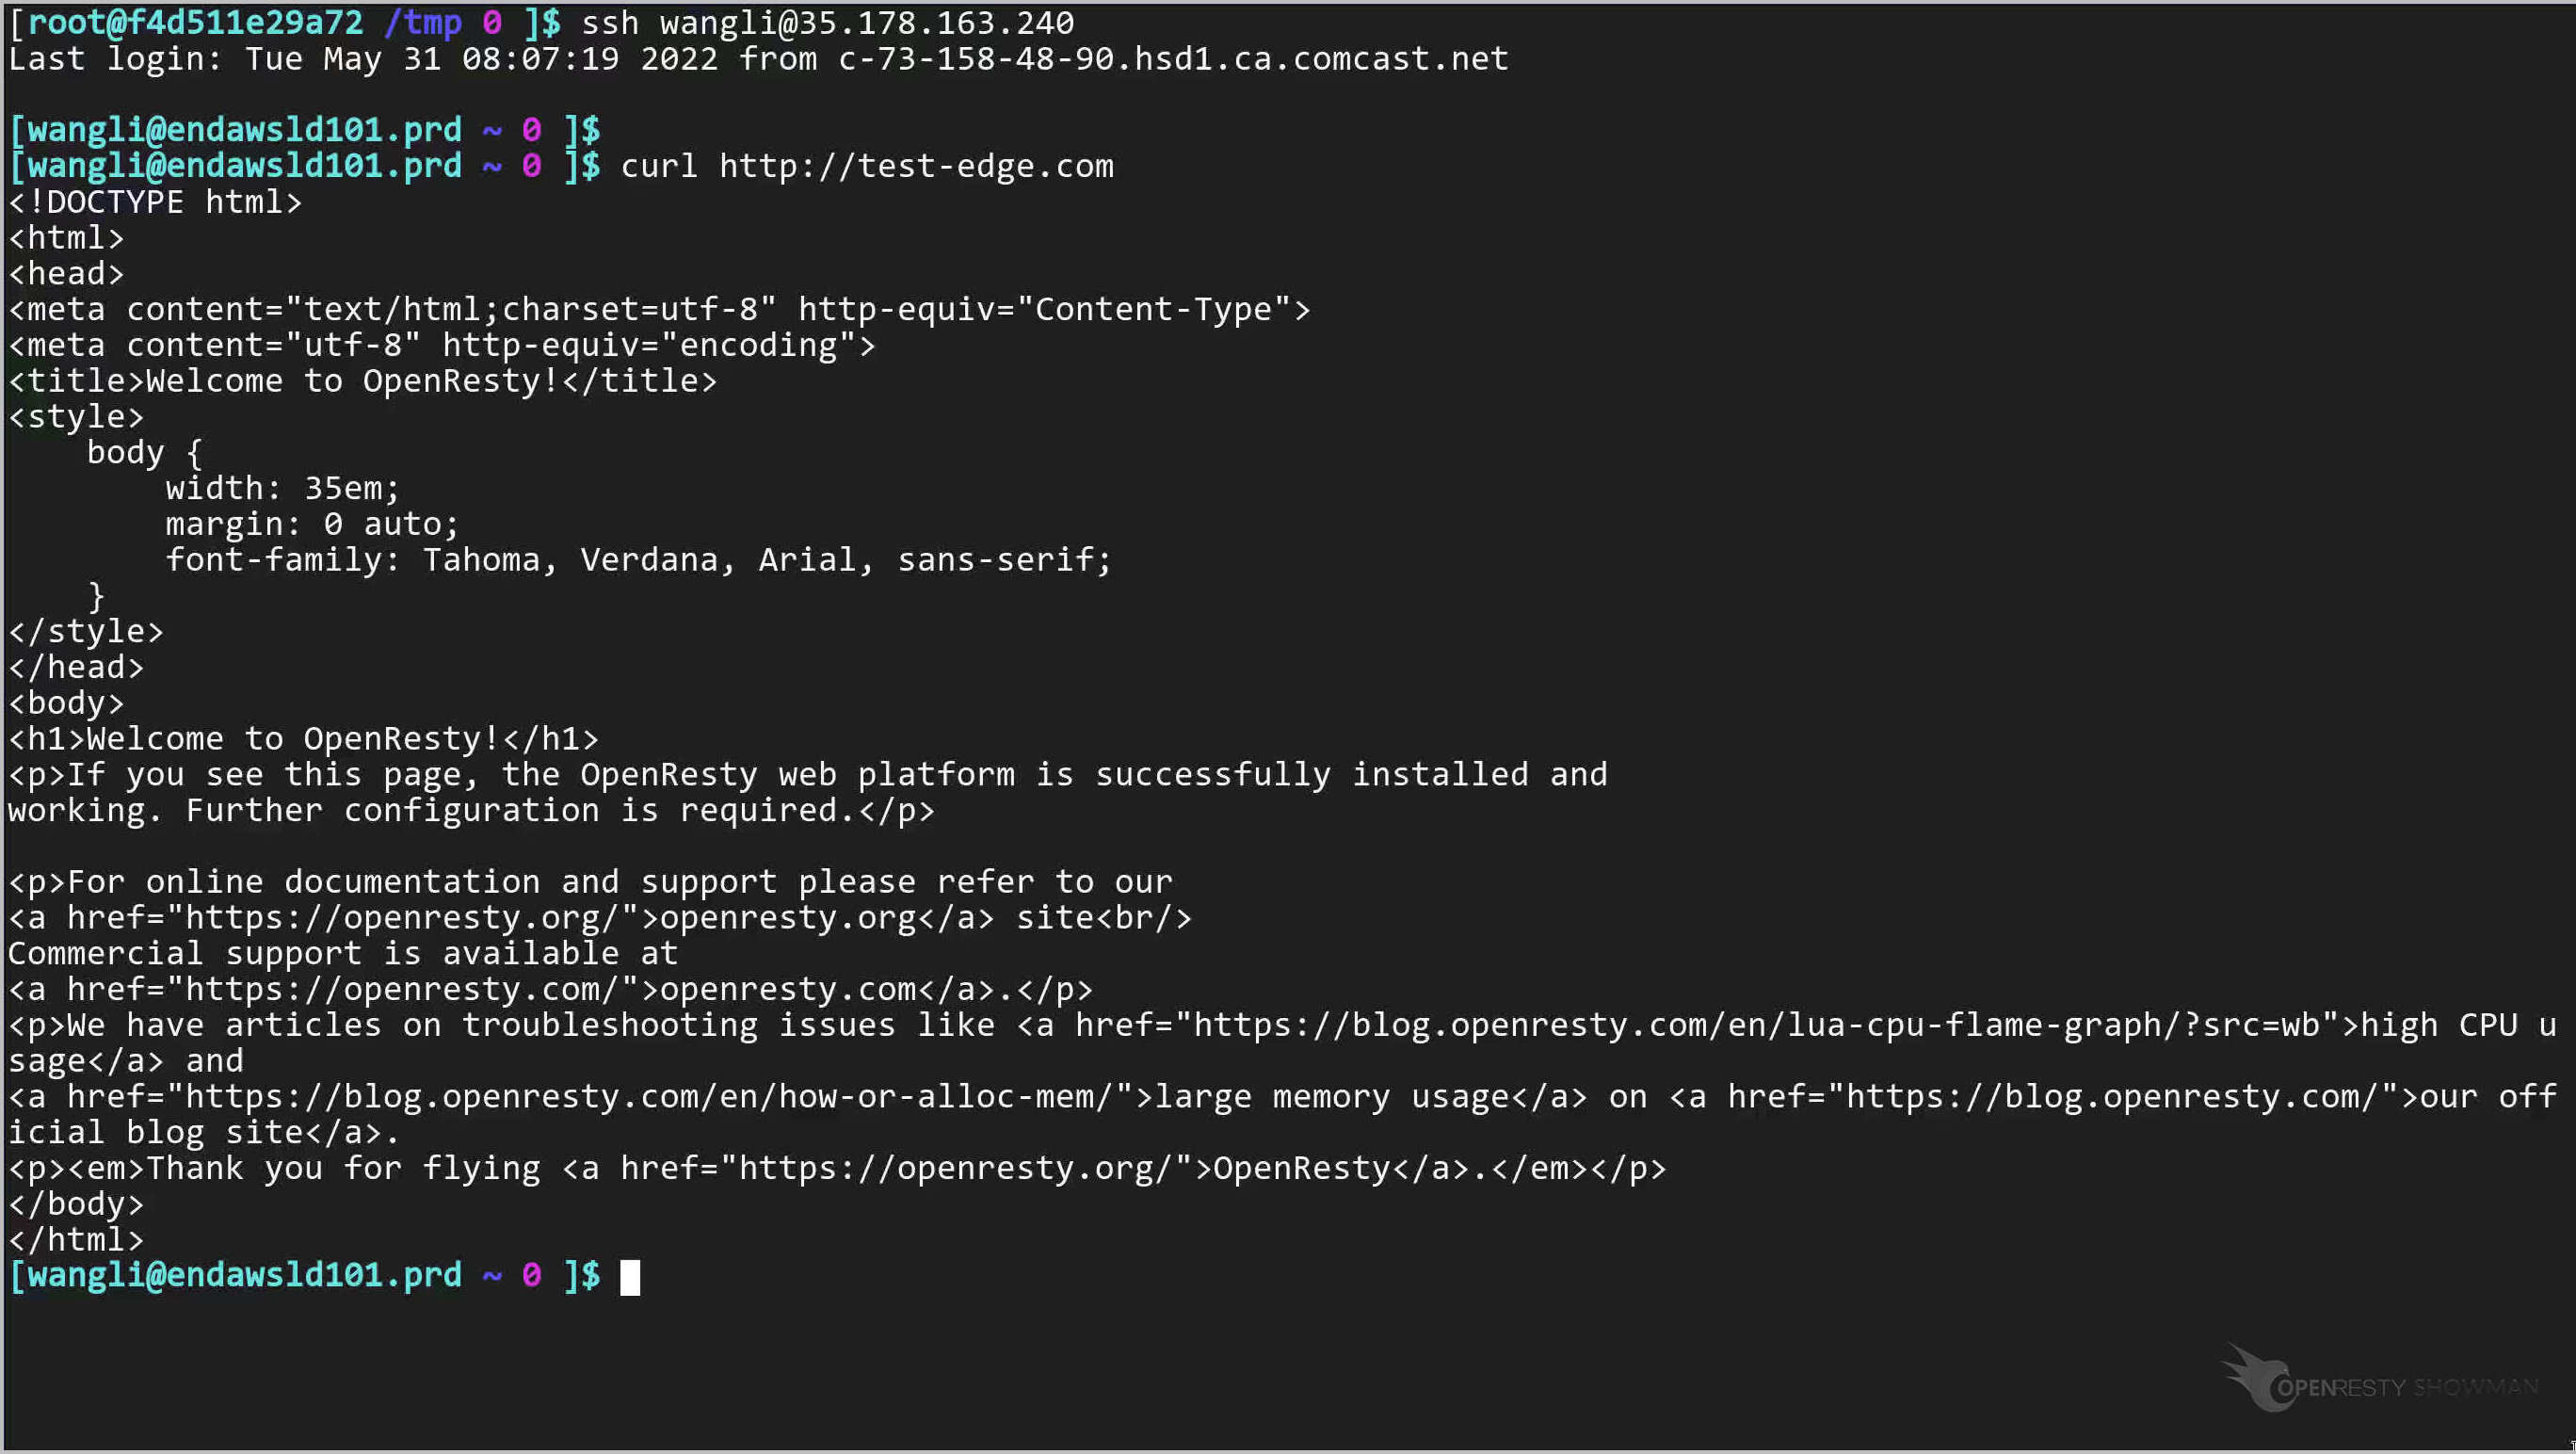
We wait for 10 seconds and then send the second and third ones. After another 10 seconds, send the fourth request.
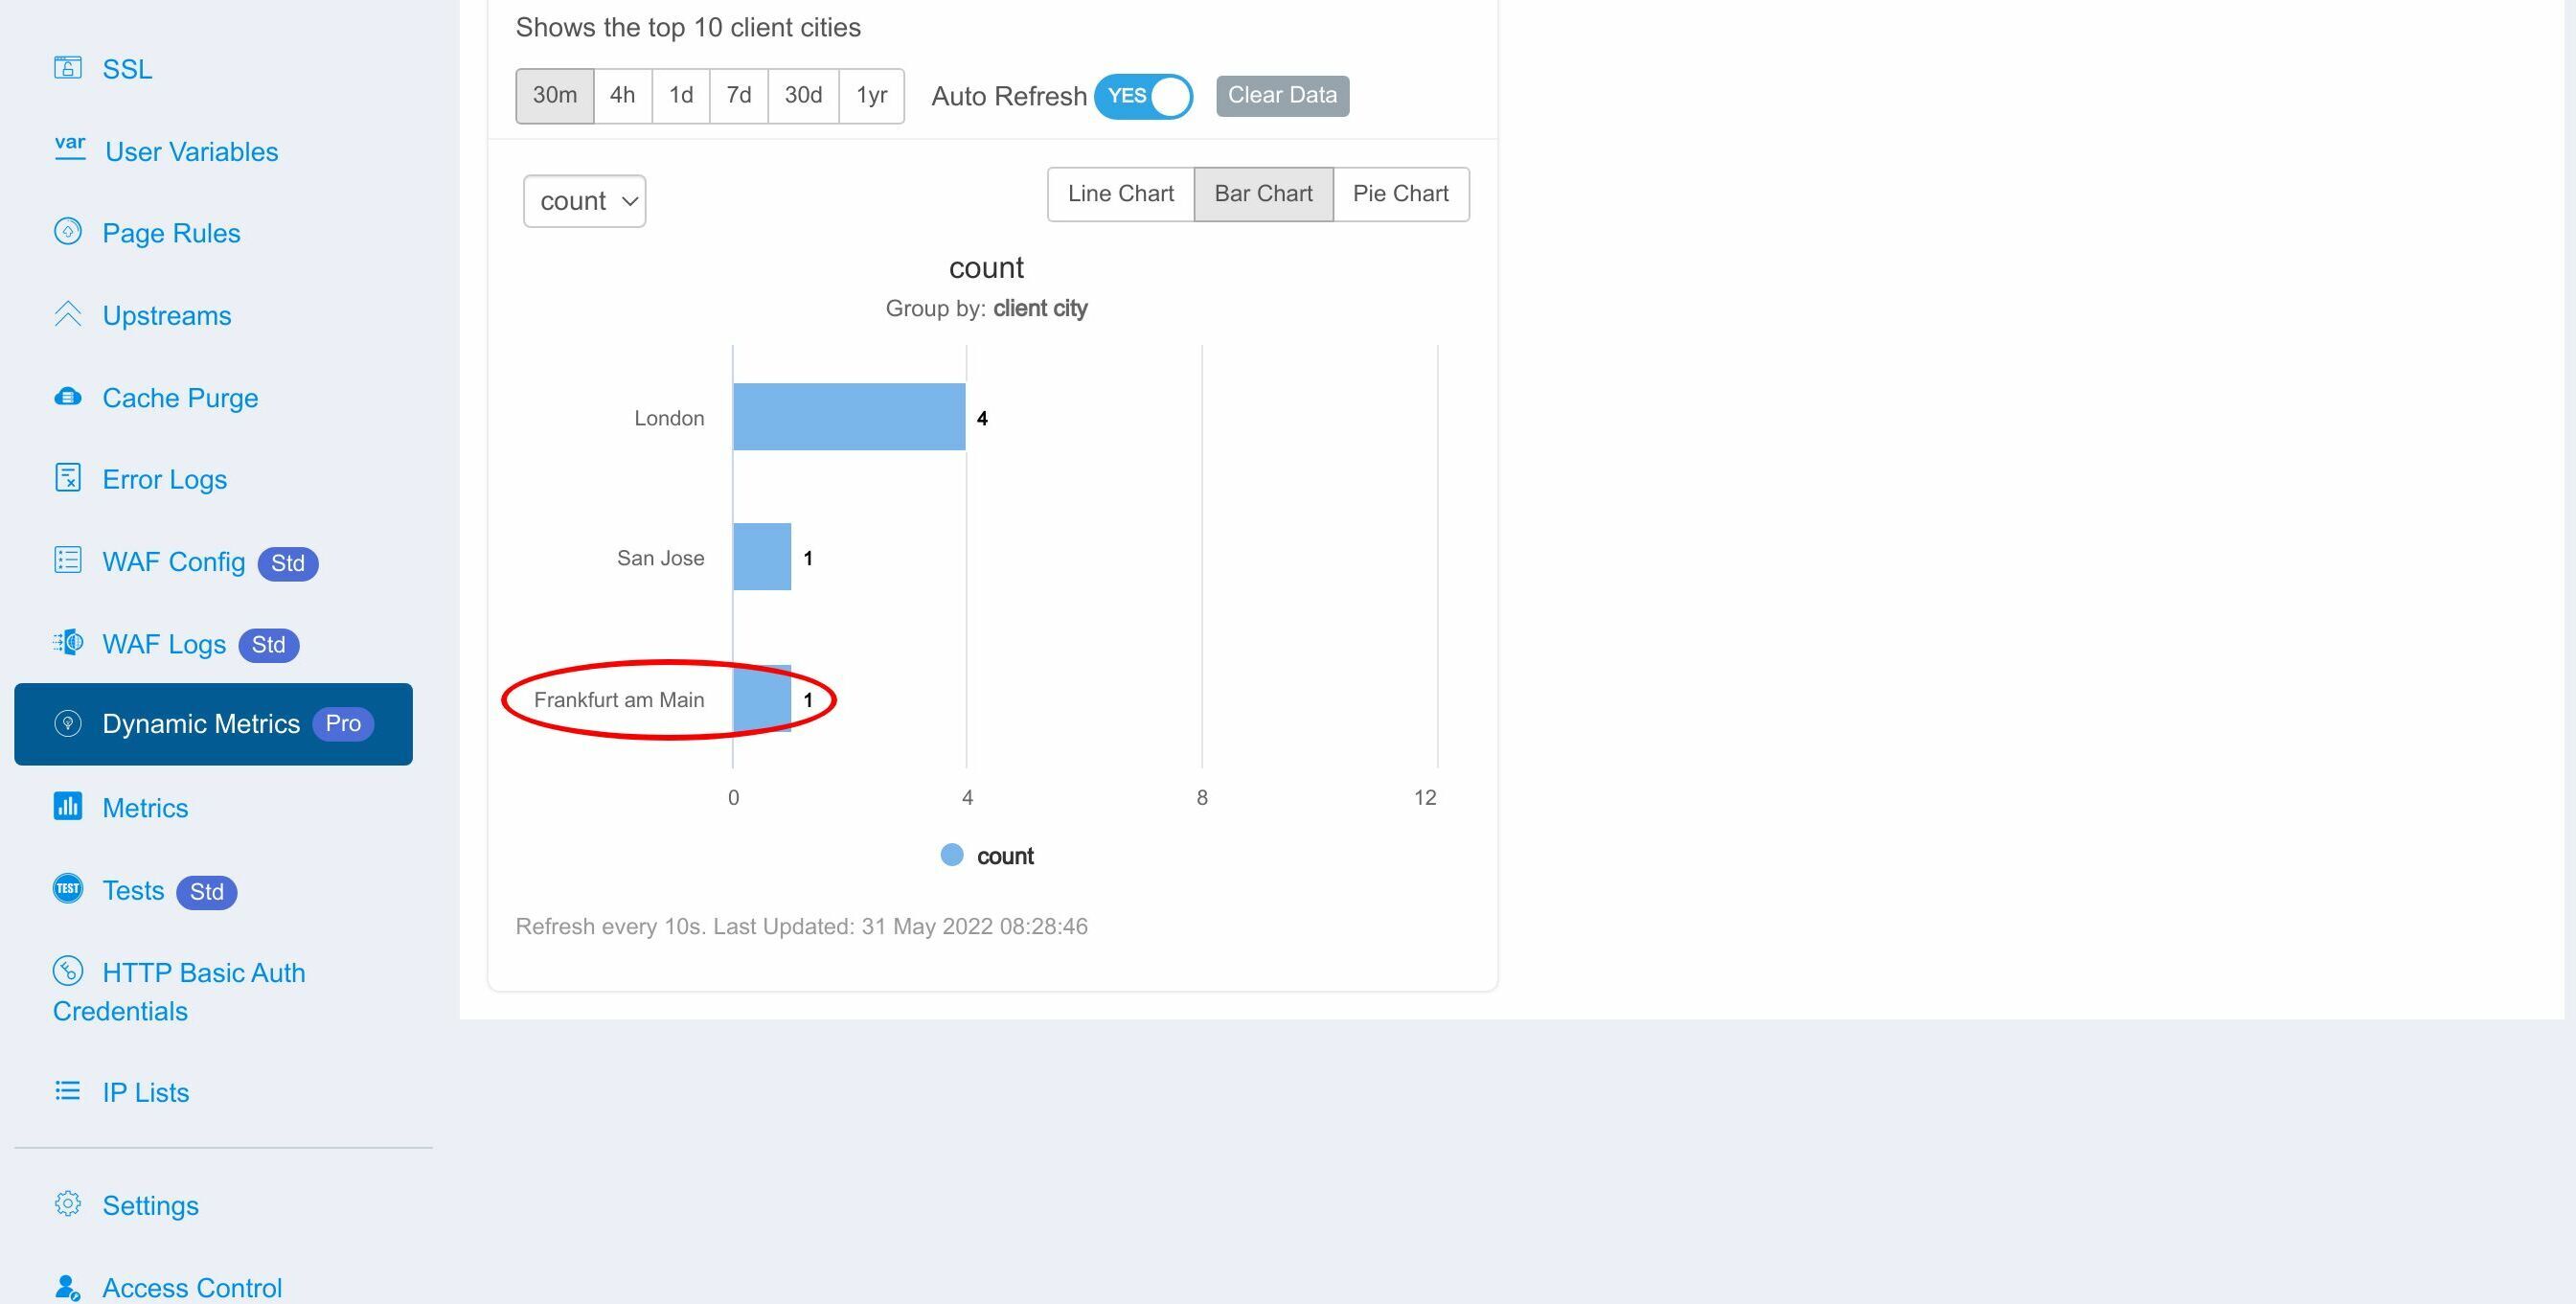
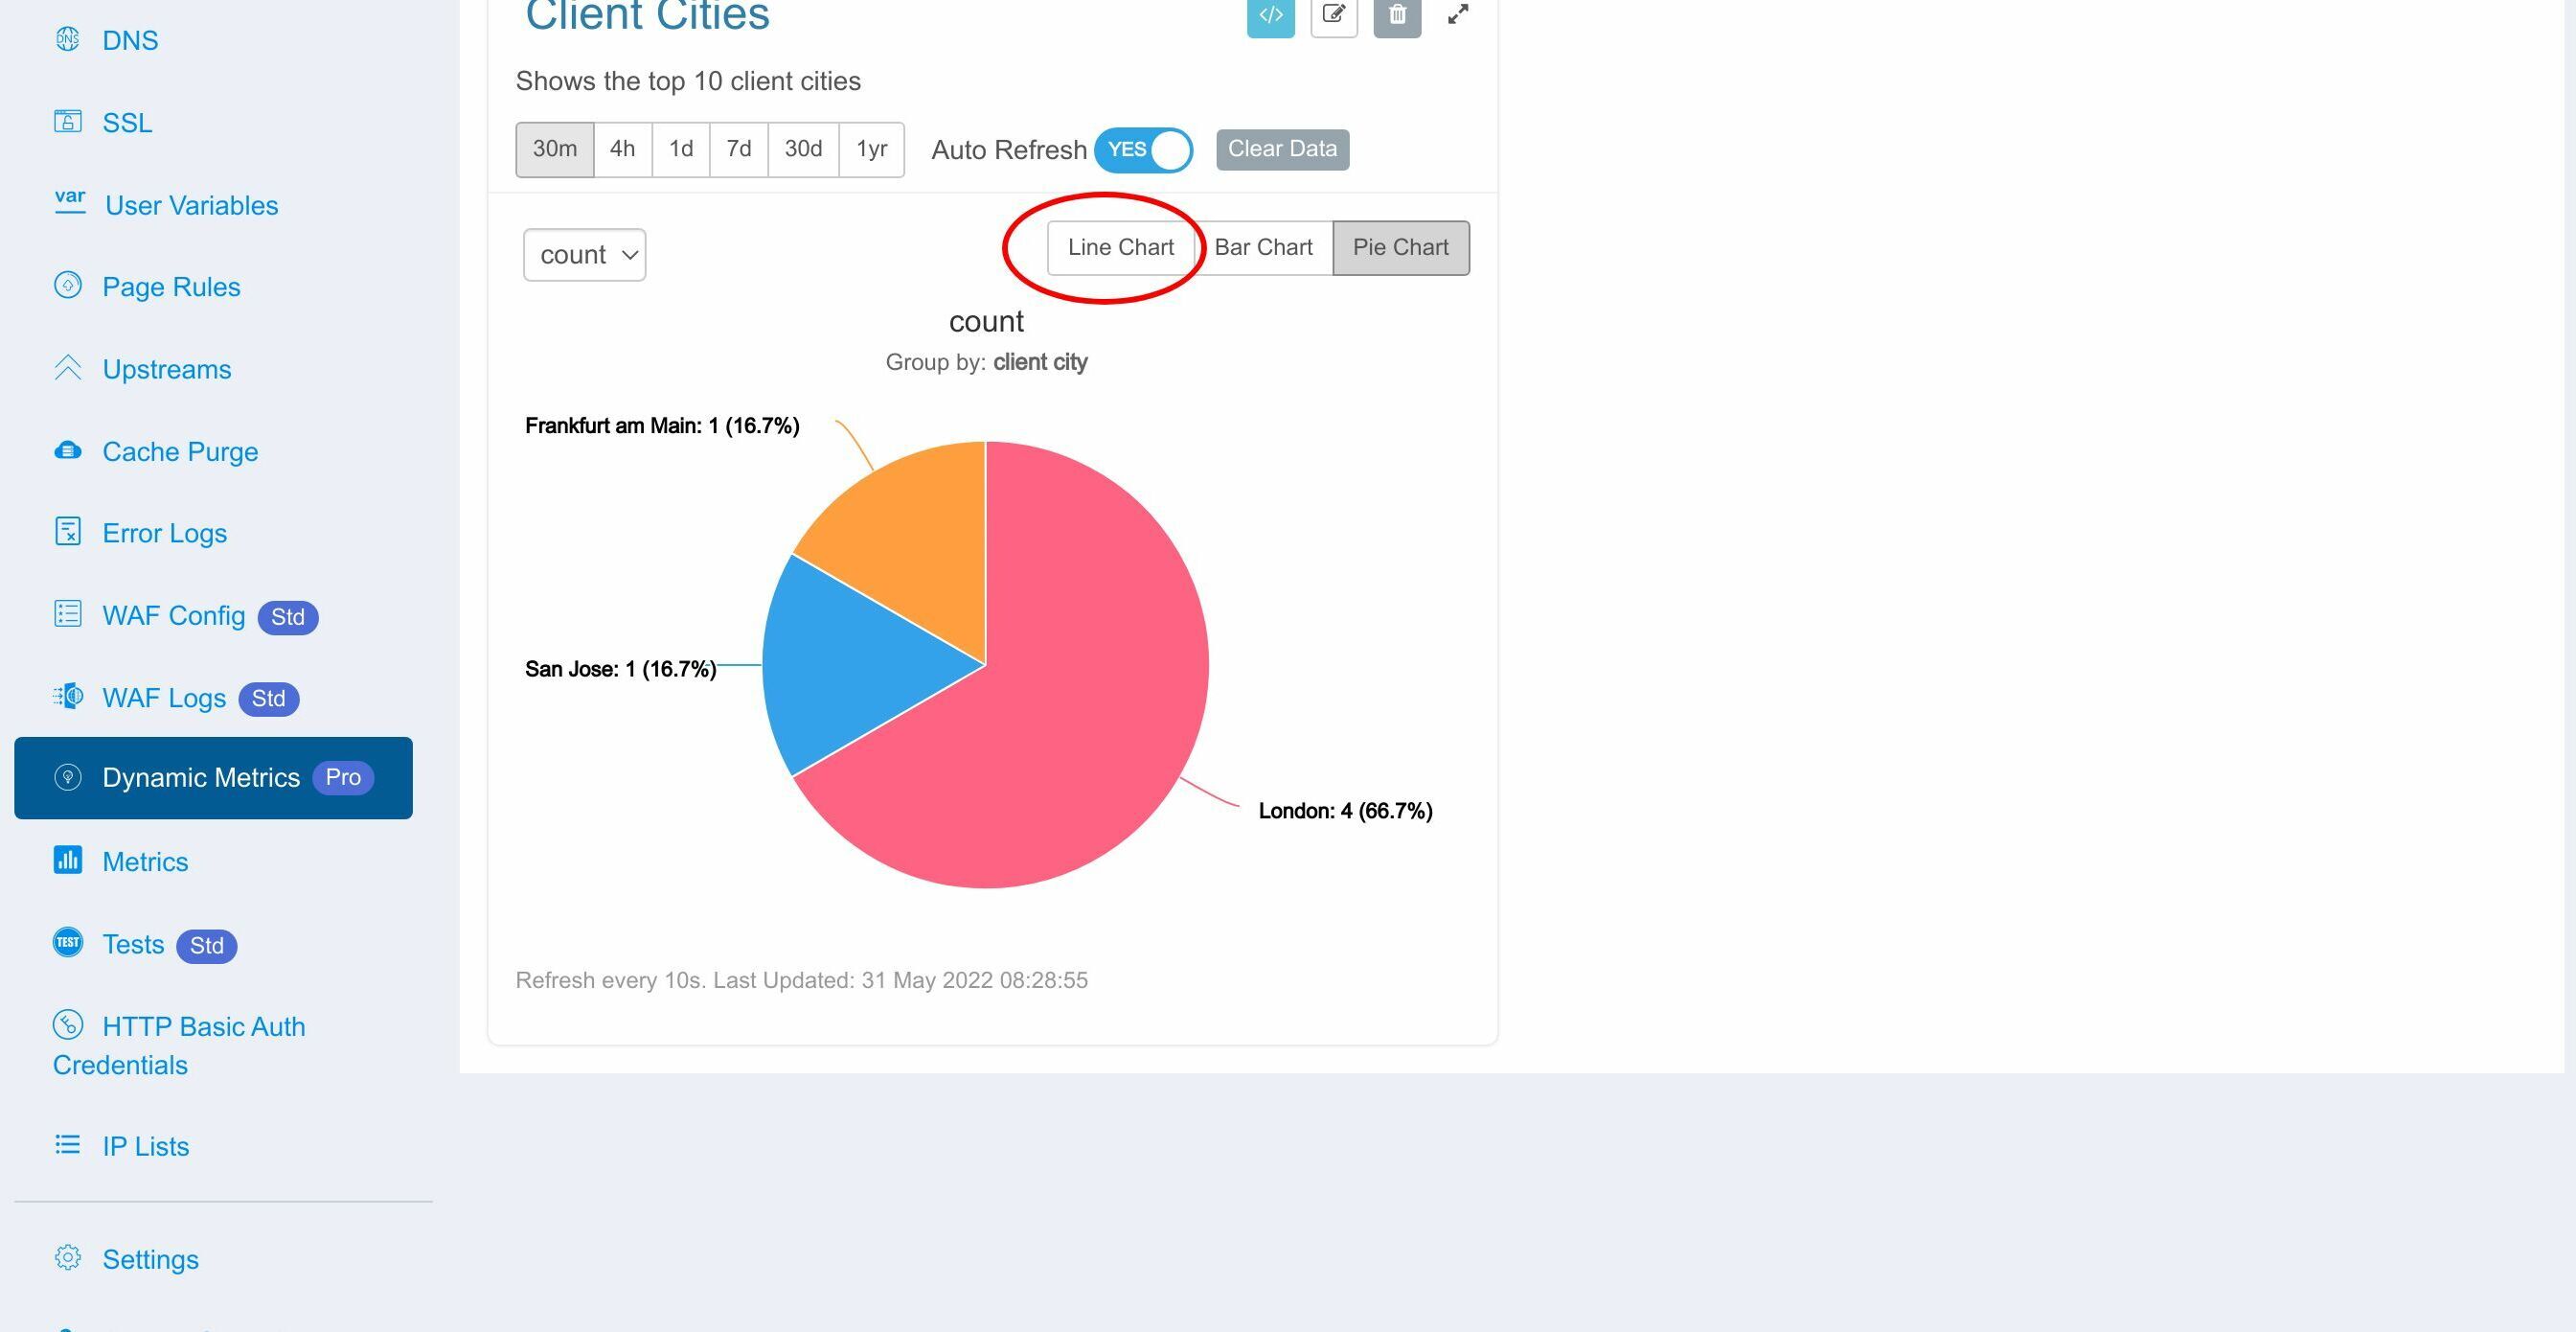
Check out all the requests we just sent. Here is one request from Frankfurt,
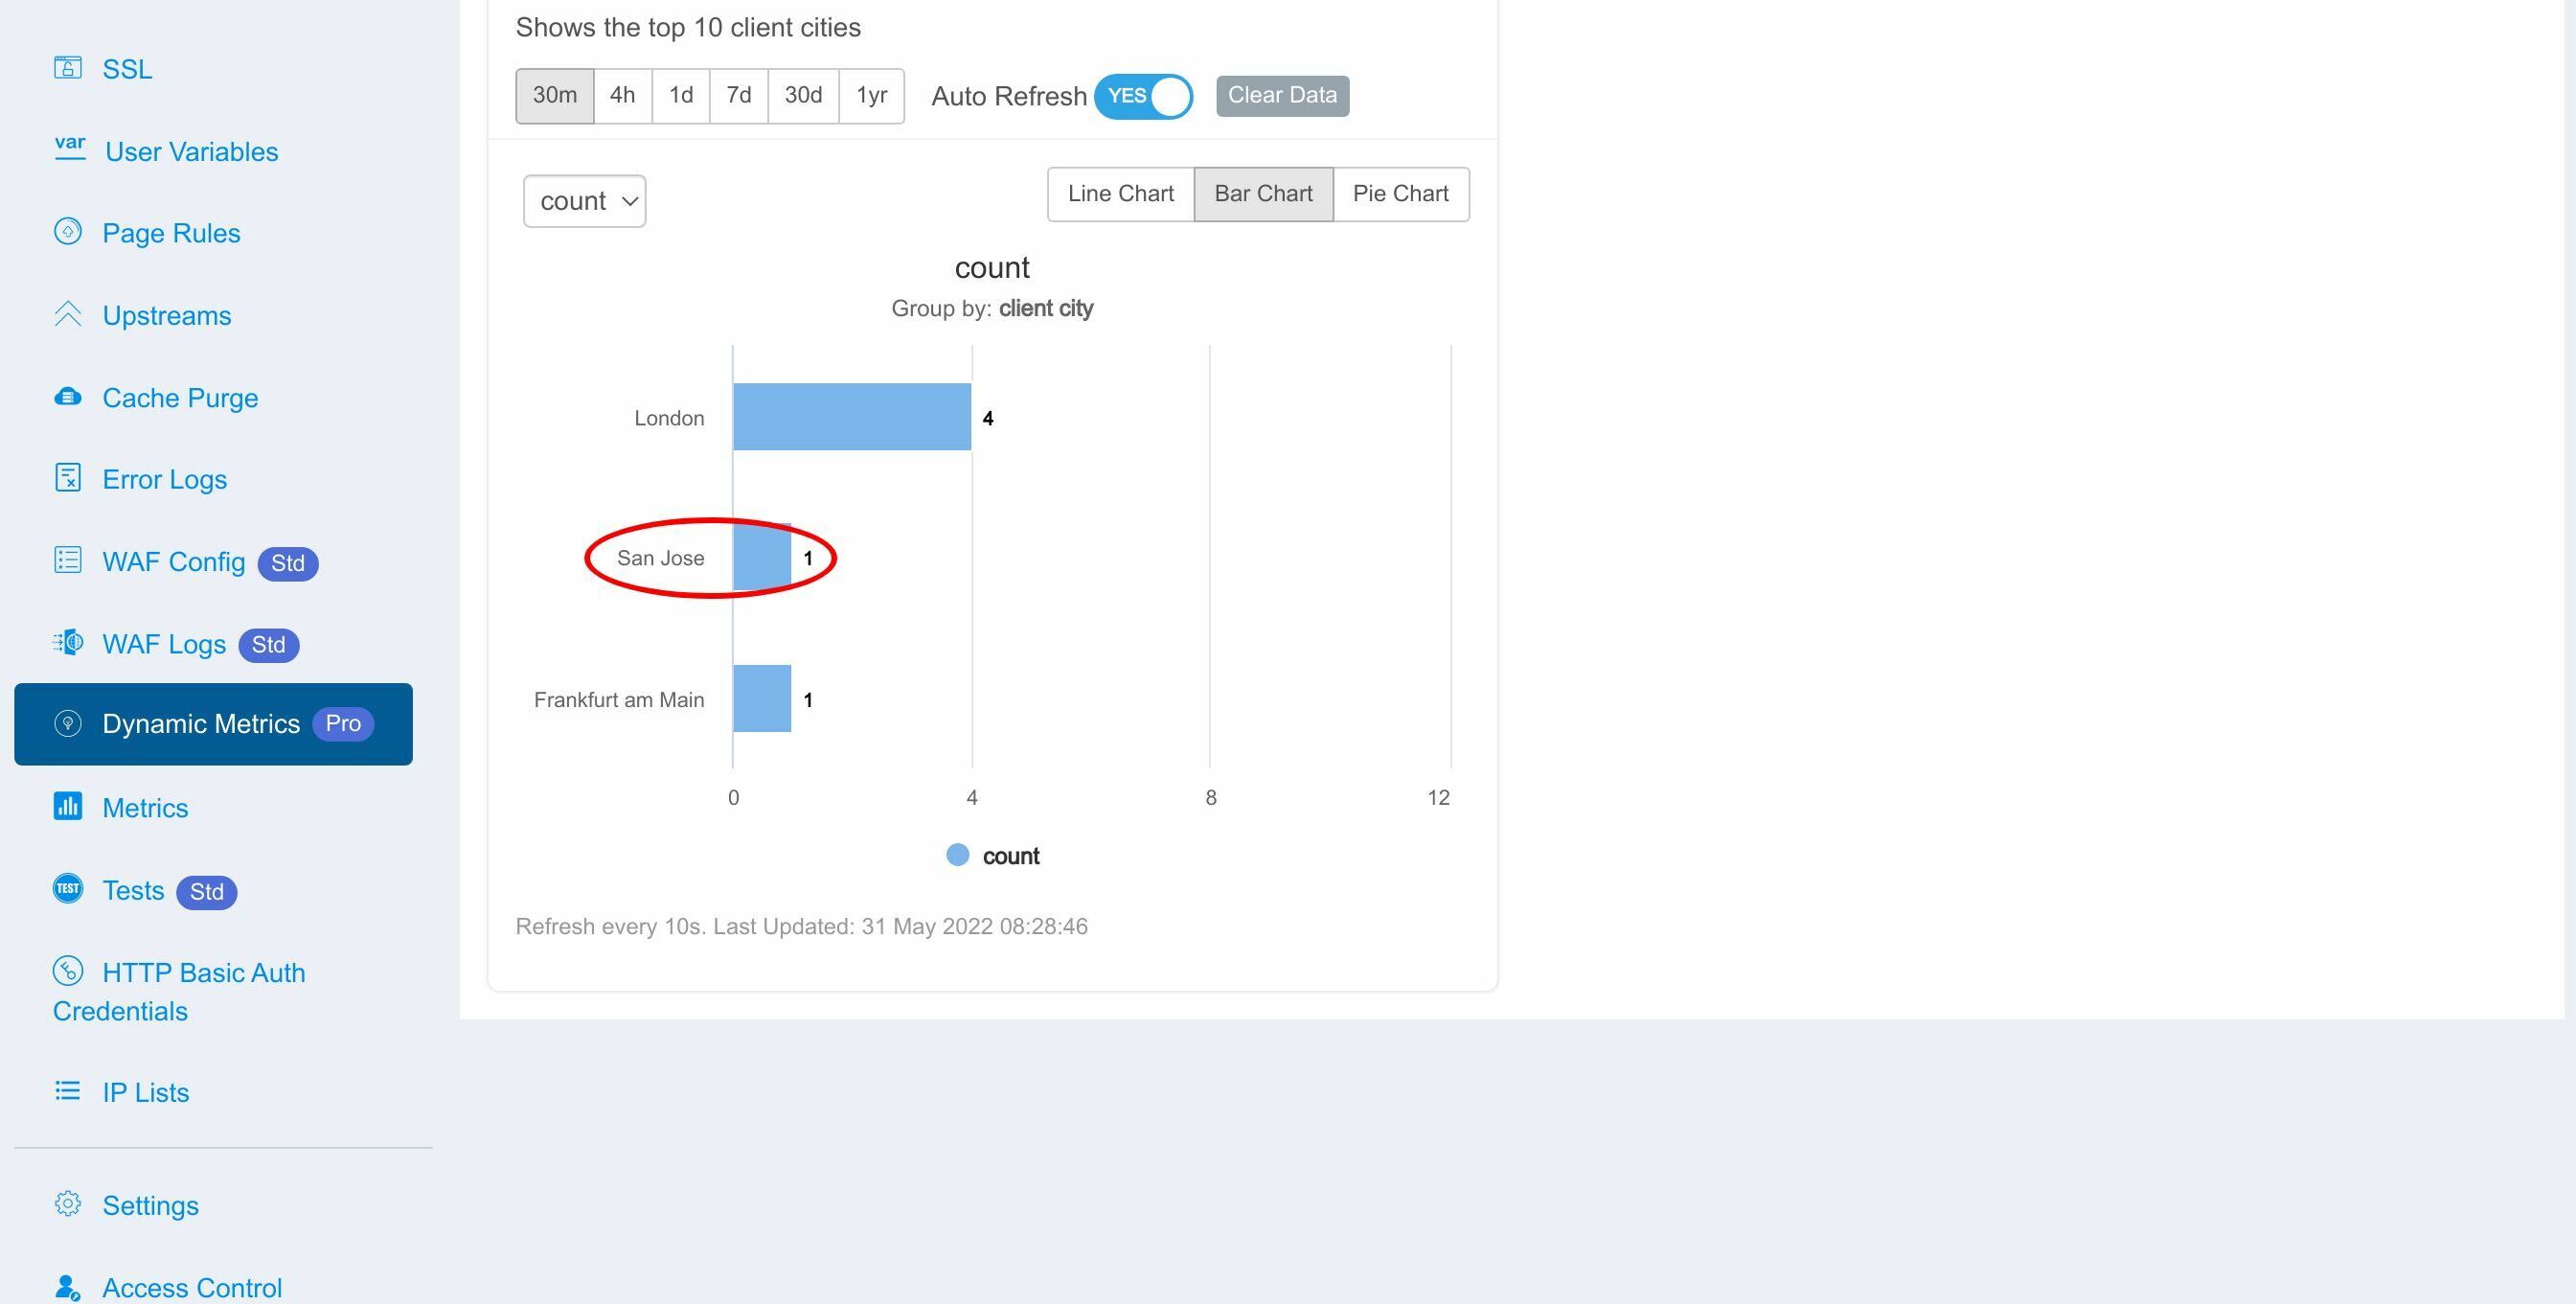
one request from San Jose,
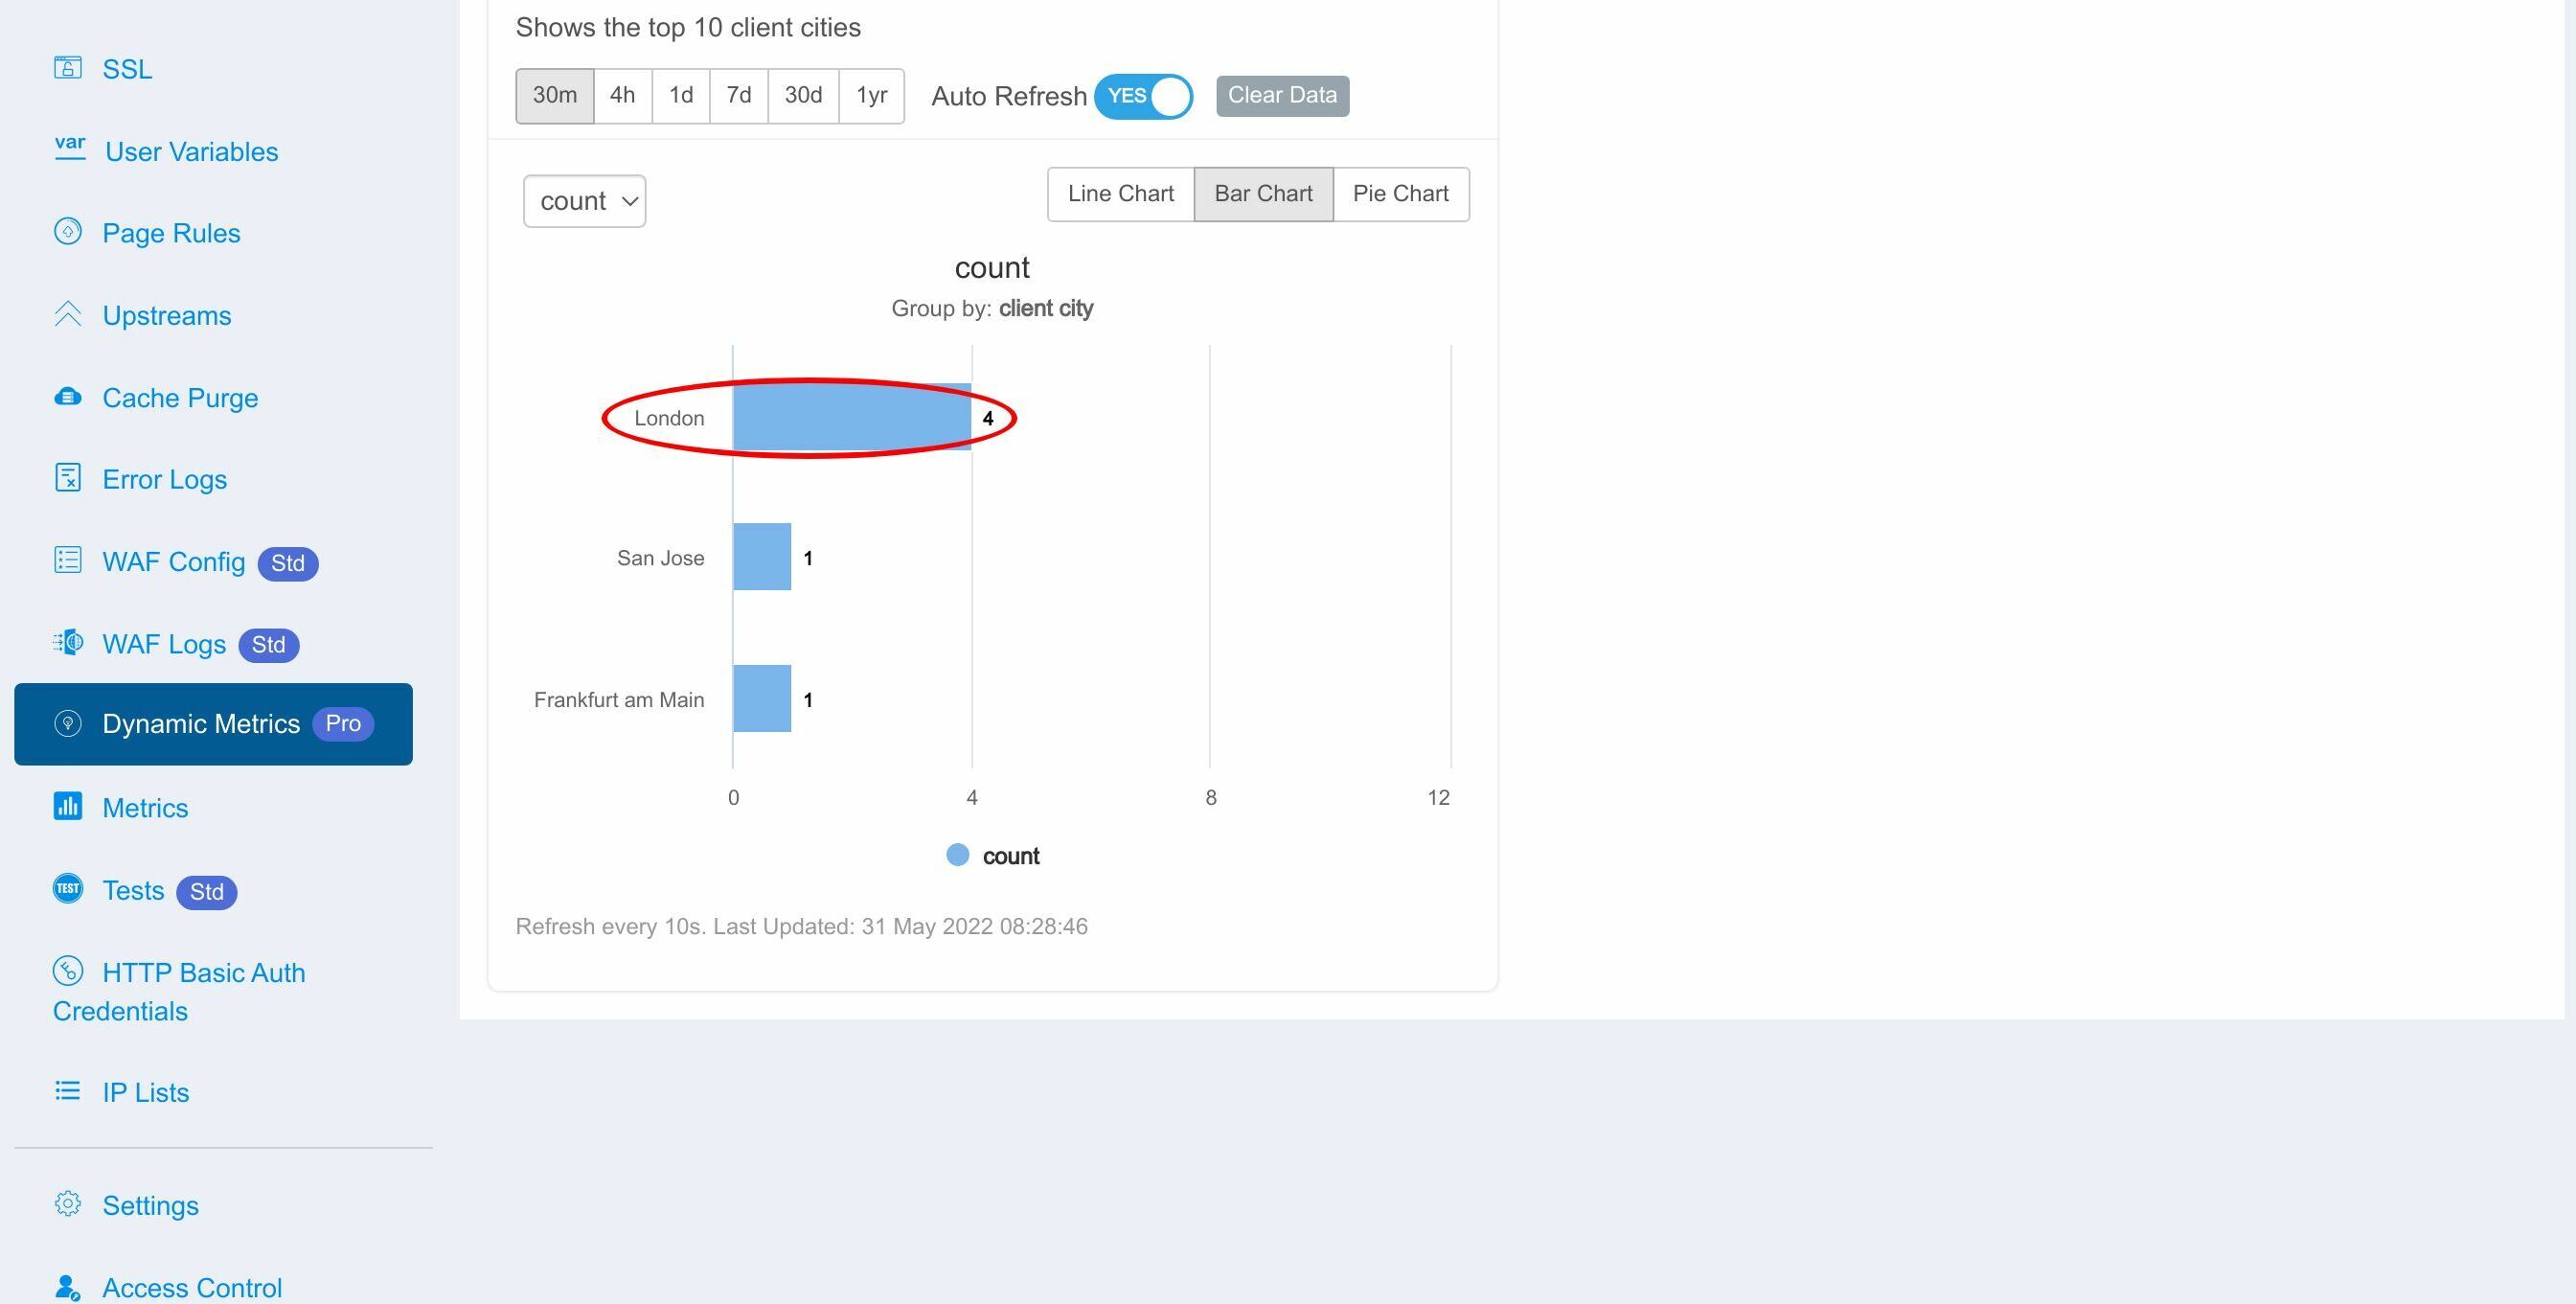
and four from London.
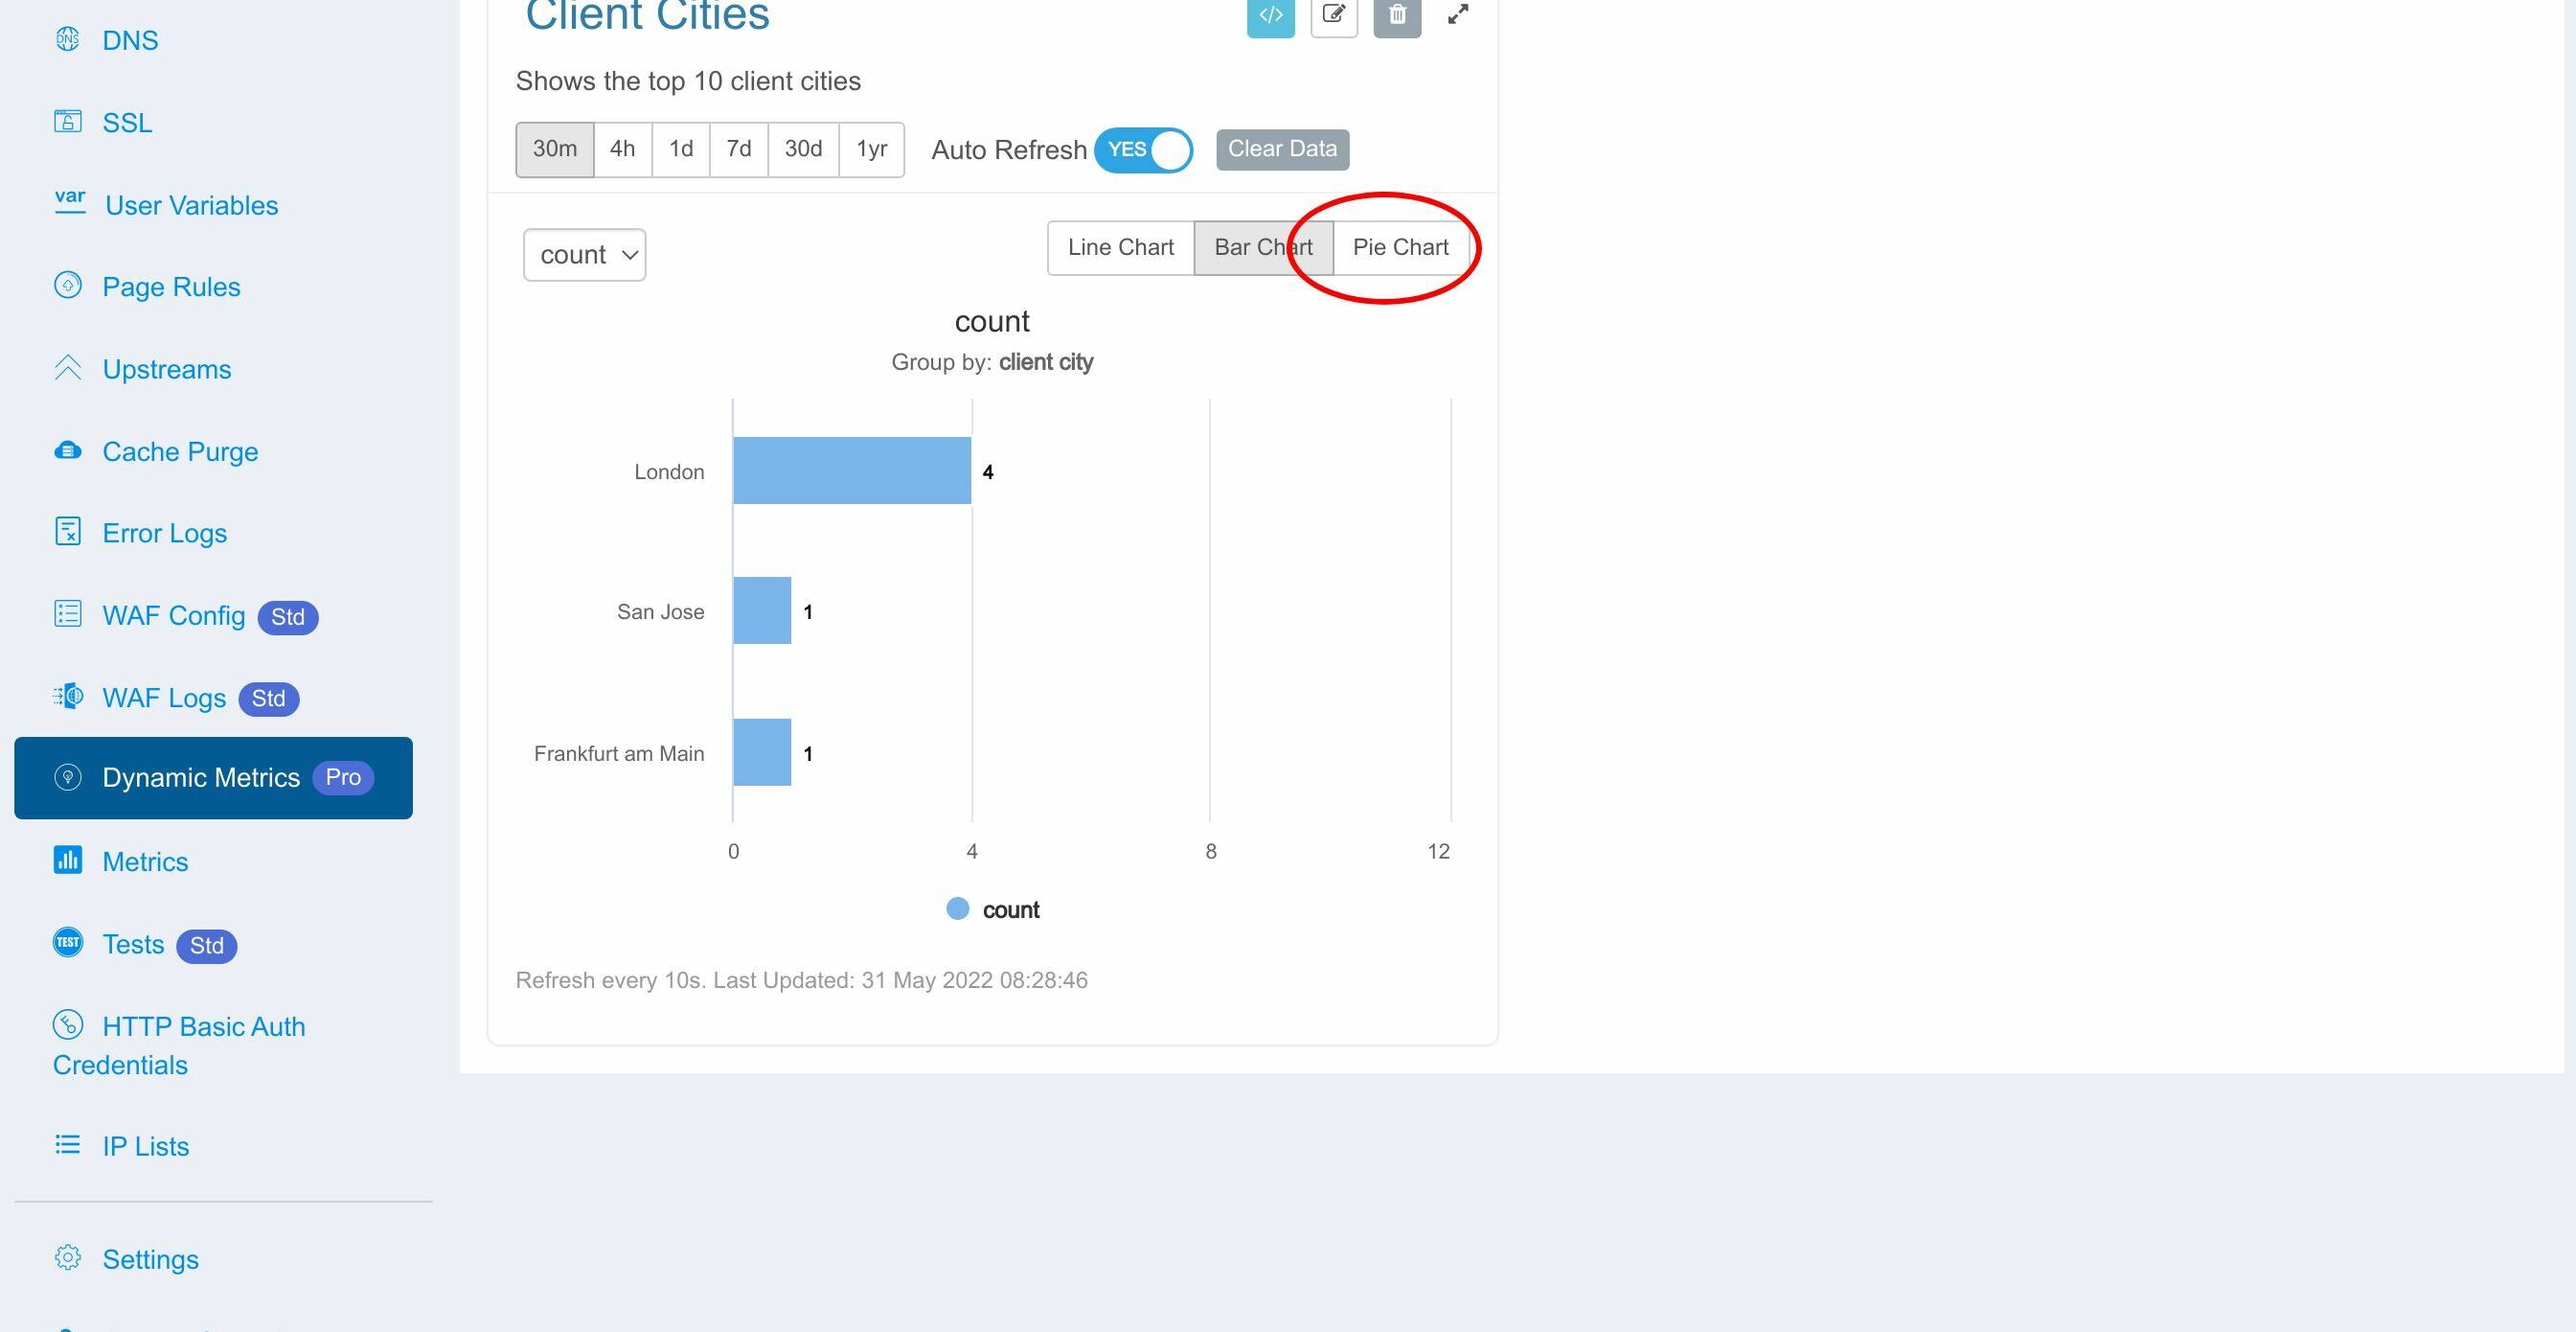
Data can be shown in a pie chart as well.
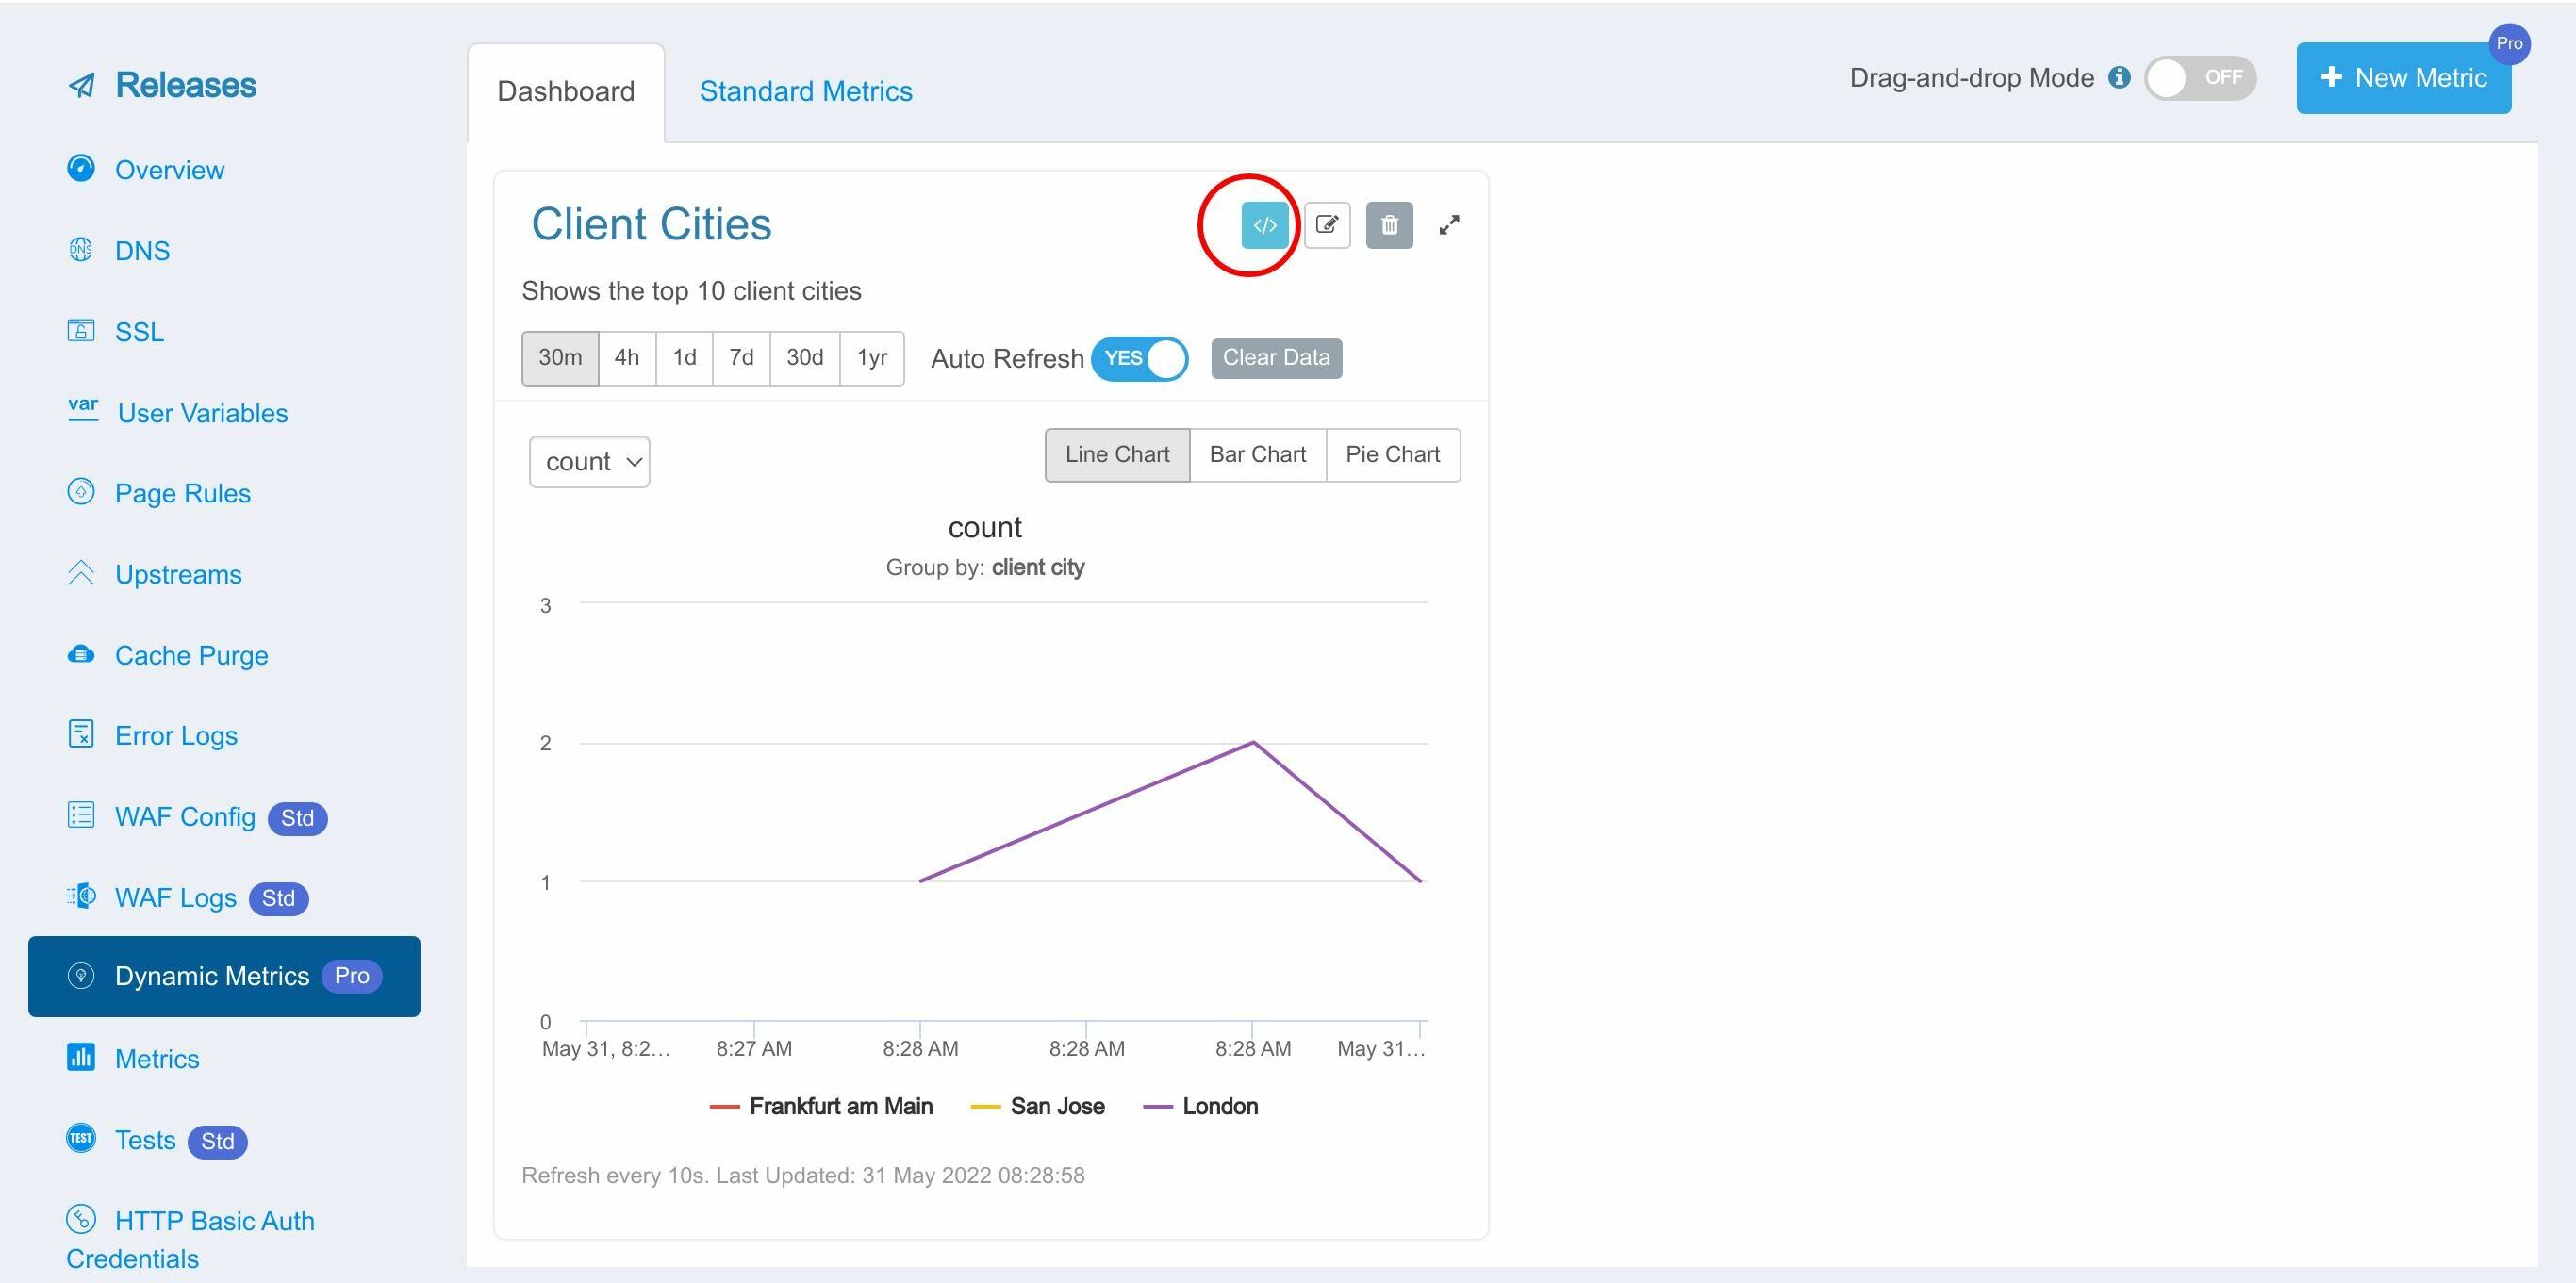
And also in a line chart.
It is what we’d expect.
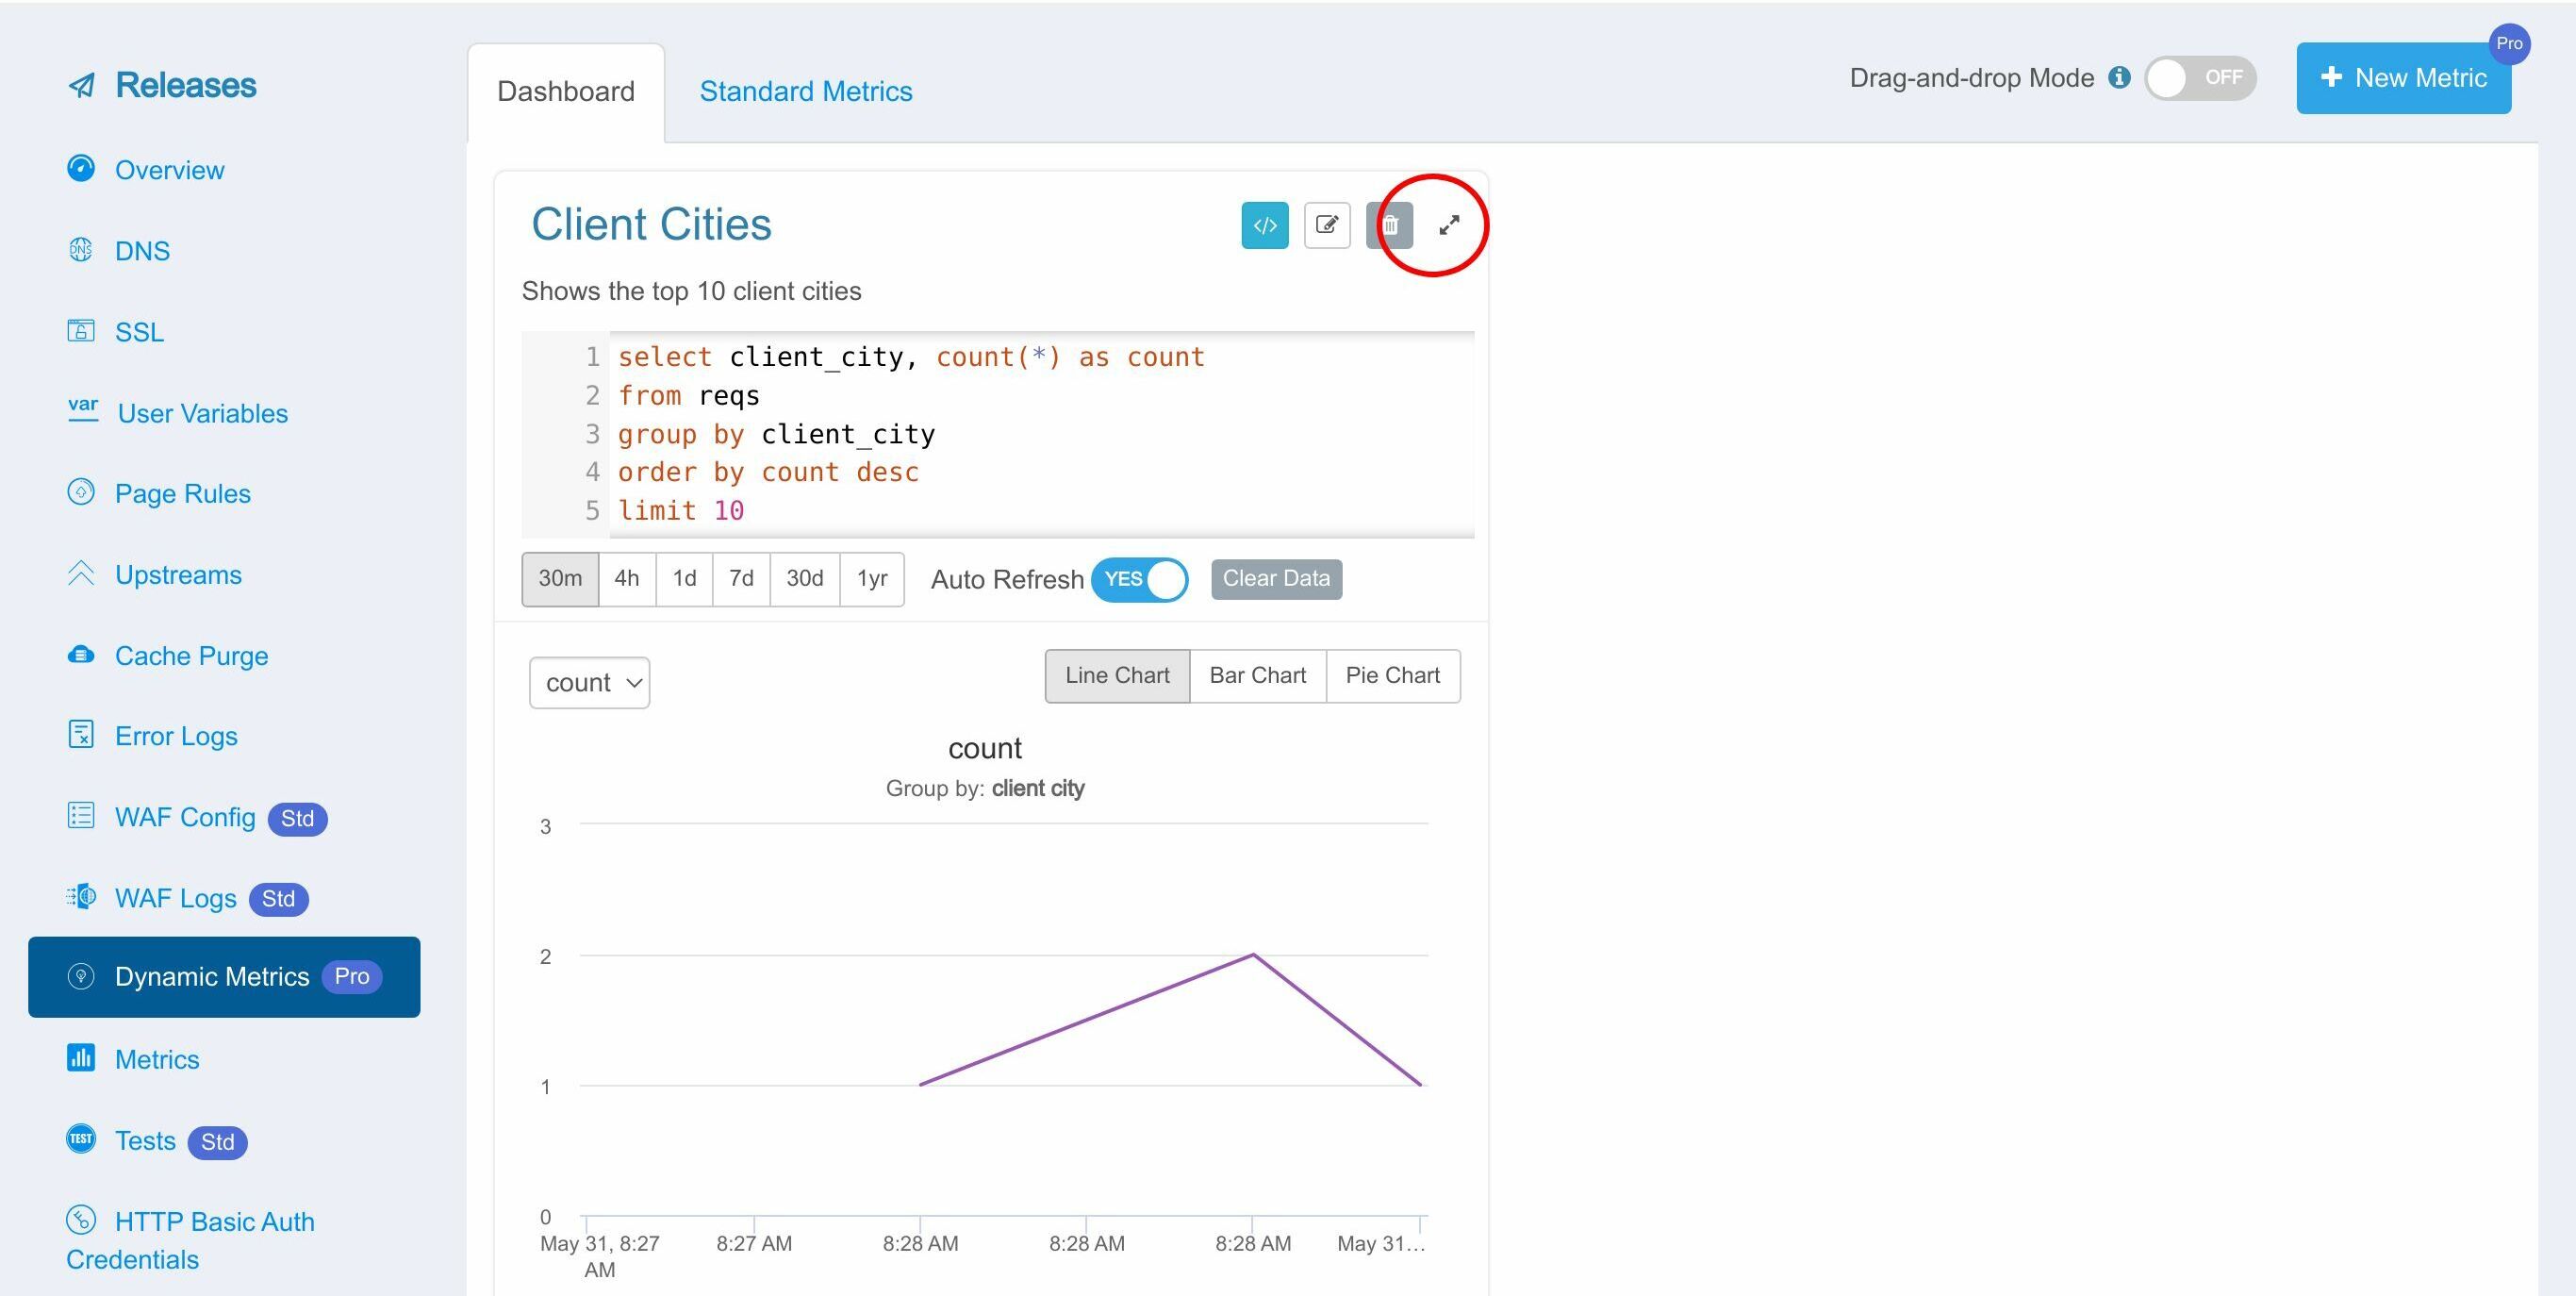
You can click this button to display the Metric SQL query for this dynamic metric on this card.
The Metric SQL statement is shown here.
You can edit the existing metric using the Edit button.
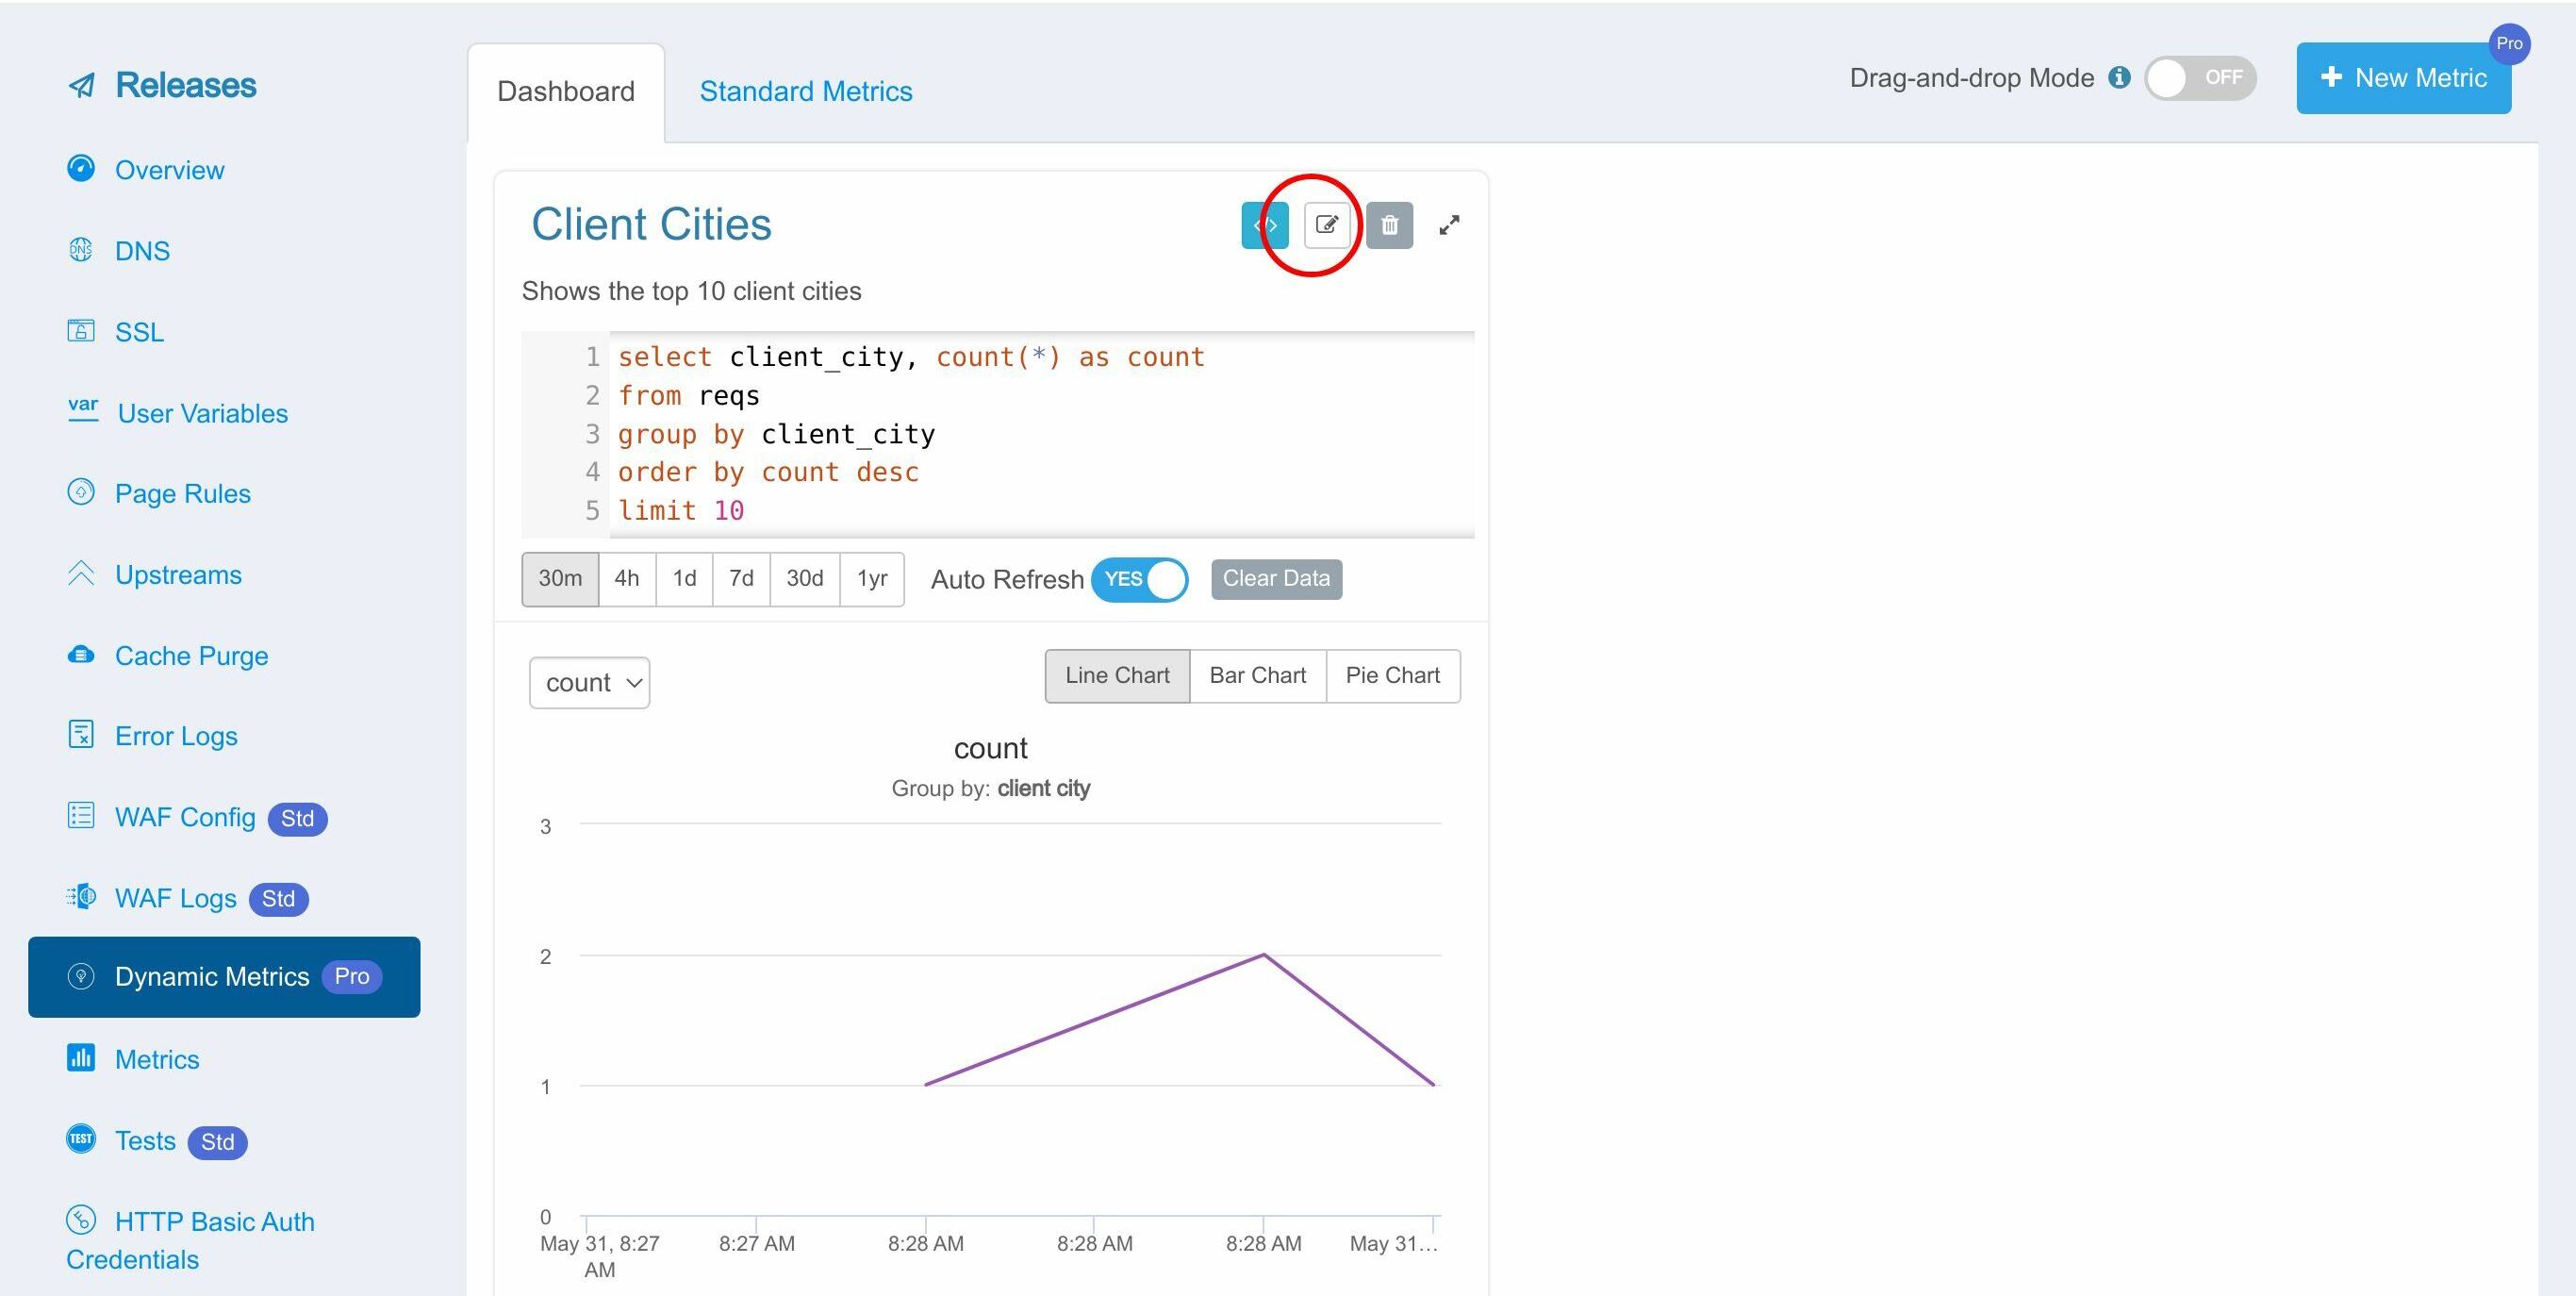
Or remove it using the Delete button.

If you think the chart is too small, click the expand button to display it in a larger window.
We can display metrics for different time intervals, from 1 minute to 1 year.
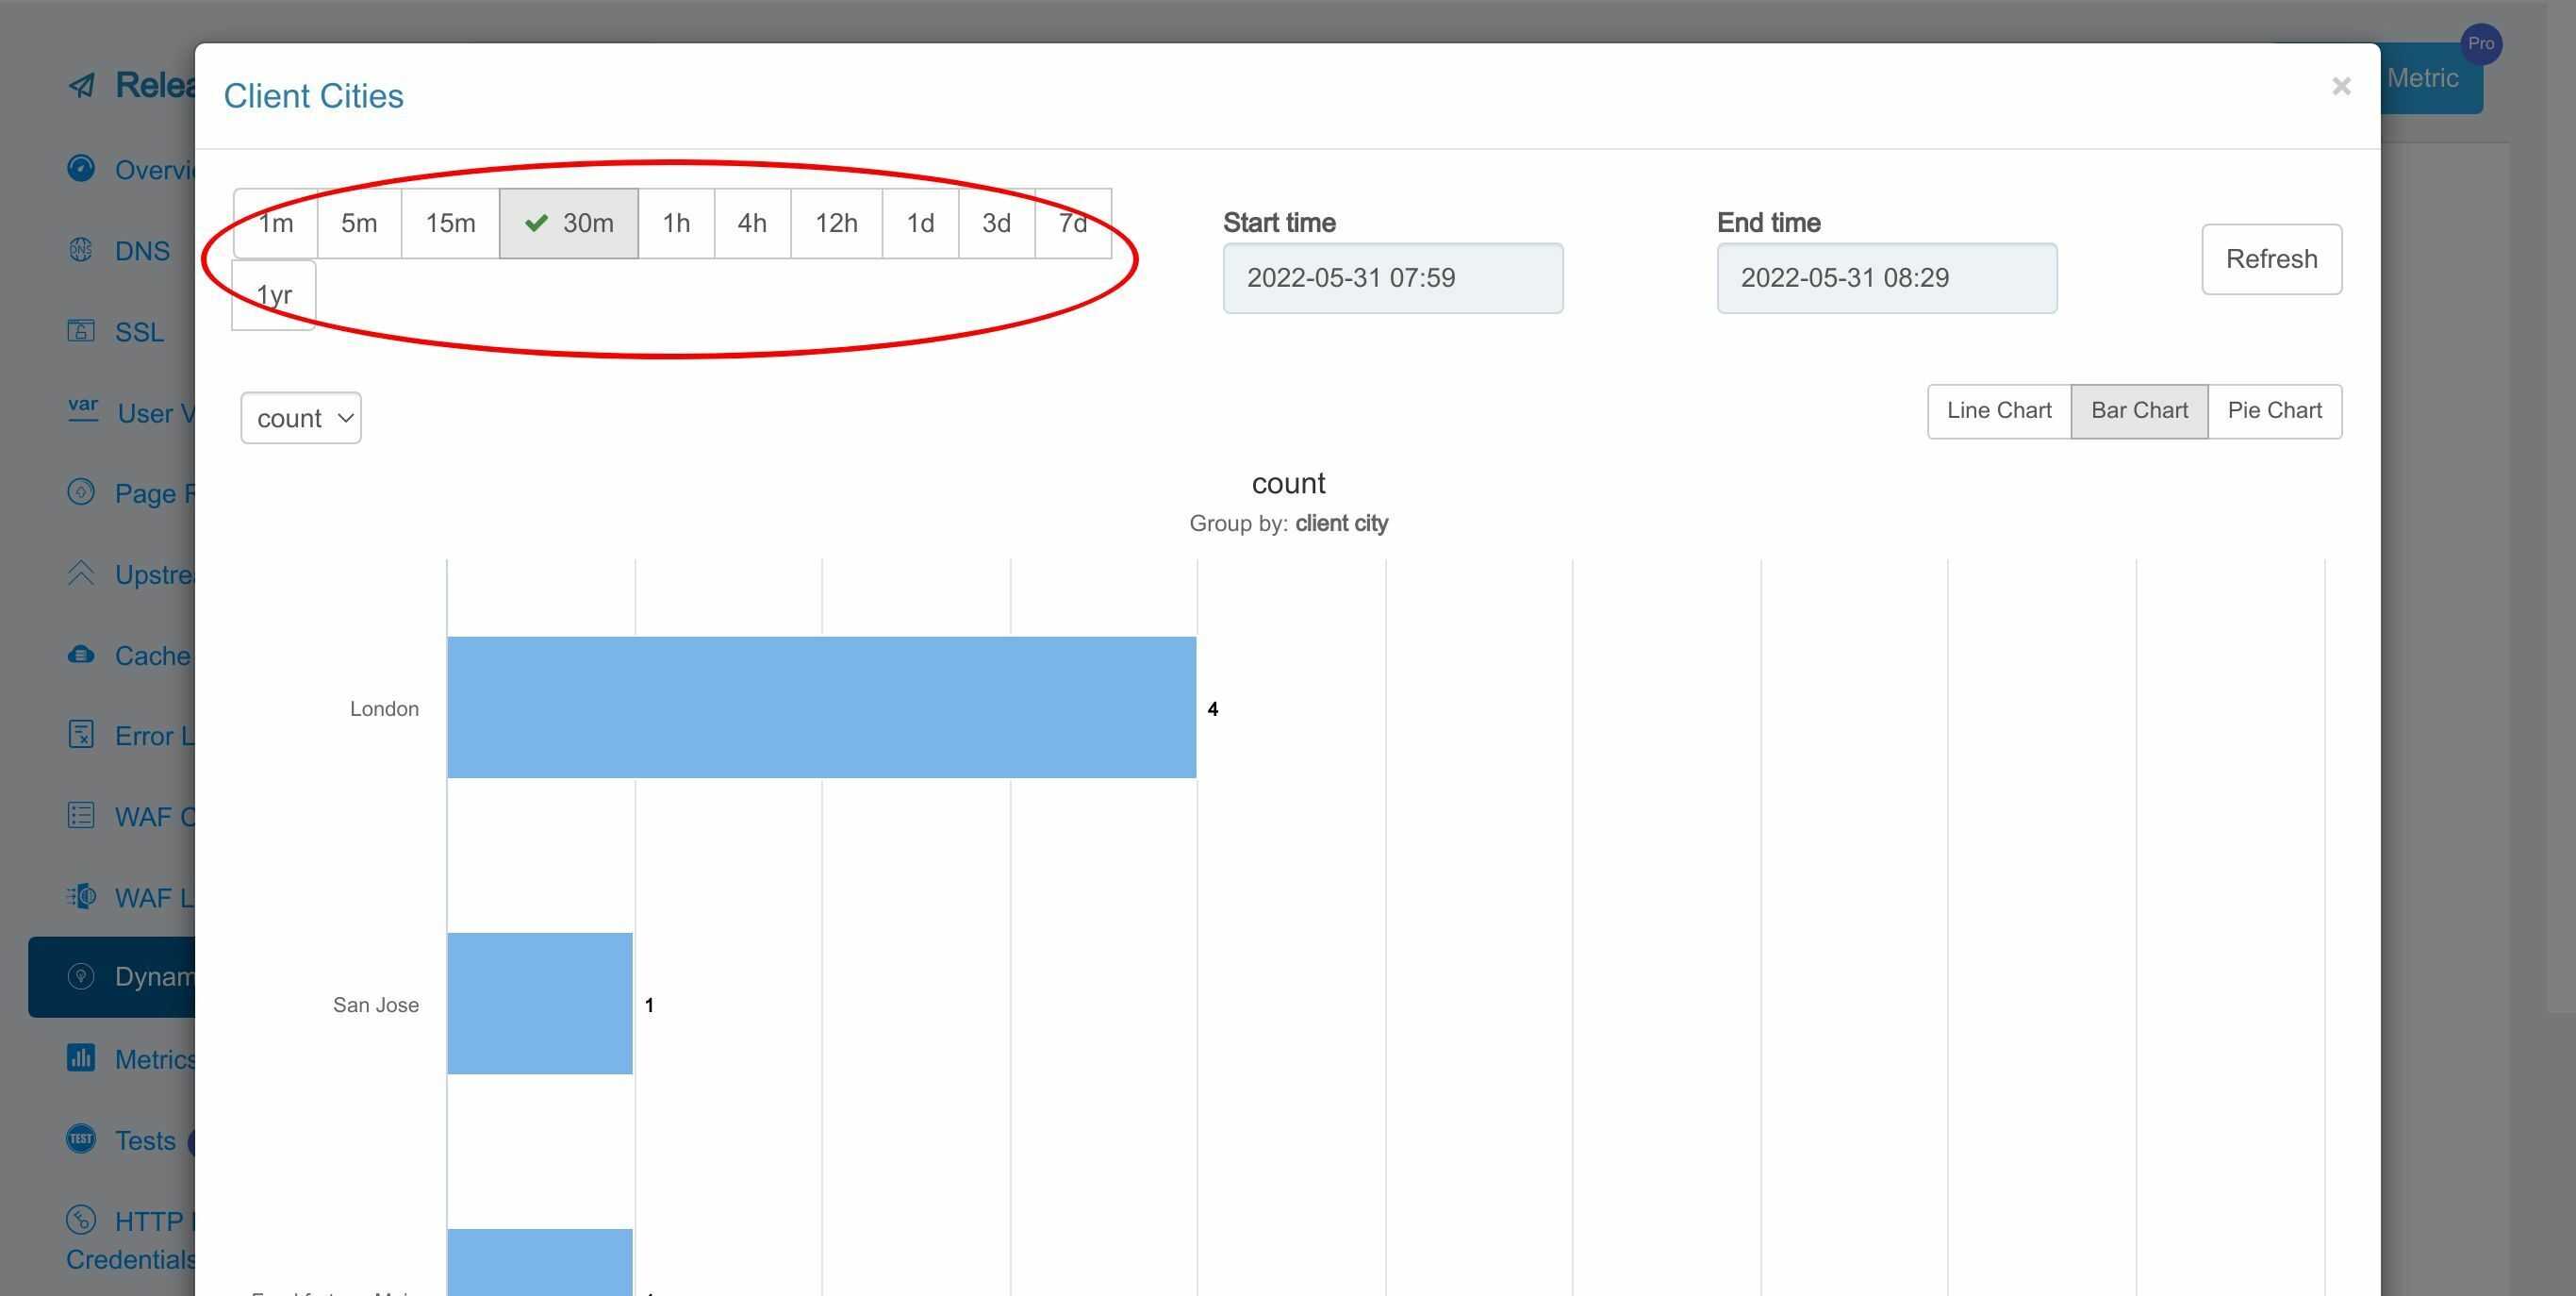
Or just select an arbitrary time interval.

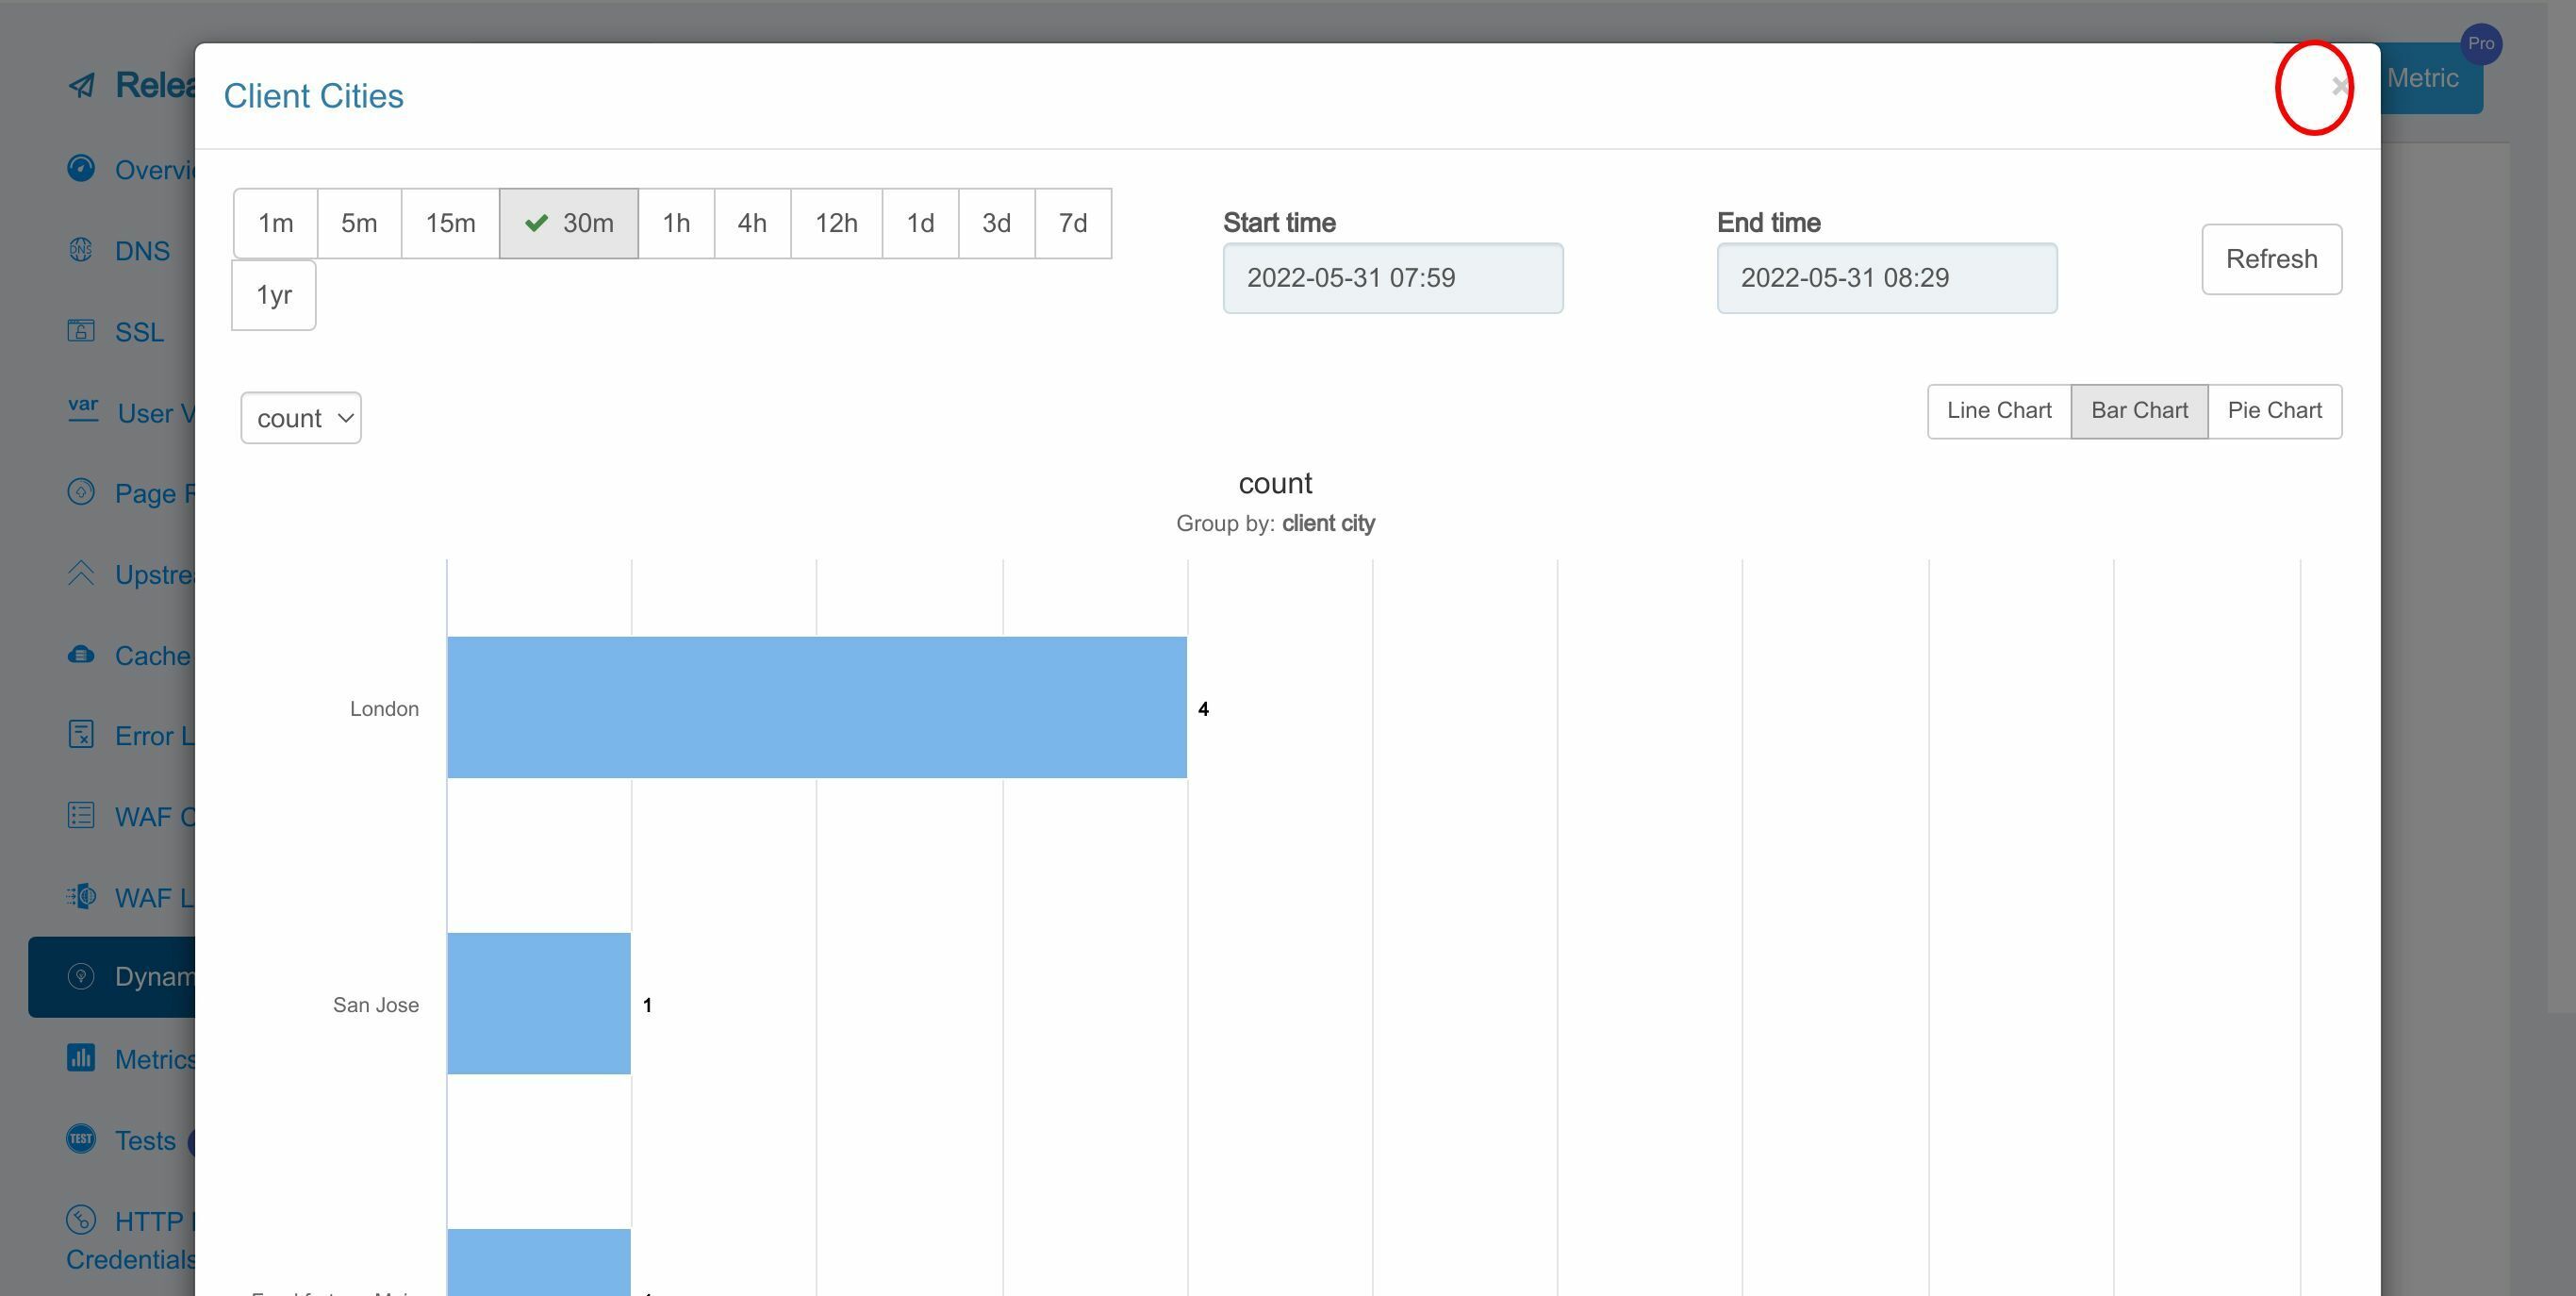
Click the Close button to shut this larger window.
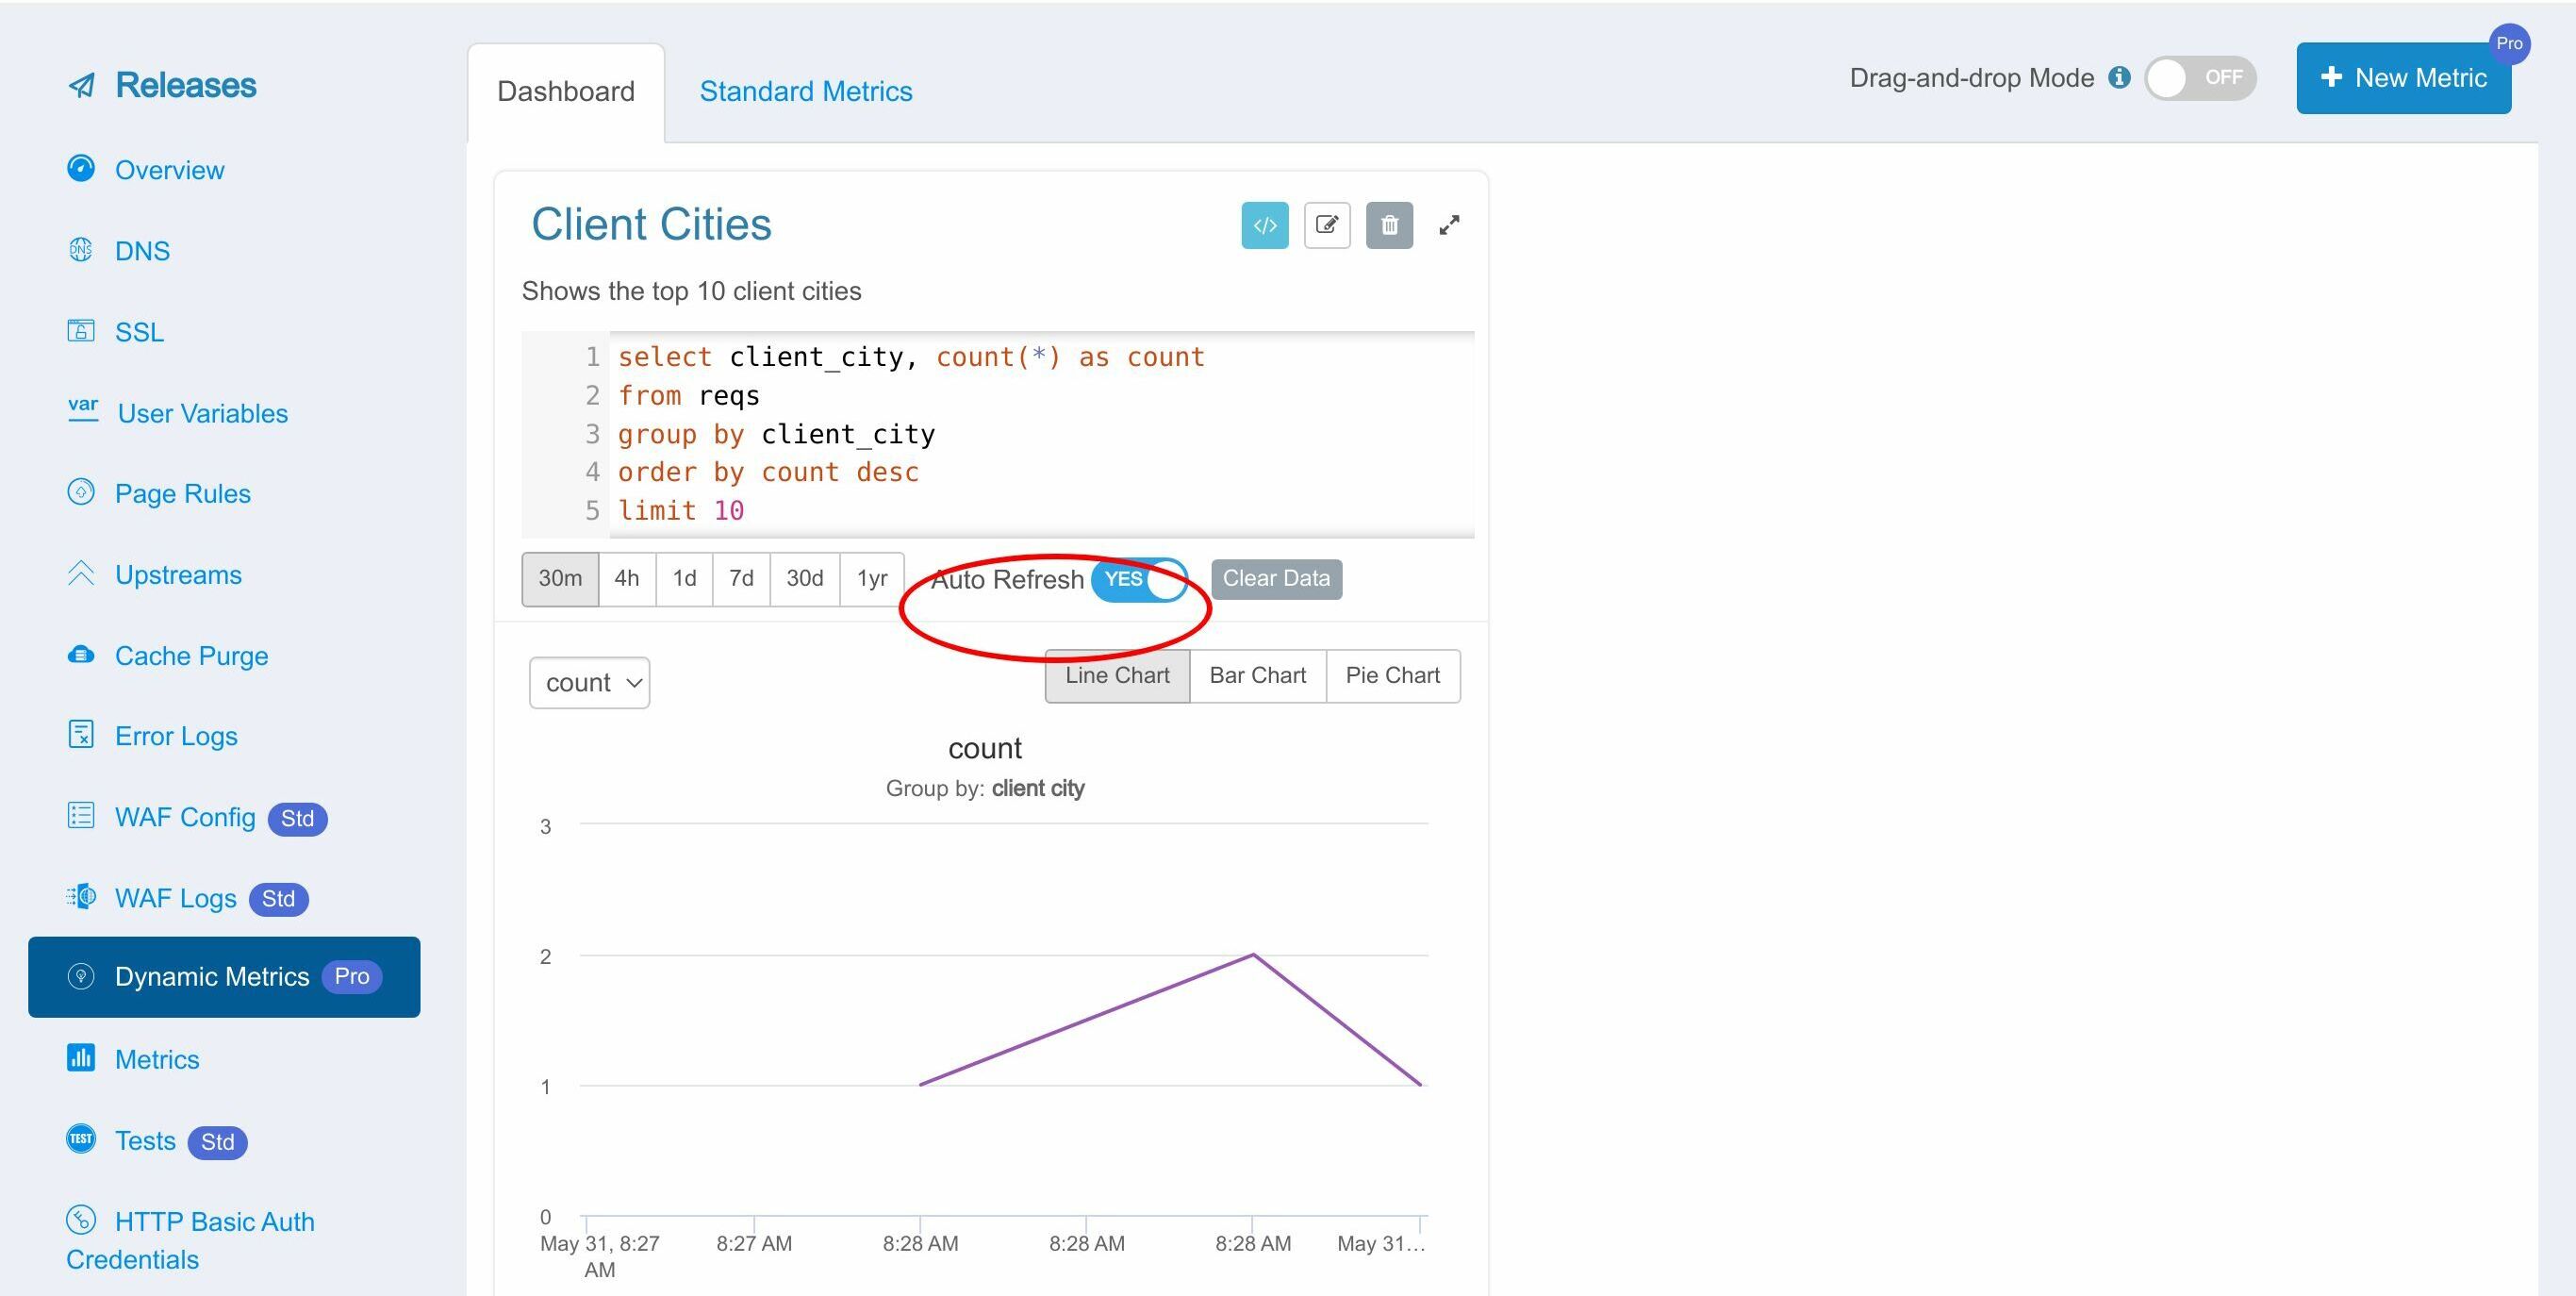
There are also time range options on the main card. The options are fewer.
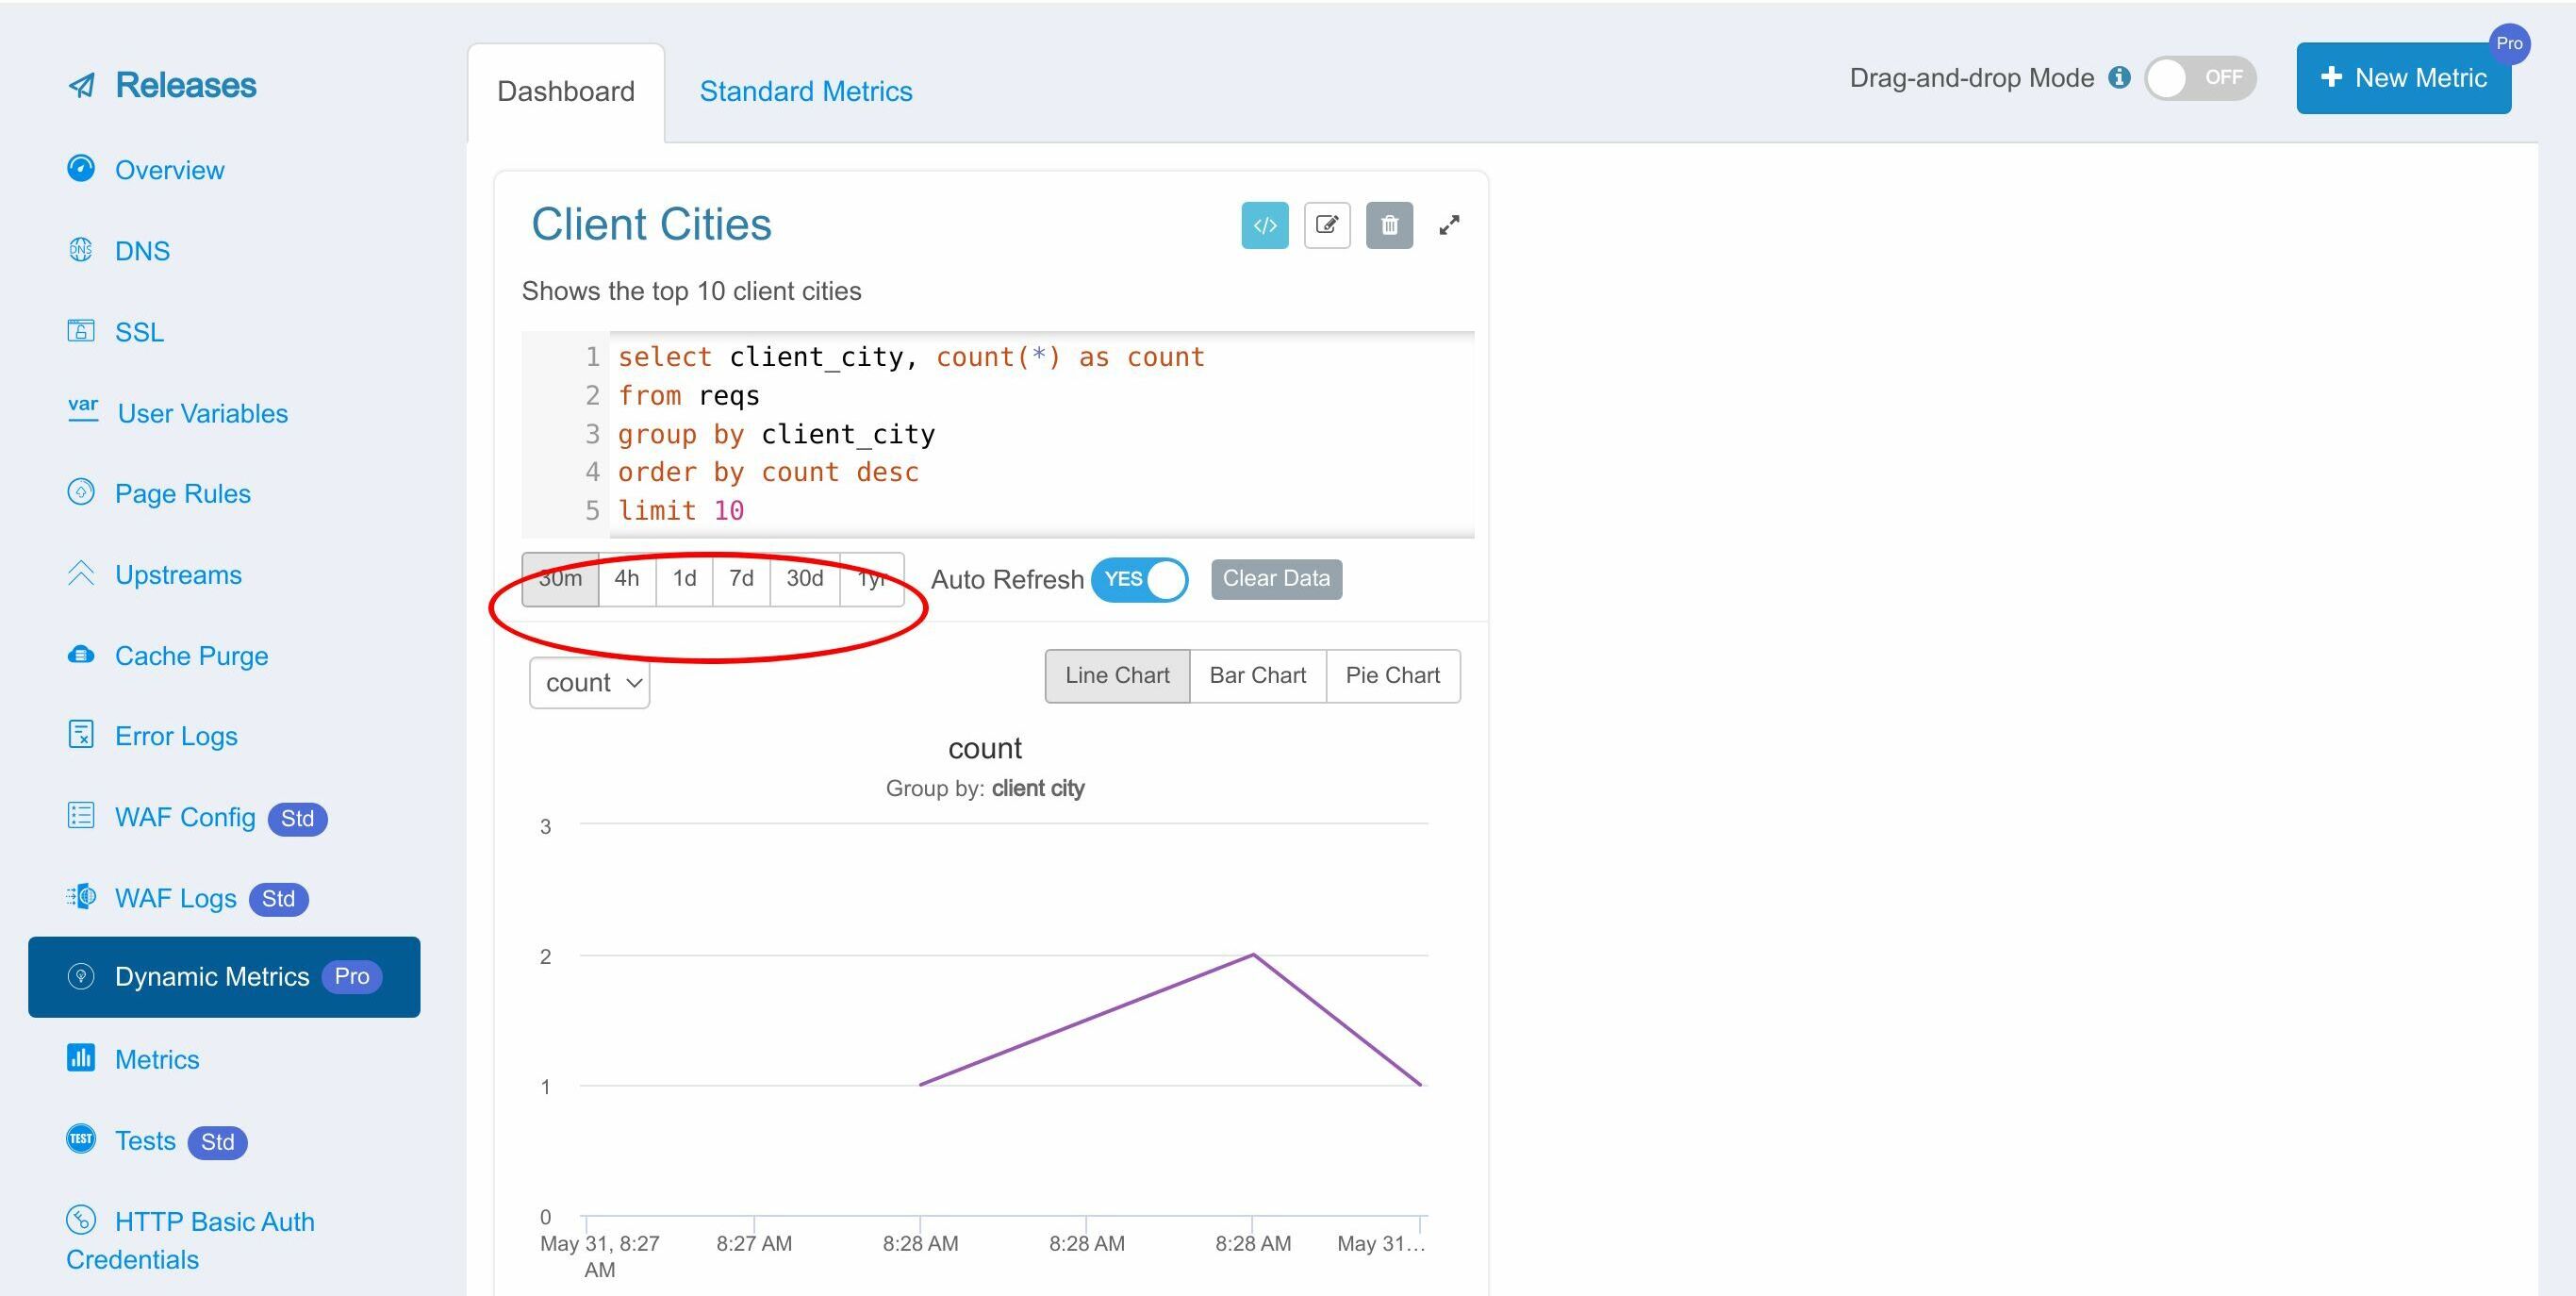
When enabling Auto Refresh, the metric is updated automatically with the ten-second interval we previously specified.
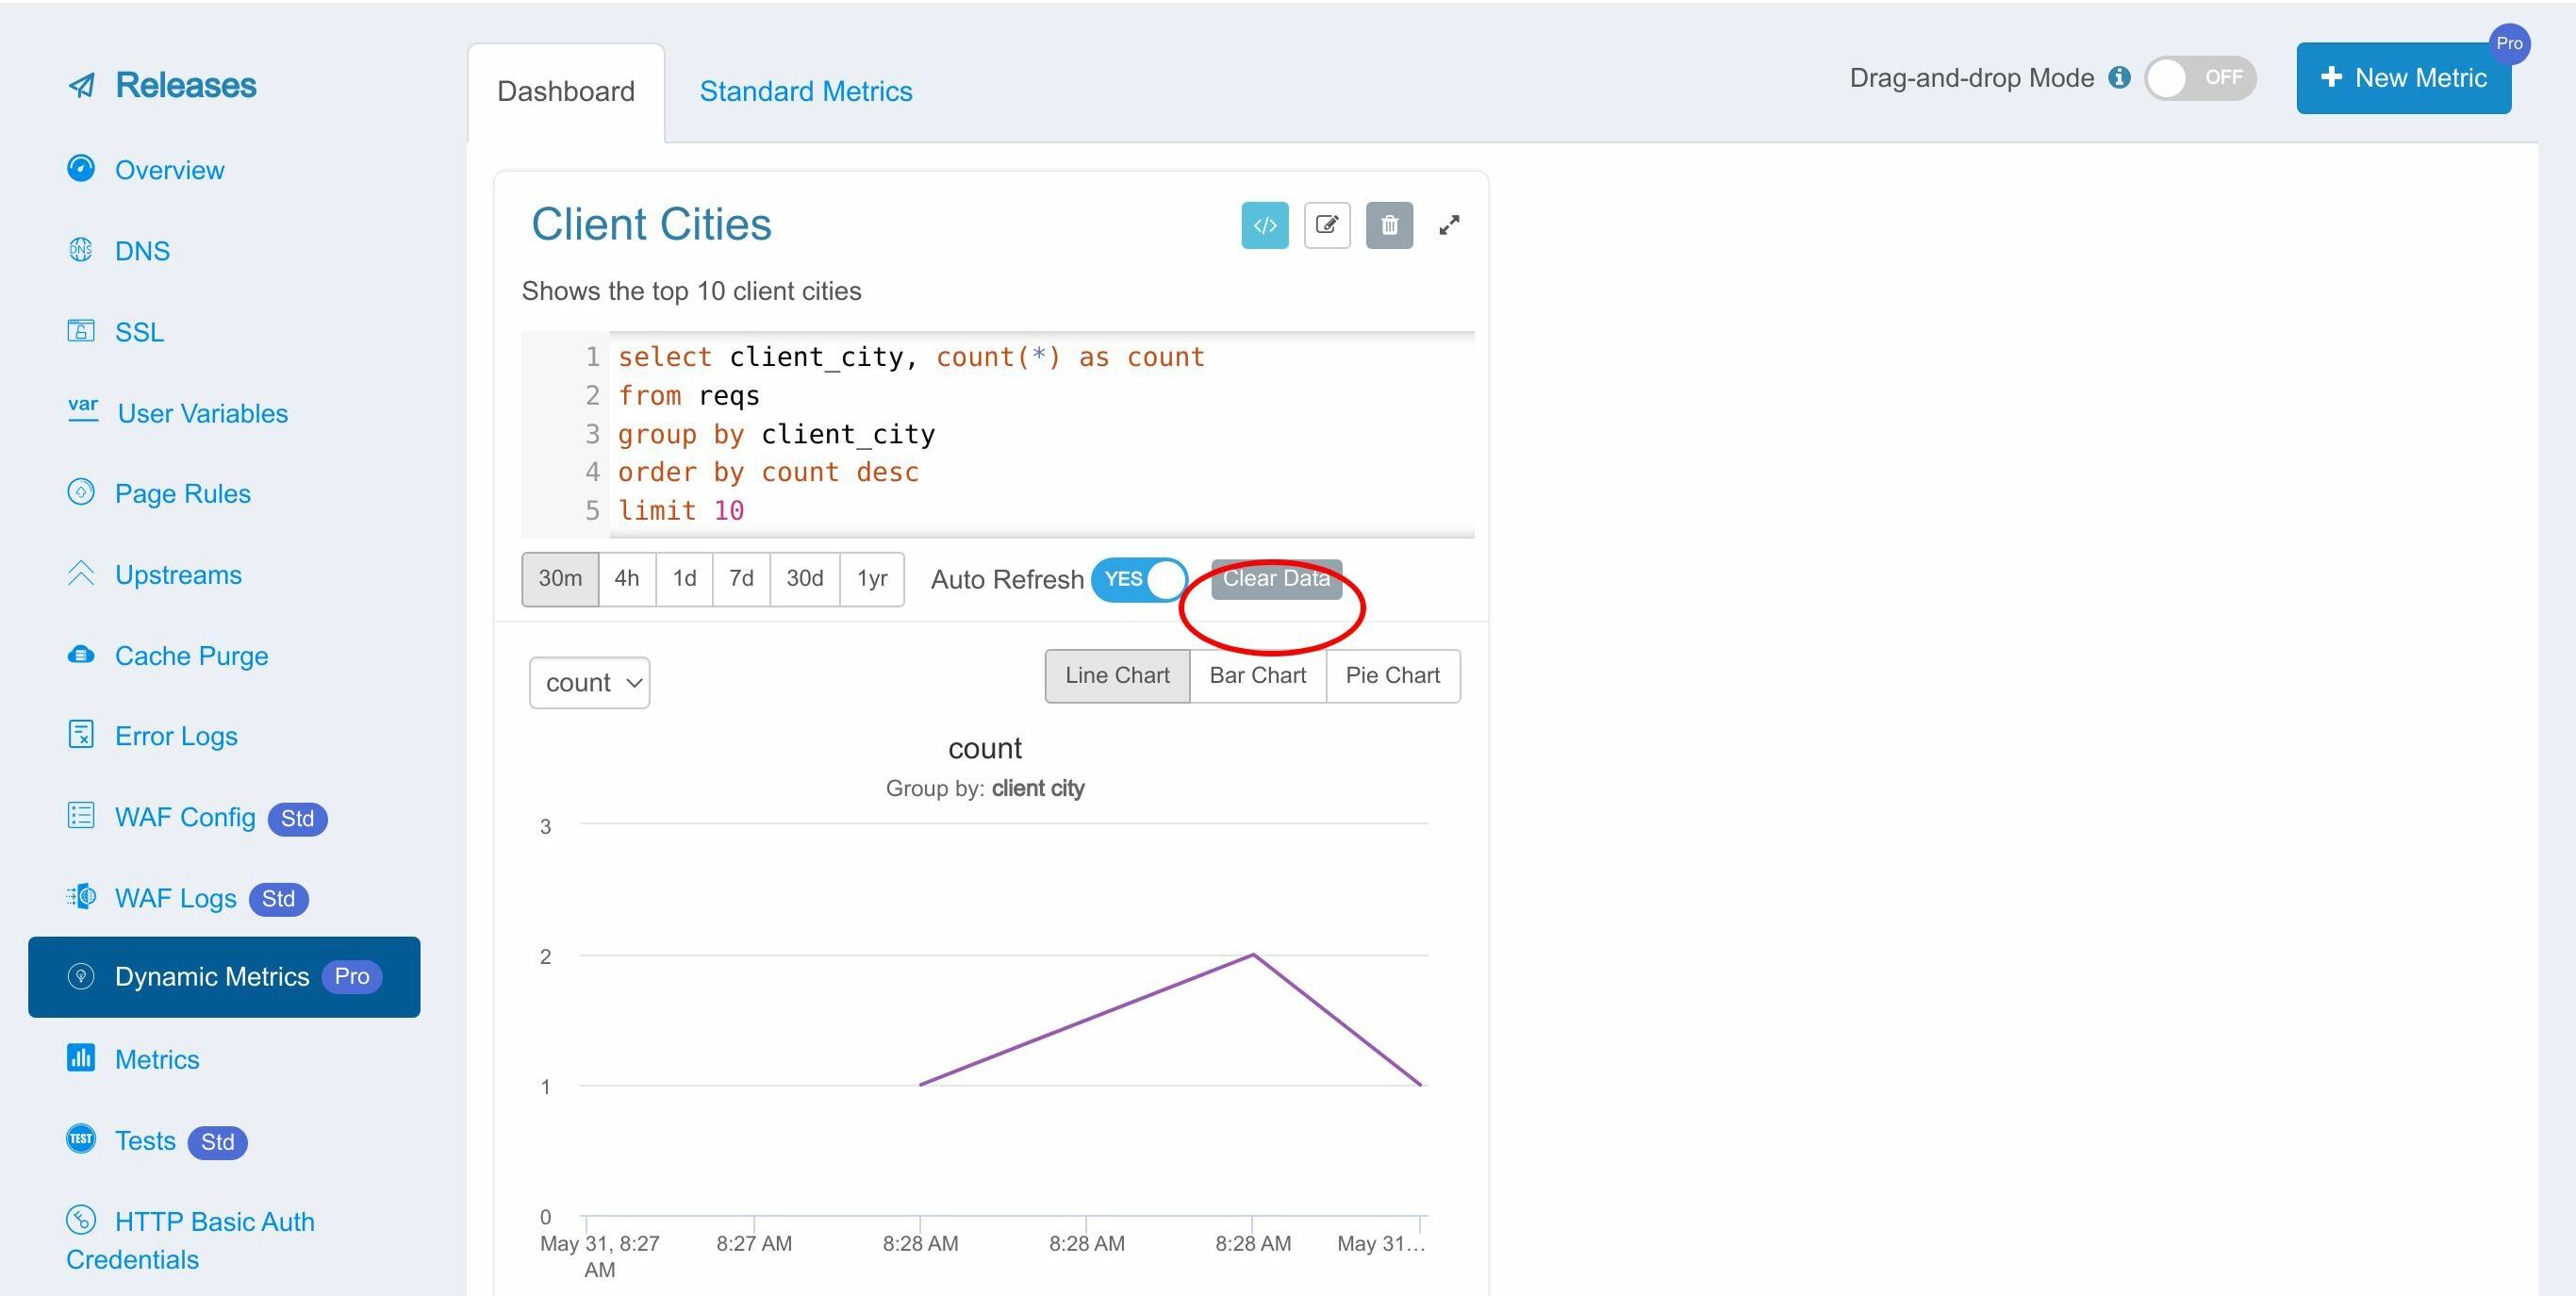
The “Clear Data” button is for clearing all the historical data and restarting the data collection.
Now let’s check out some dynamic metrics using real traffic. We’ll use one of our own websites powered by OpenResty Edge.
Type openresty.org into the search box.
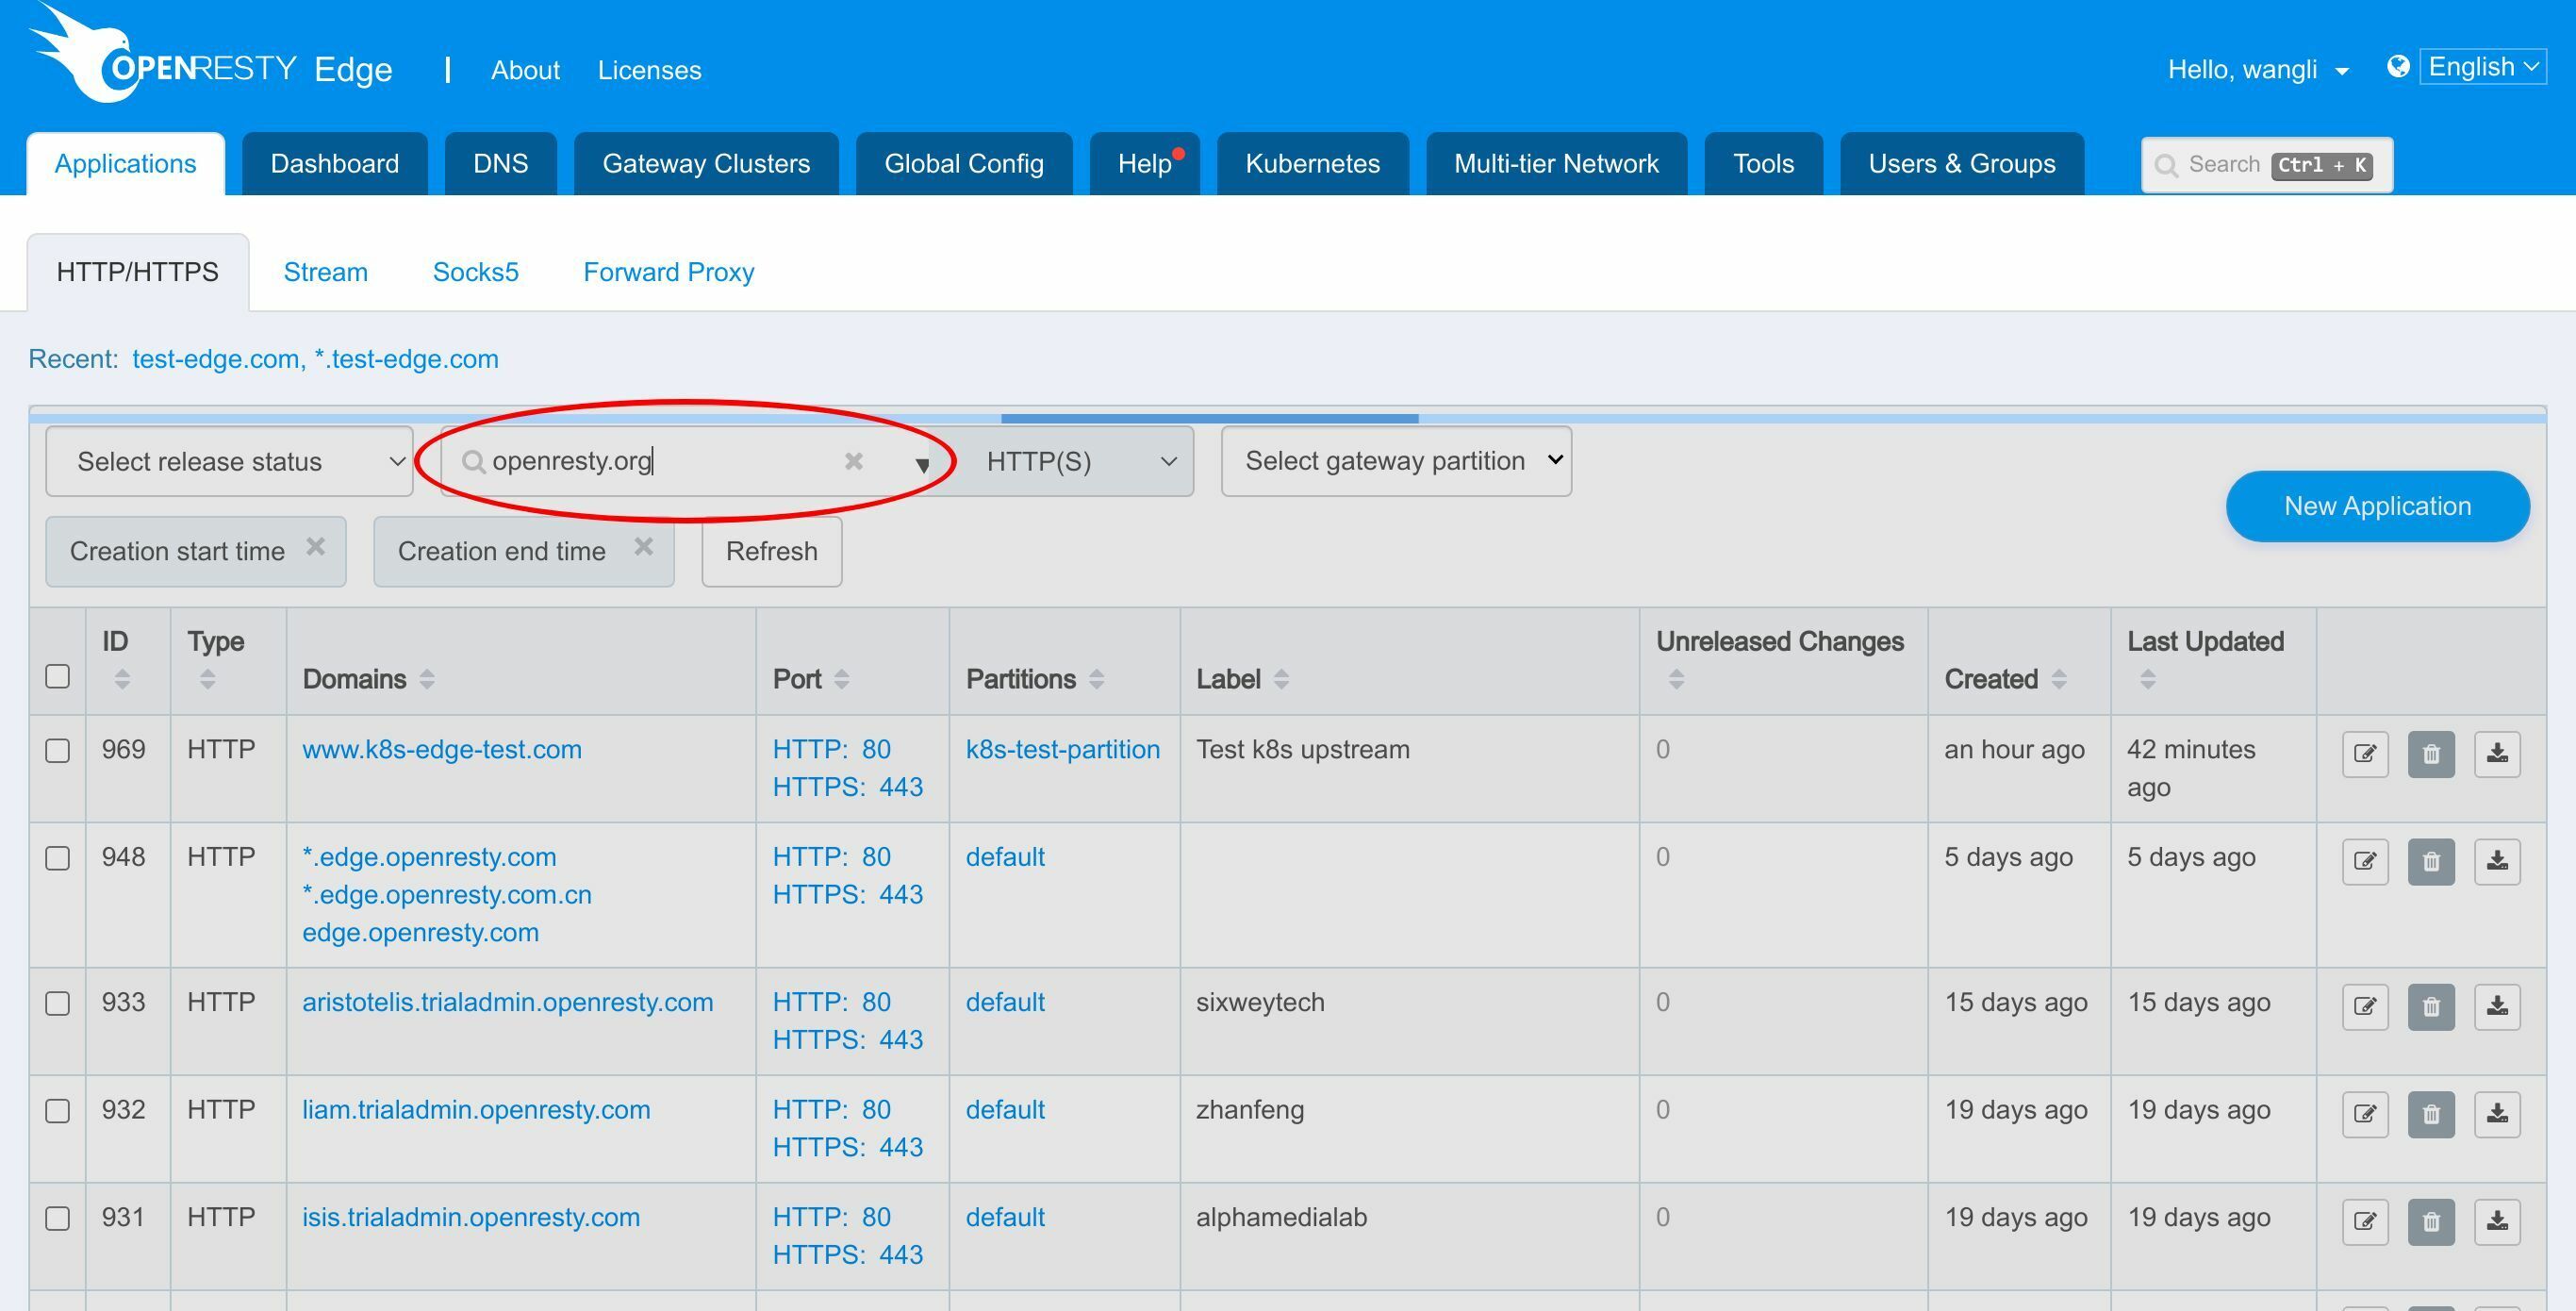
Enter this application.

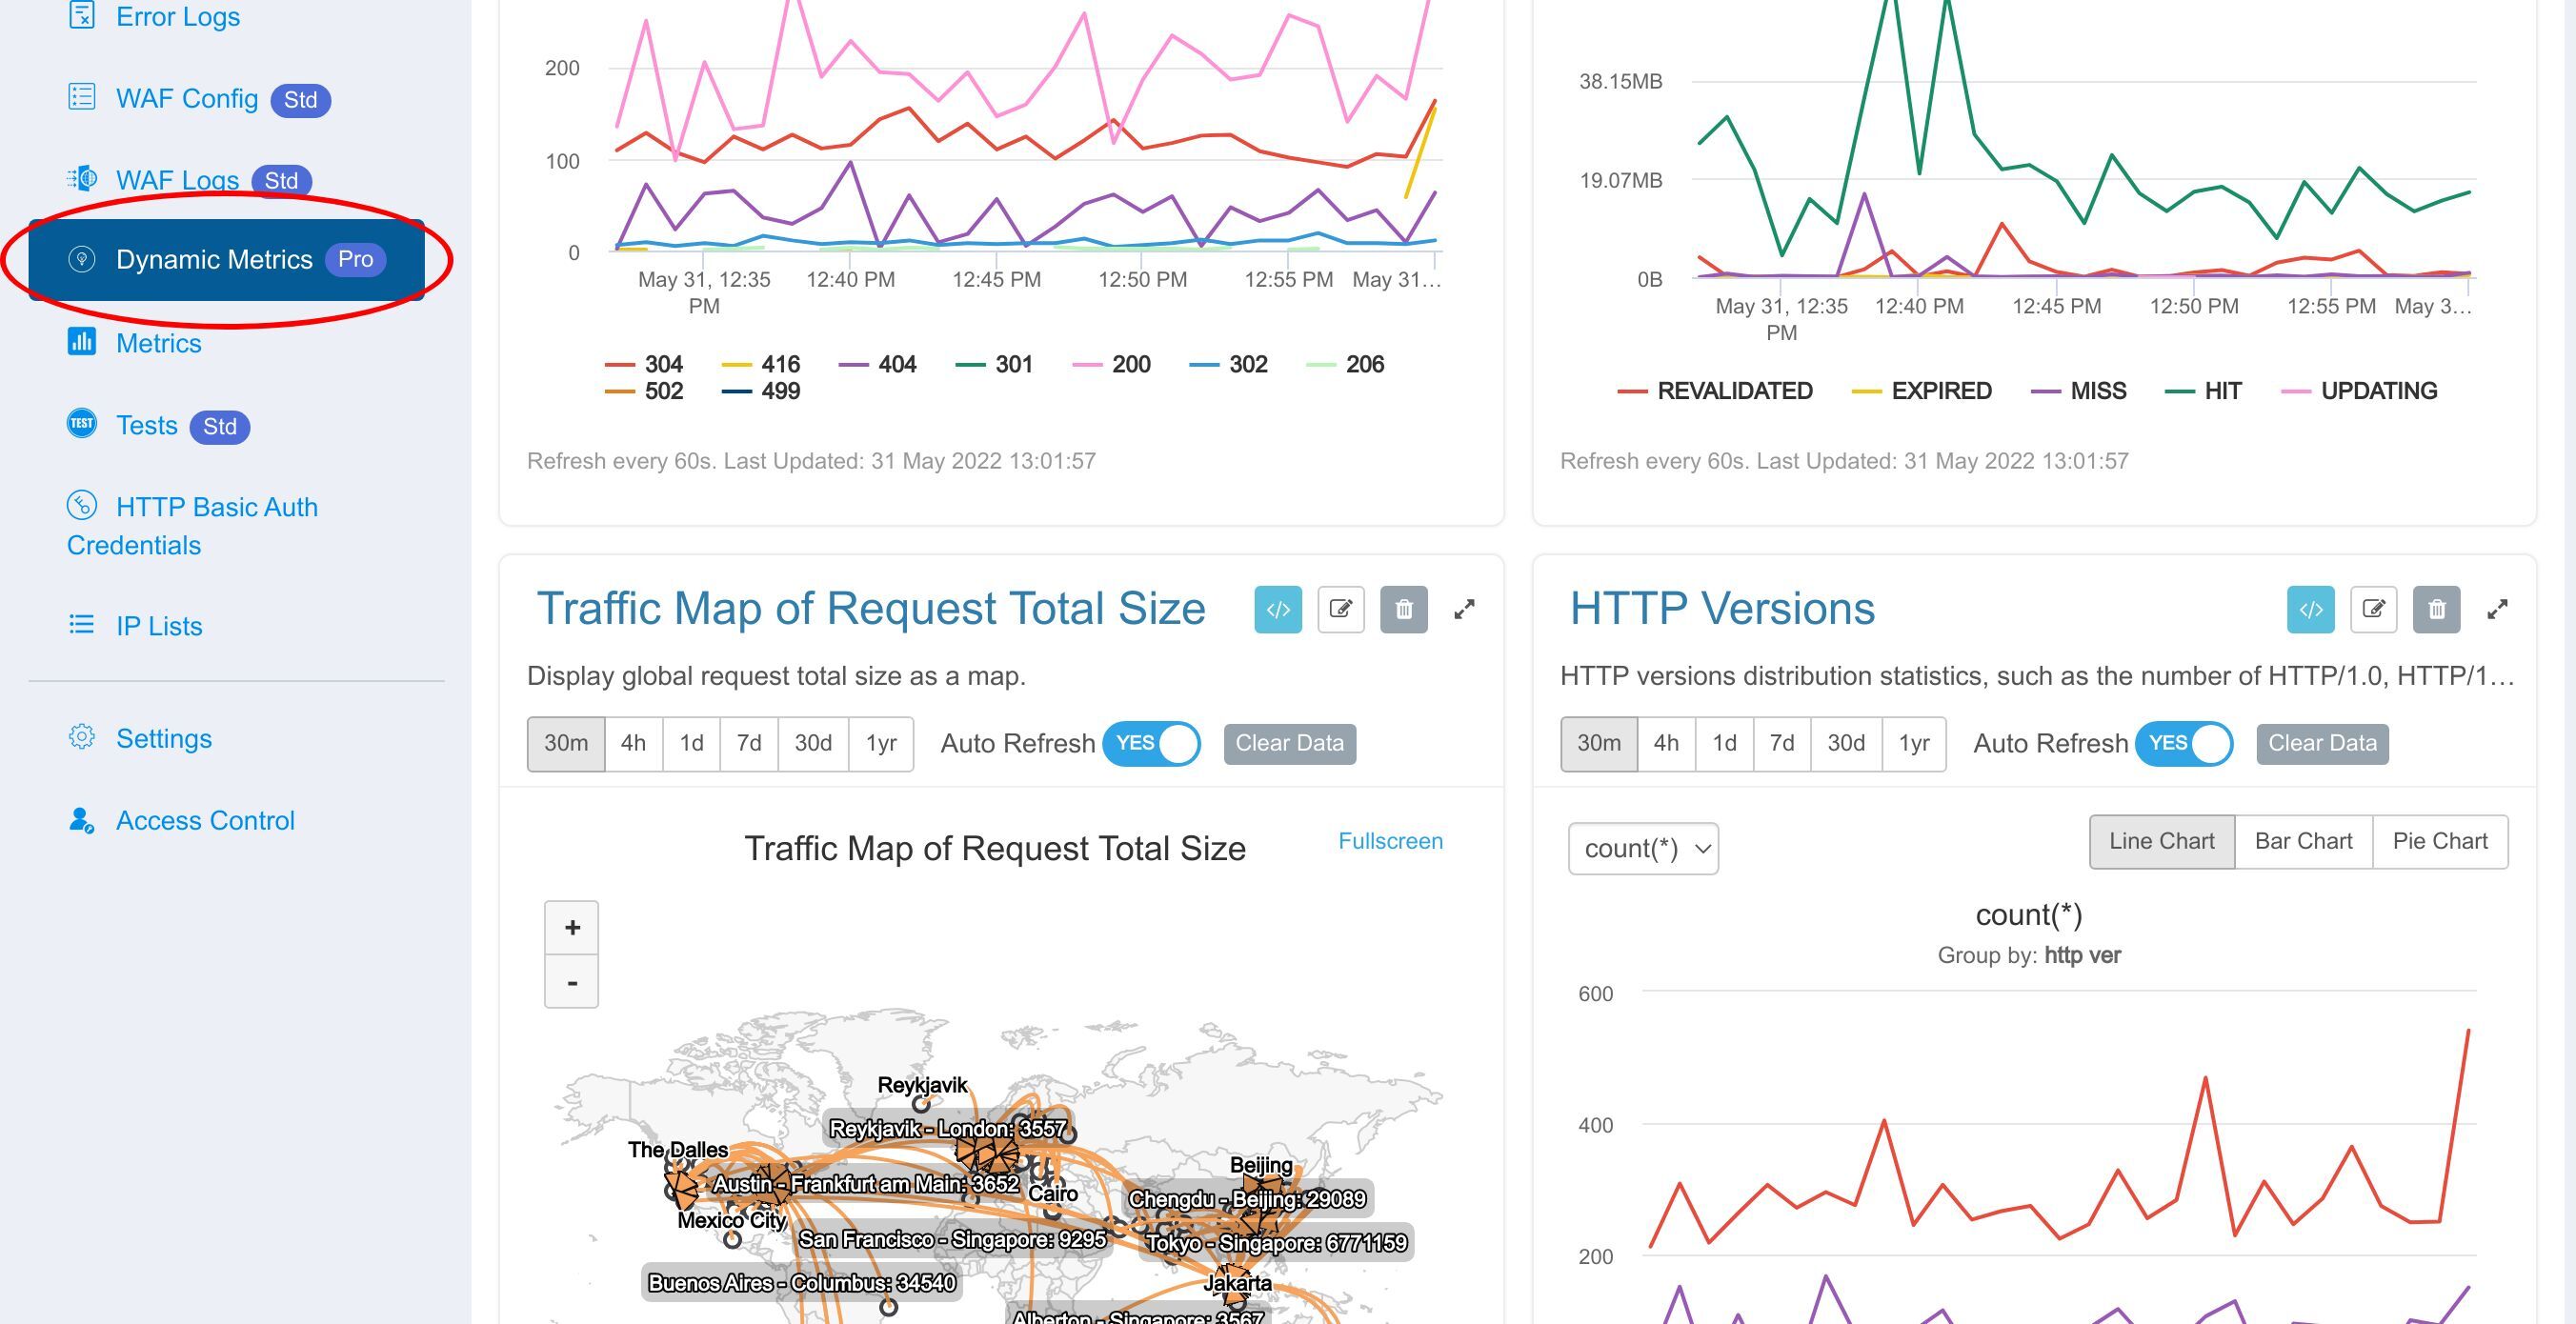
Enter the Dynamic Metrics page.
Many custom dynamic metrics already exist here. The data is displayed in various ways, like pie charts, bar charts, and line charts.
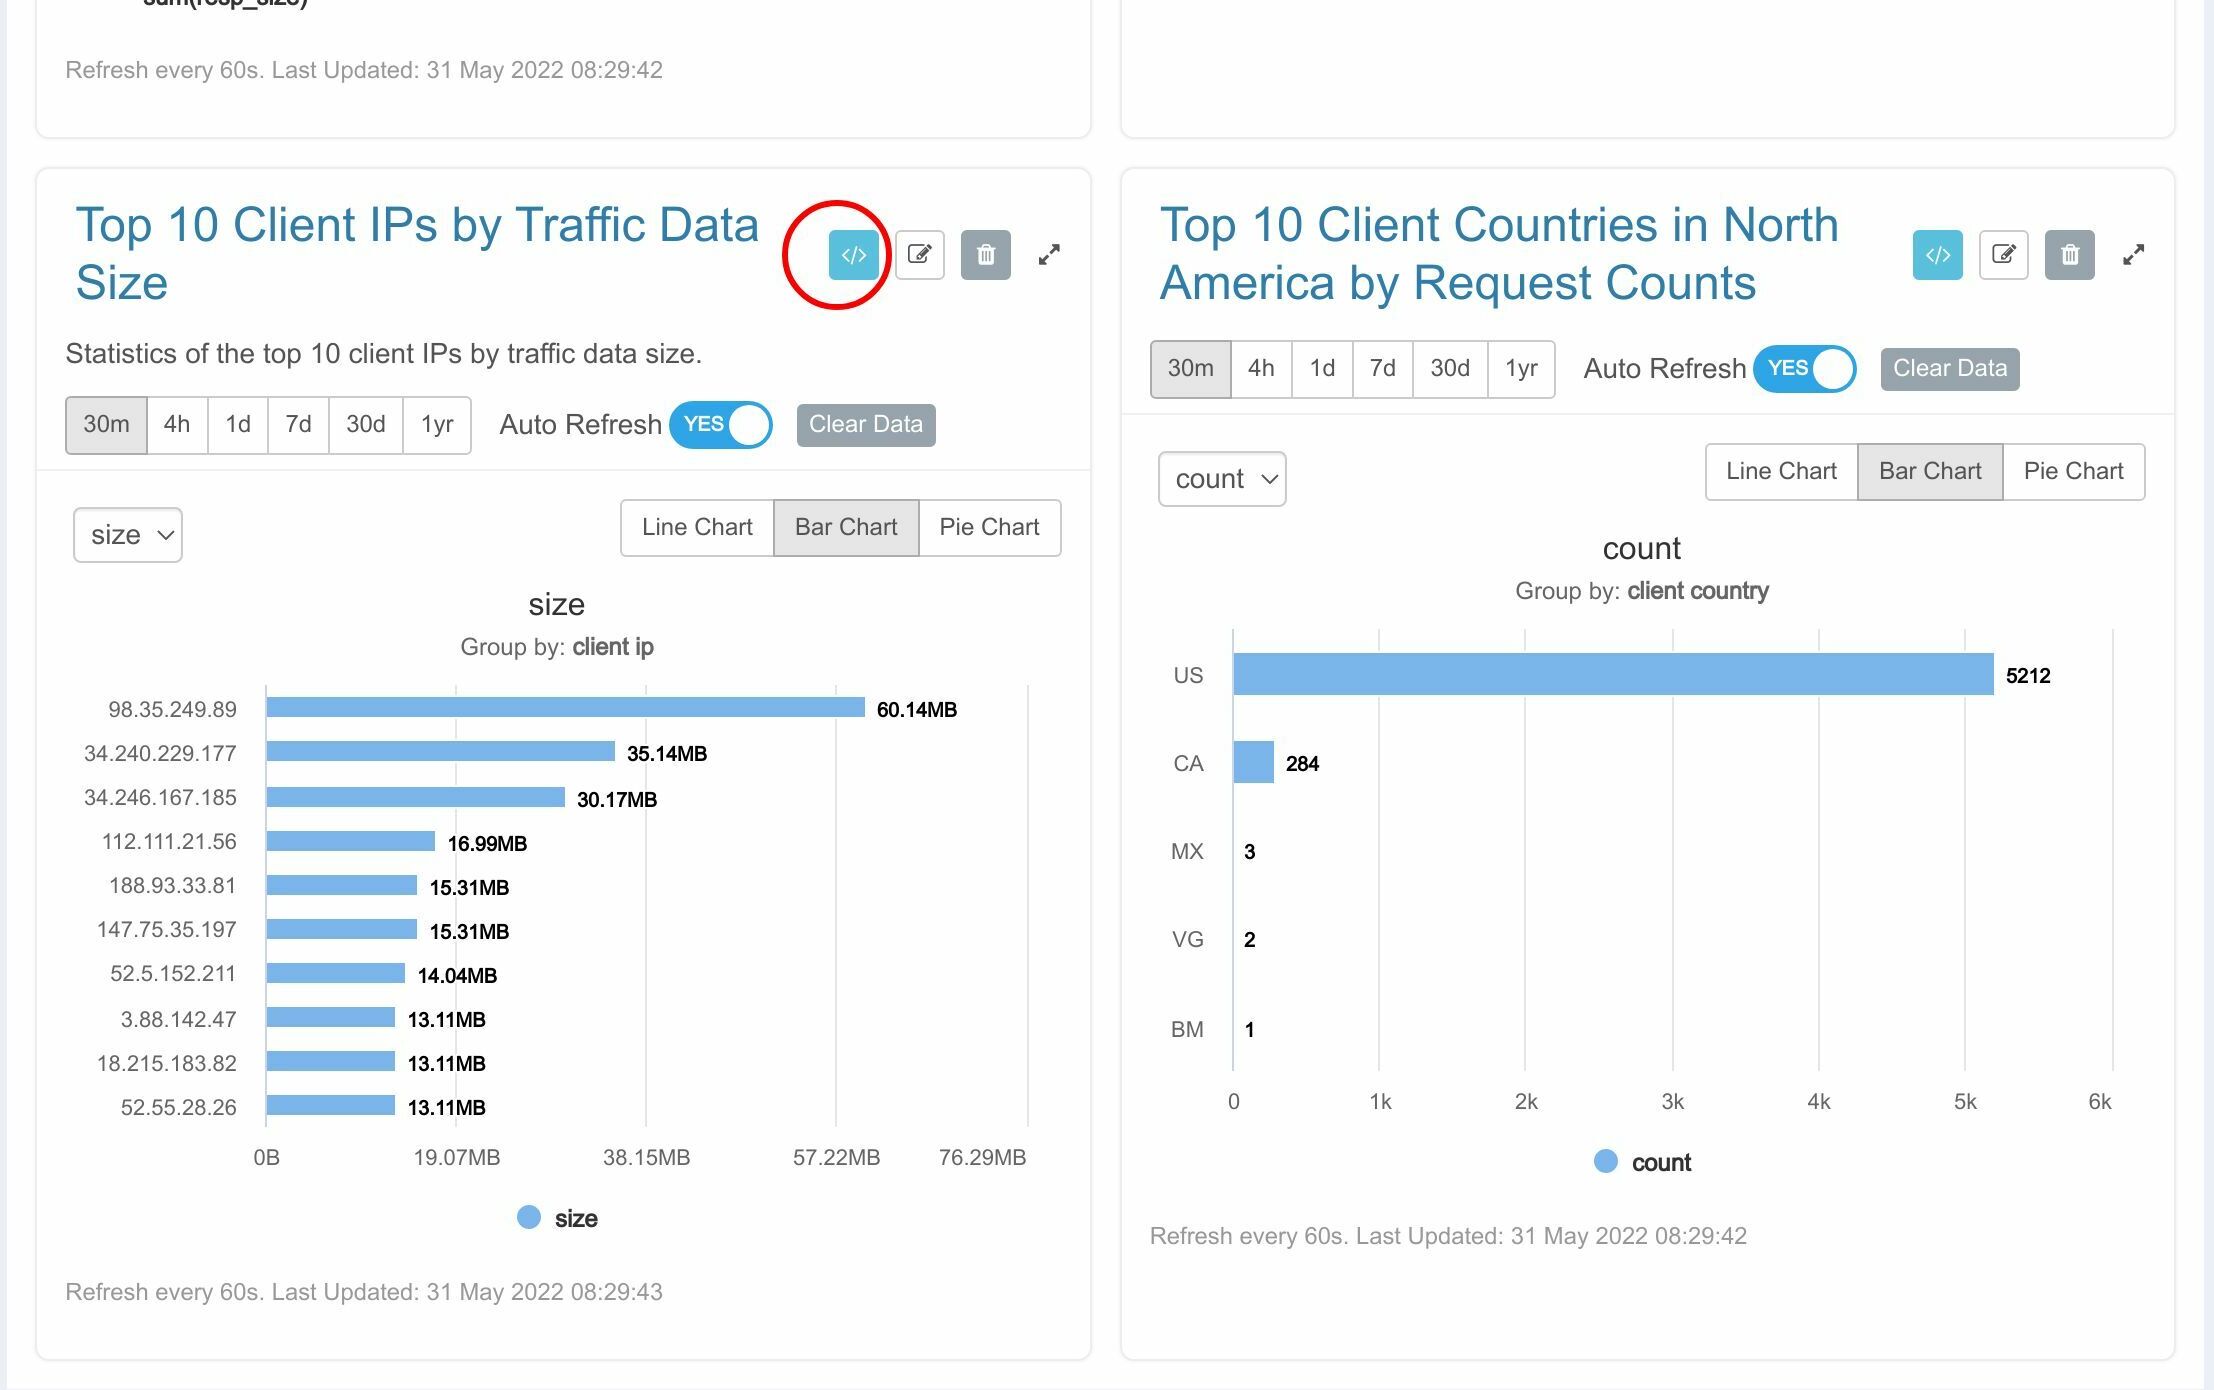
This one looks interesting. It shows all the requests grouped by the client IP addresses.
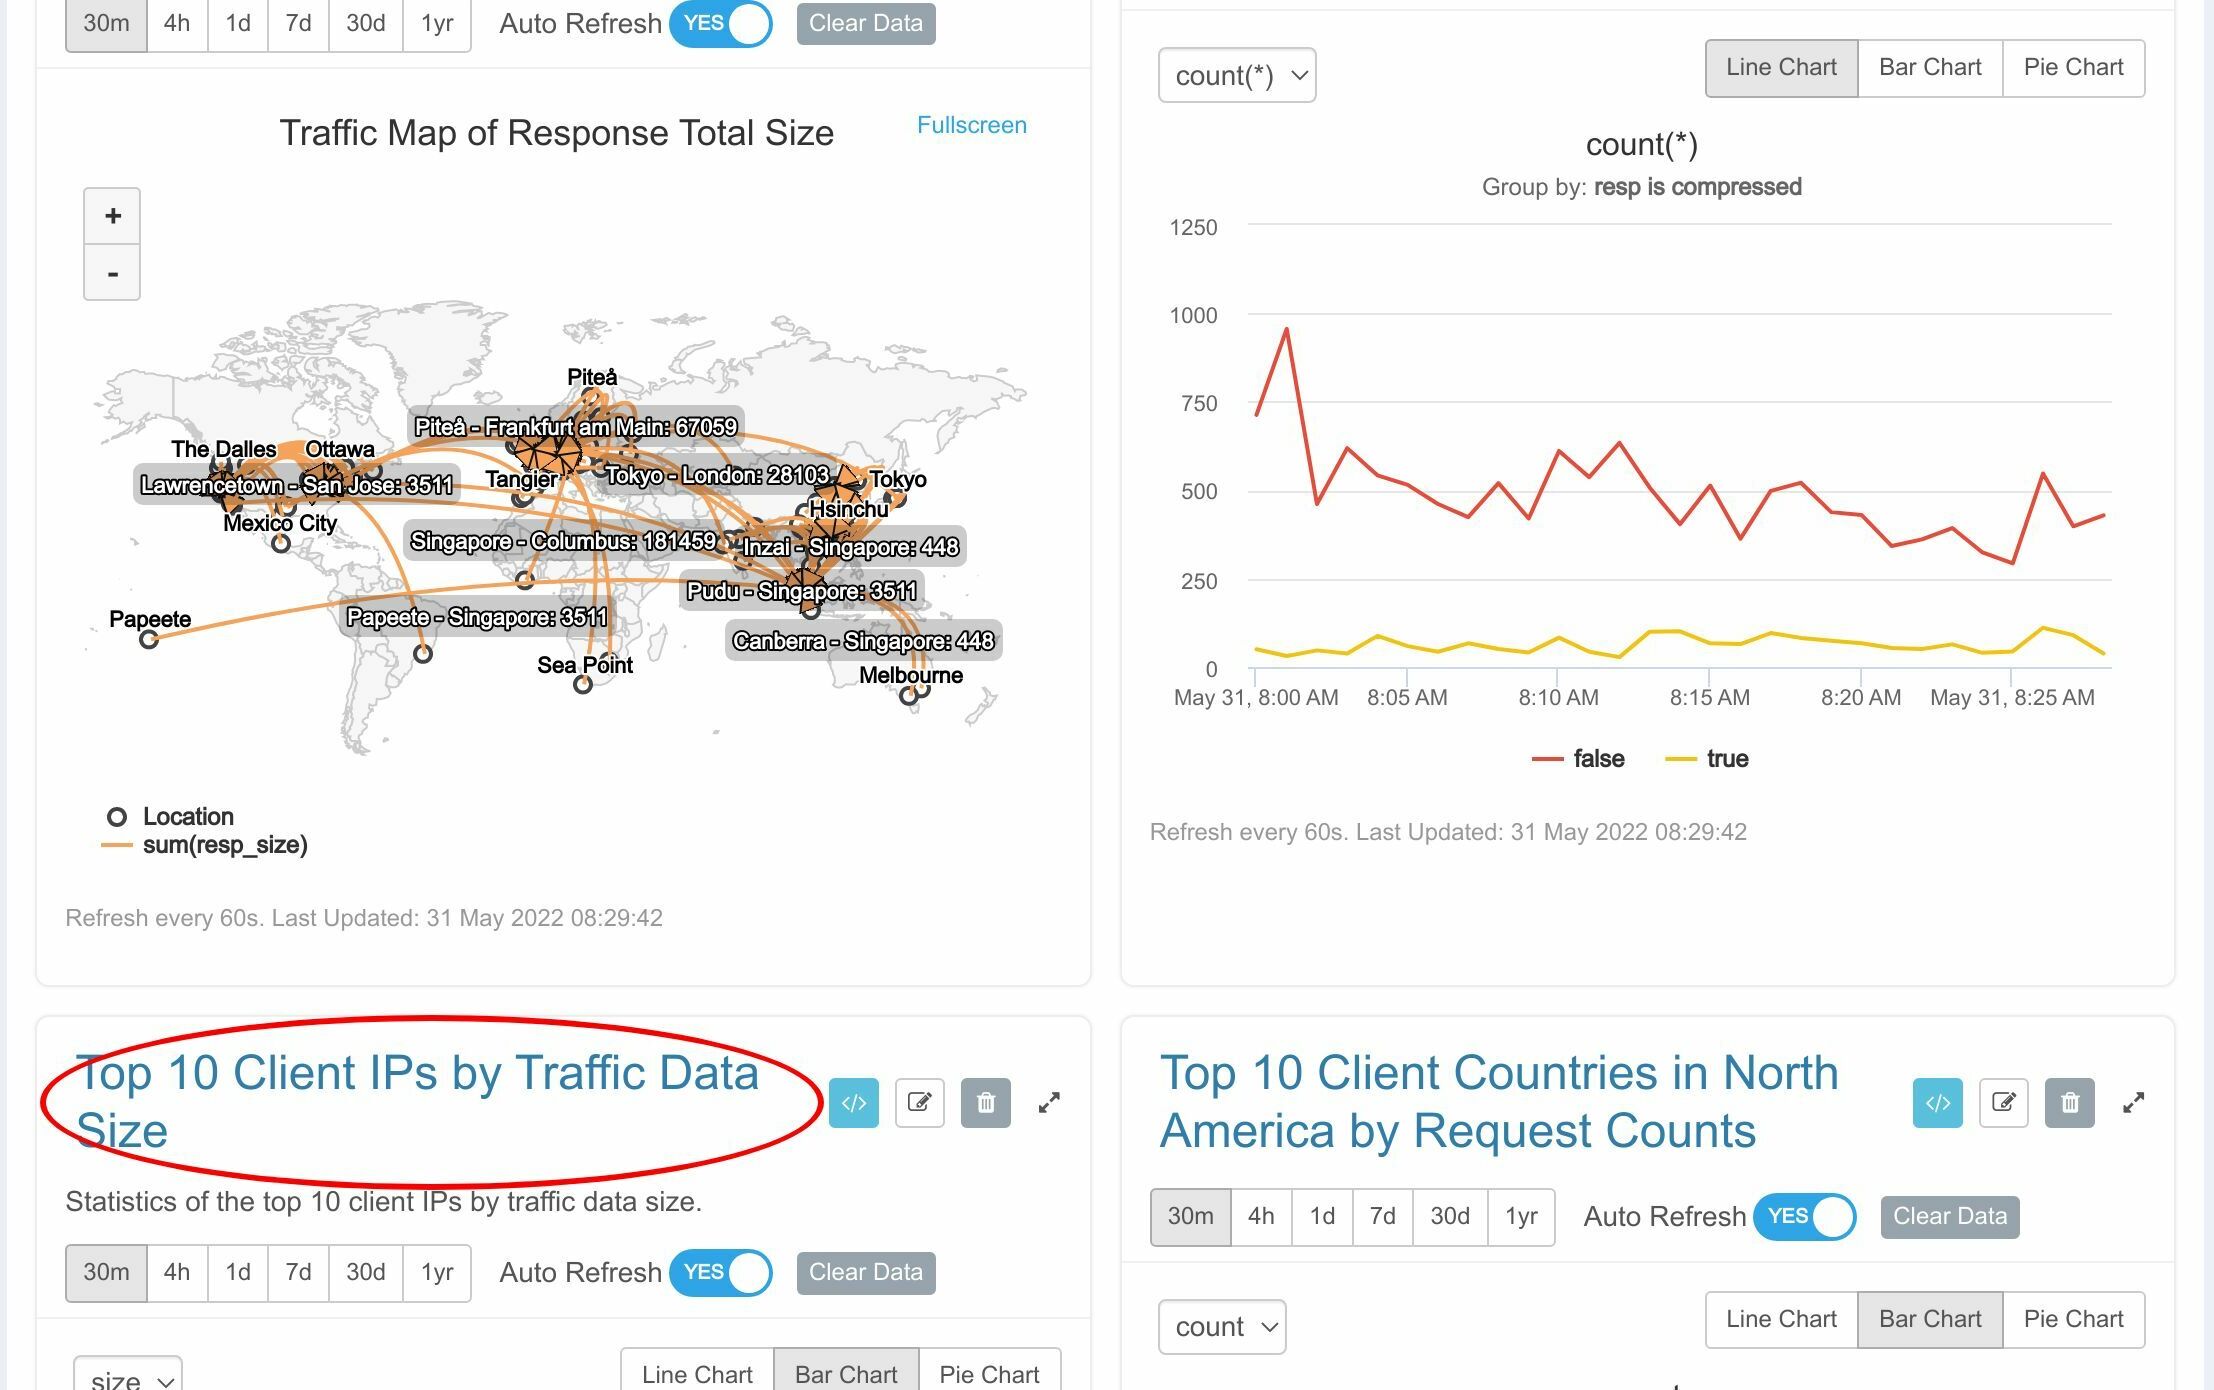
Click this button and see what the Metric SQL definition looks like.
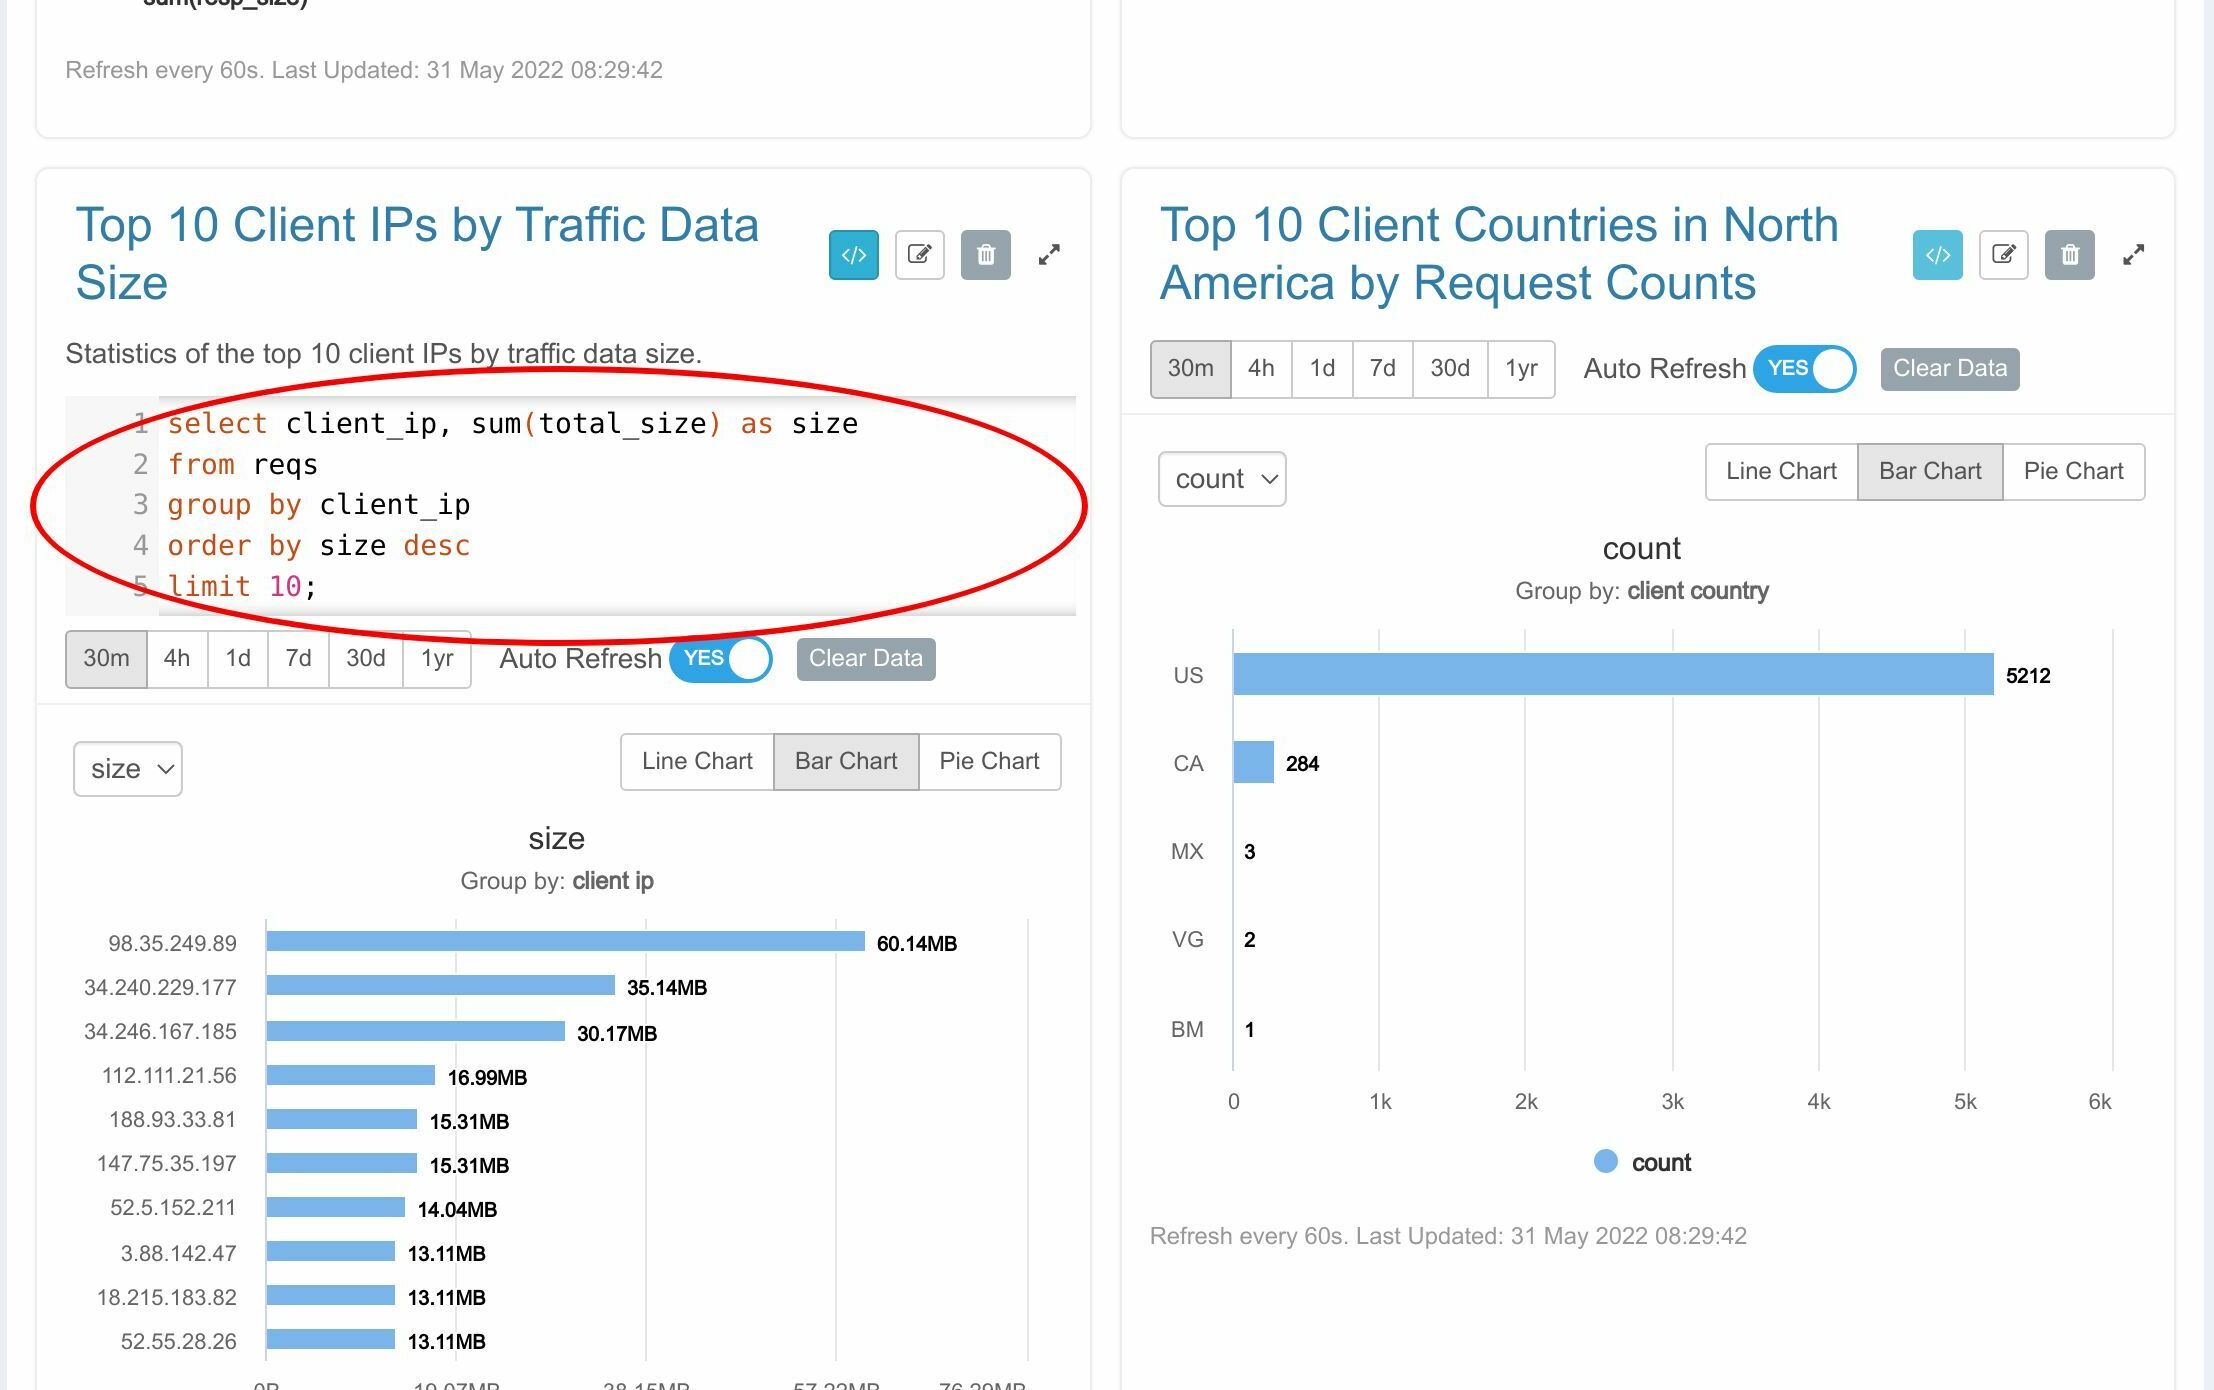
We may tell whether our website is experiencing Denial-of-Service attacks.

Let’s check out this metric. It shows the top 10 countries in North America which sent the most requests.
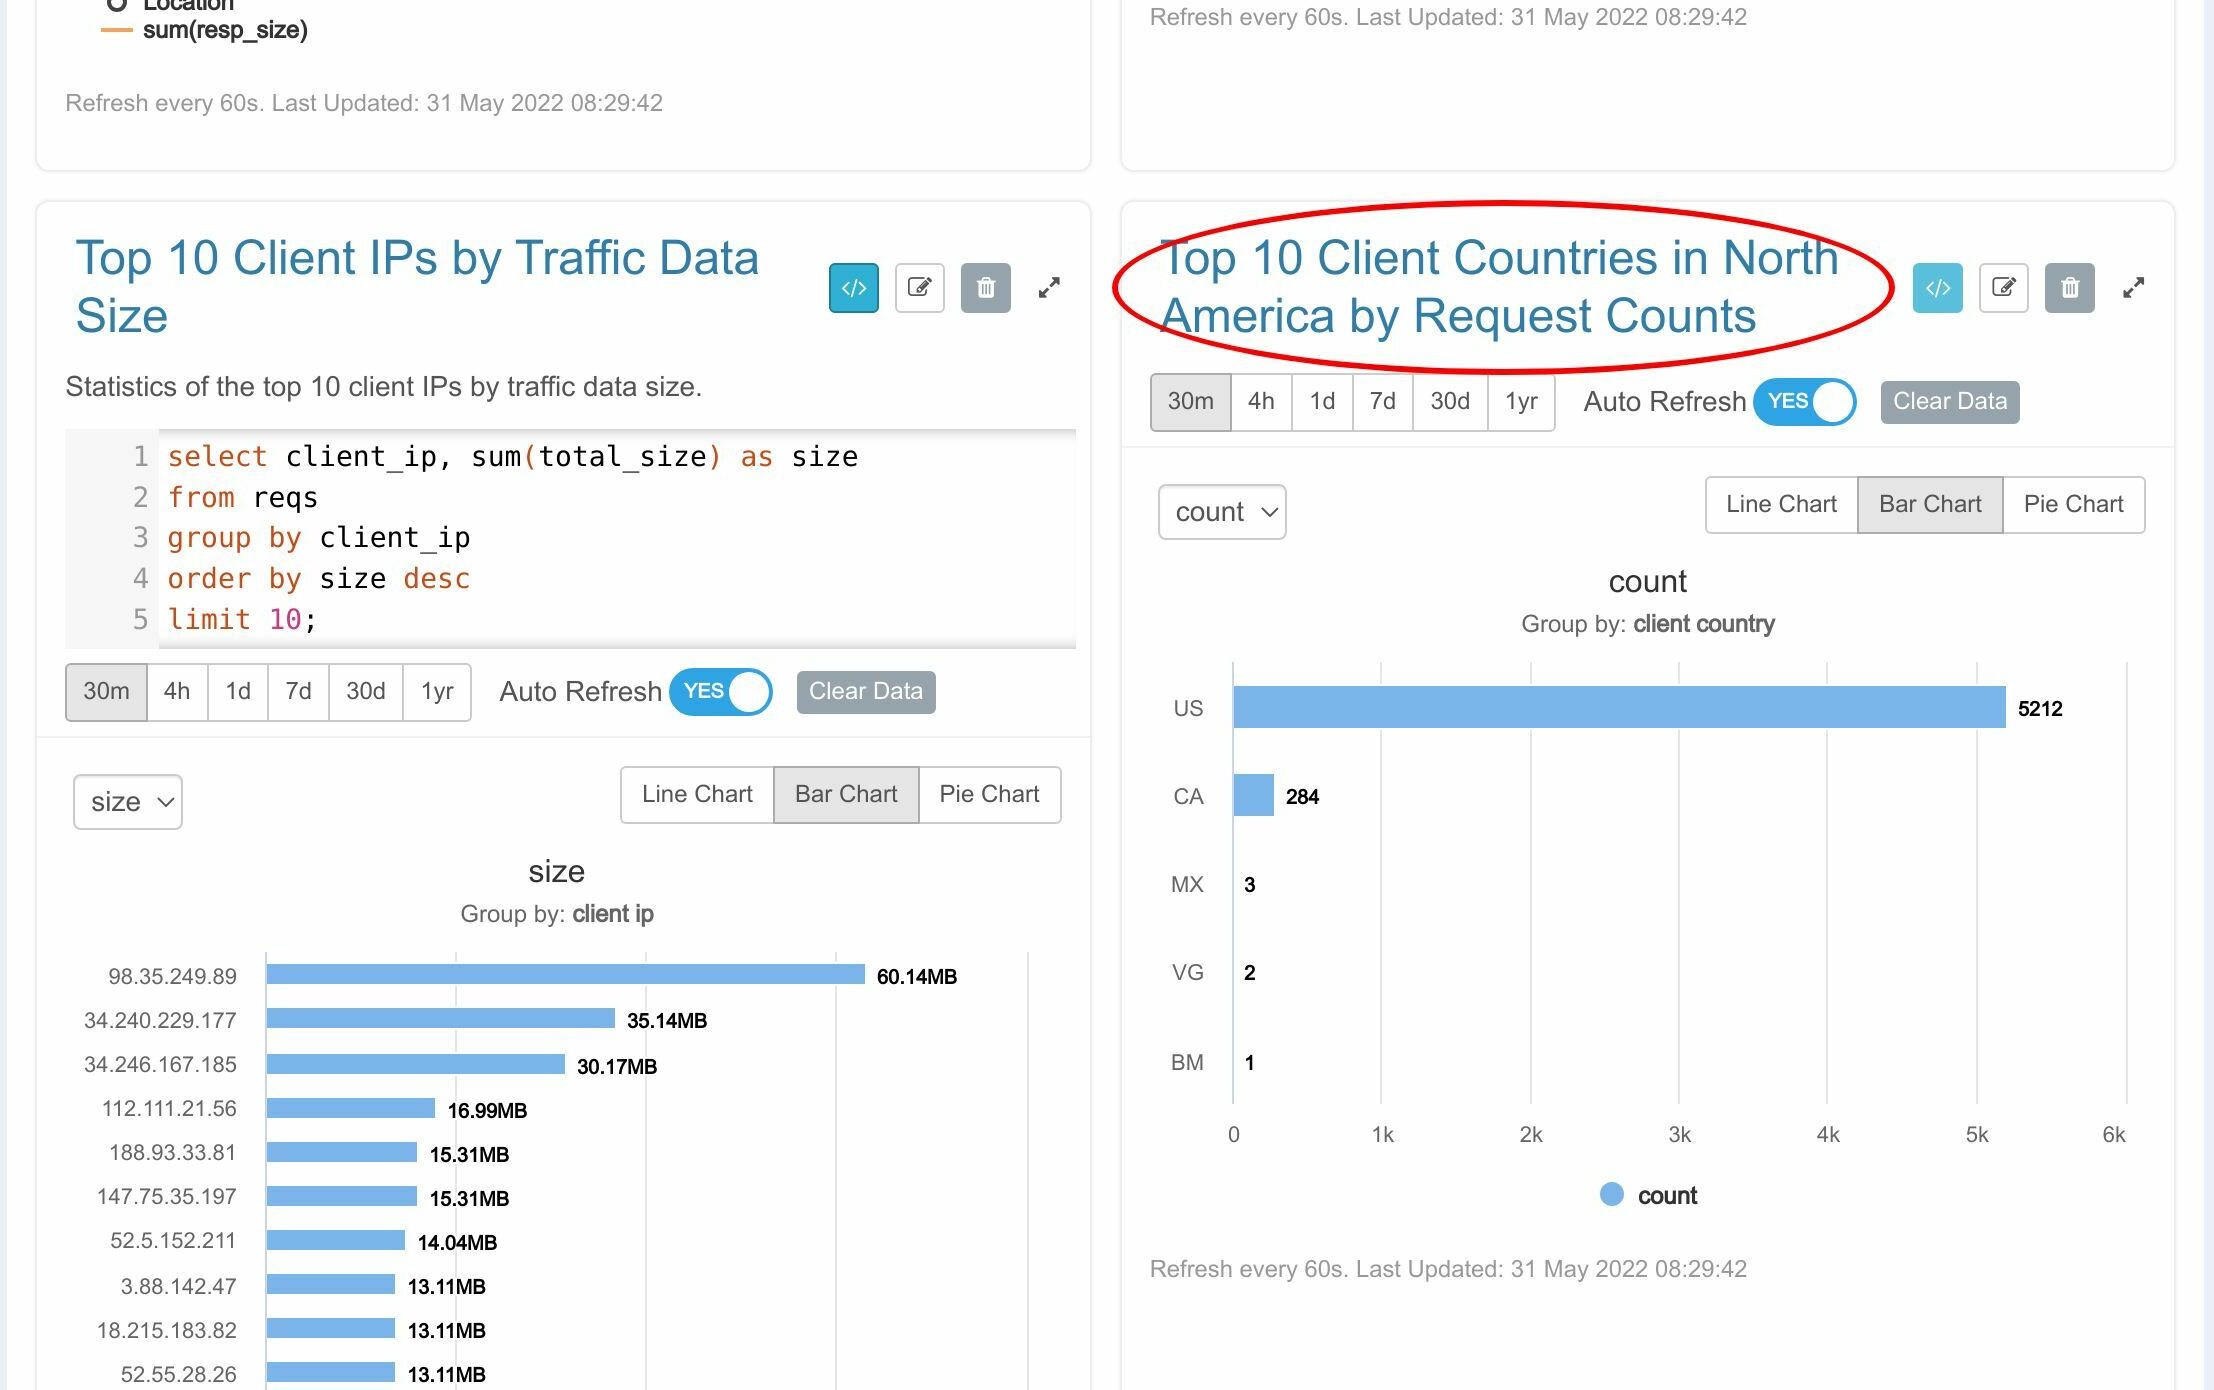
Click and see its Metric SQL definition.

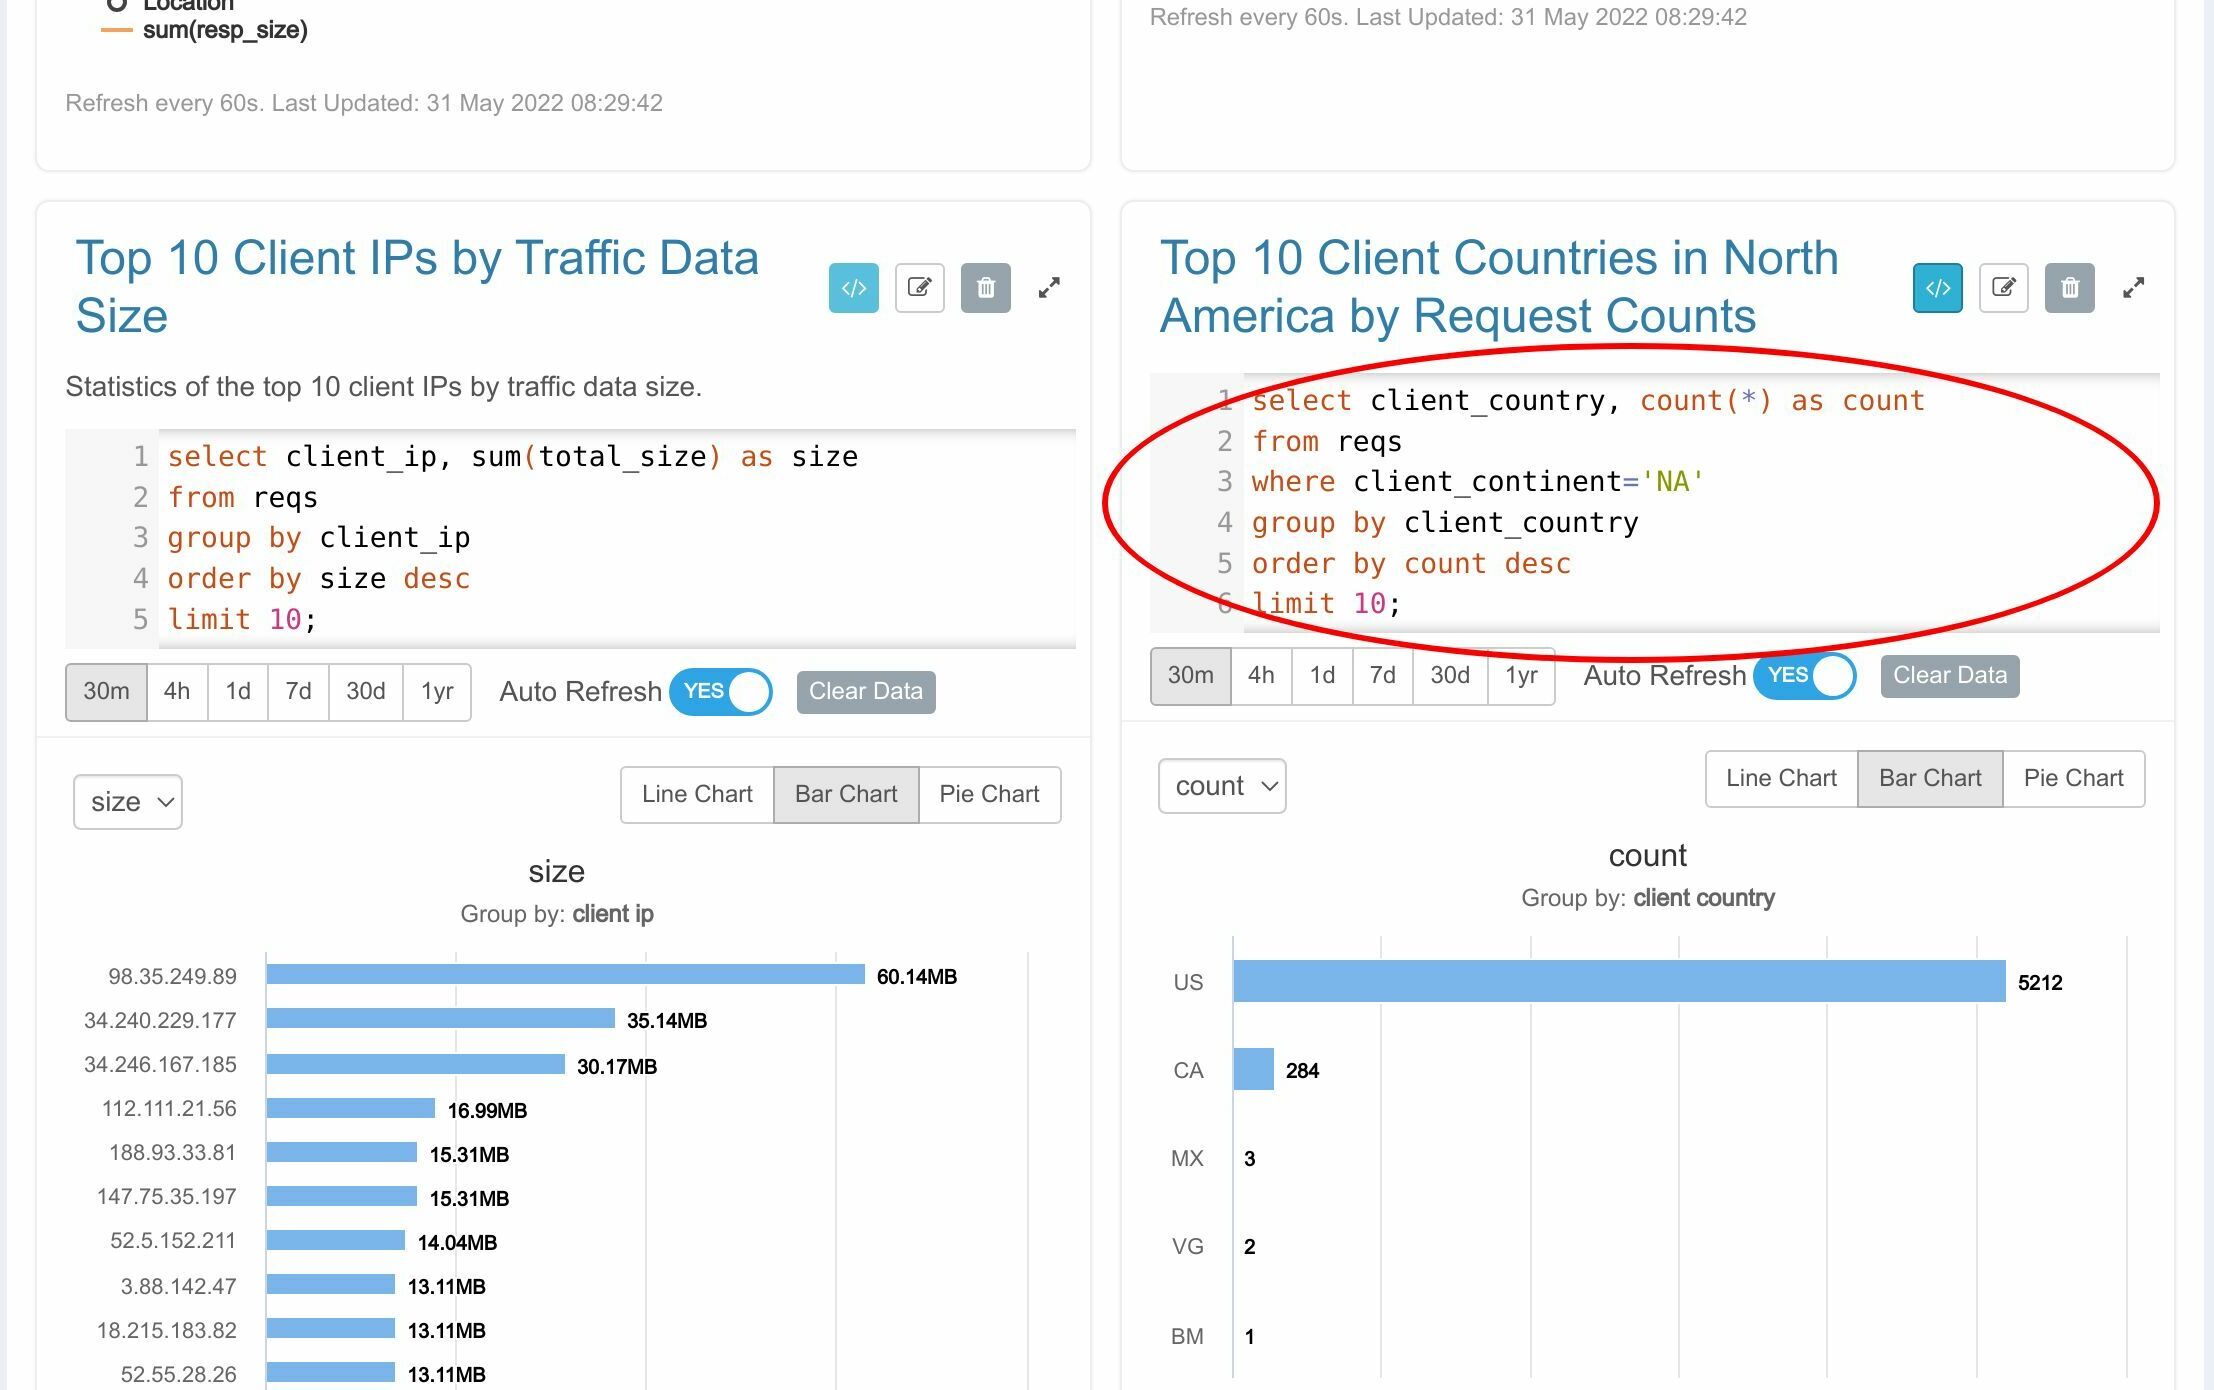
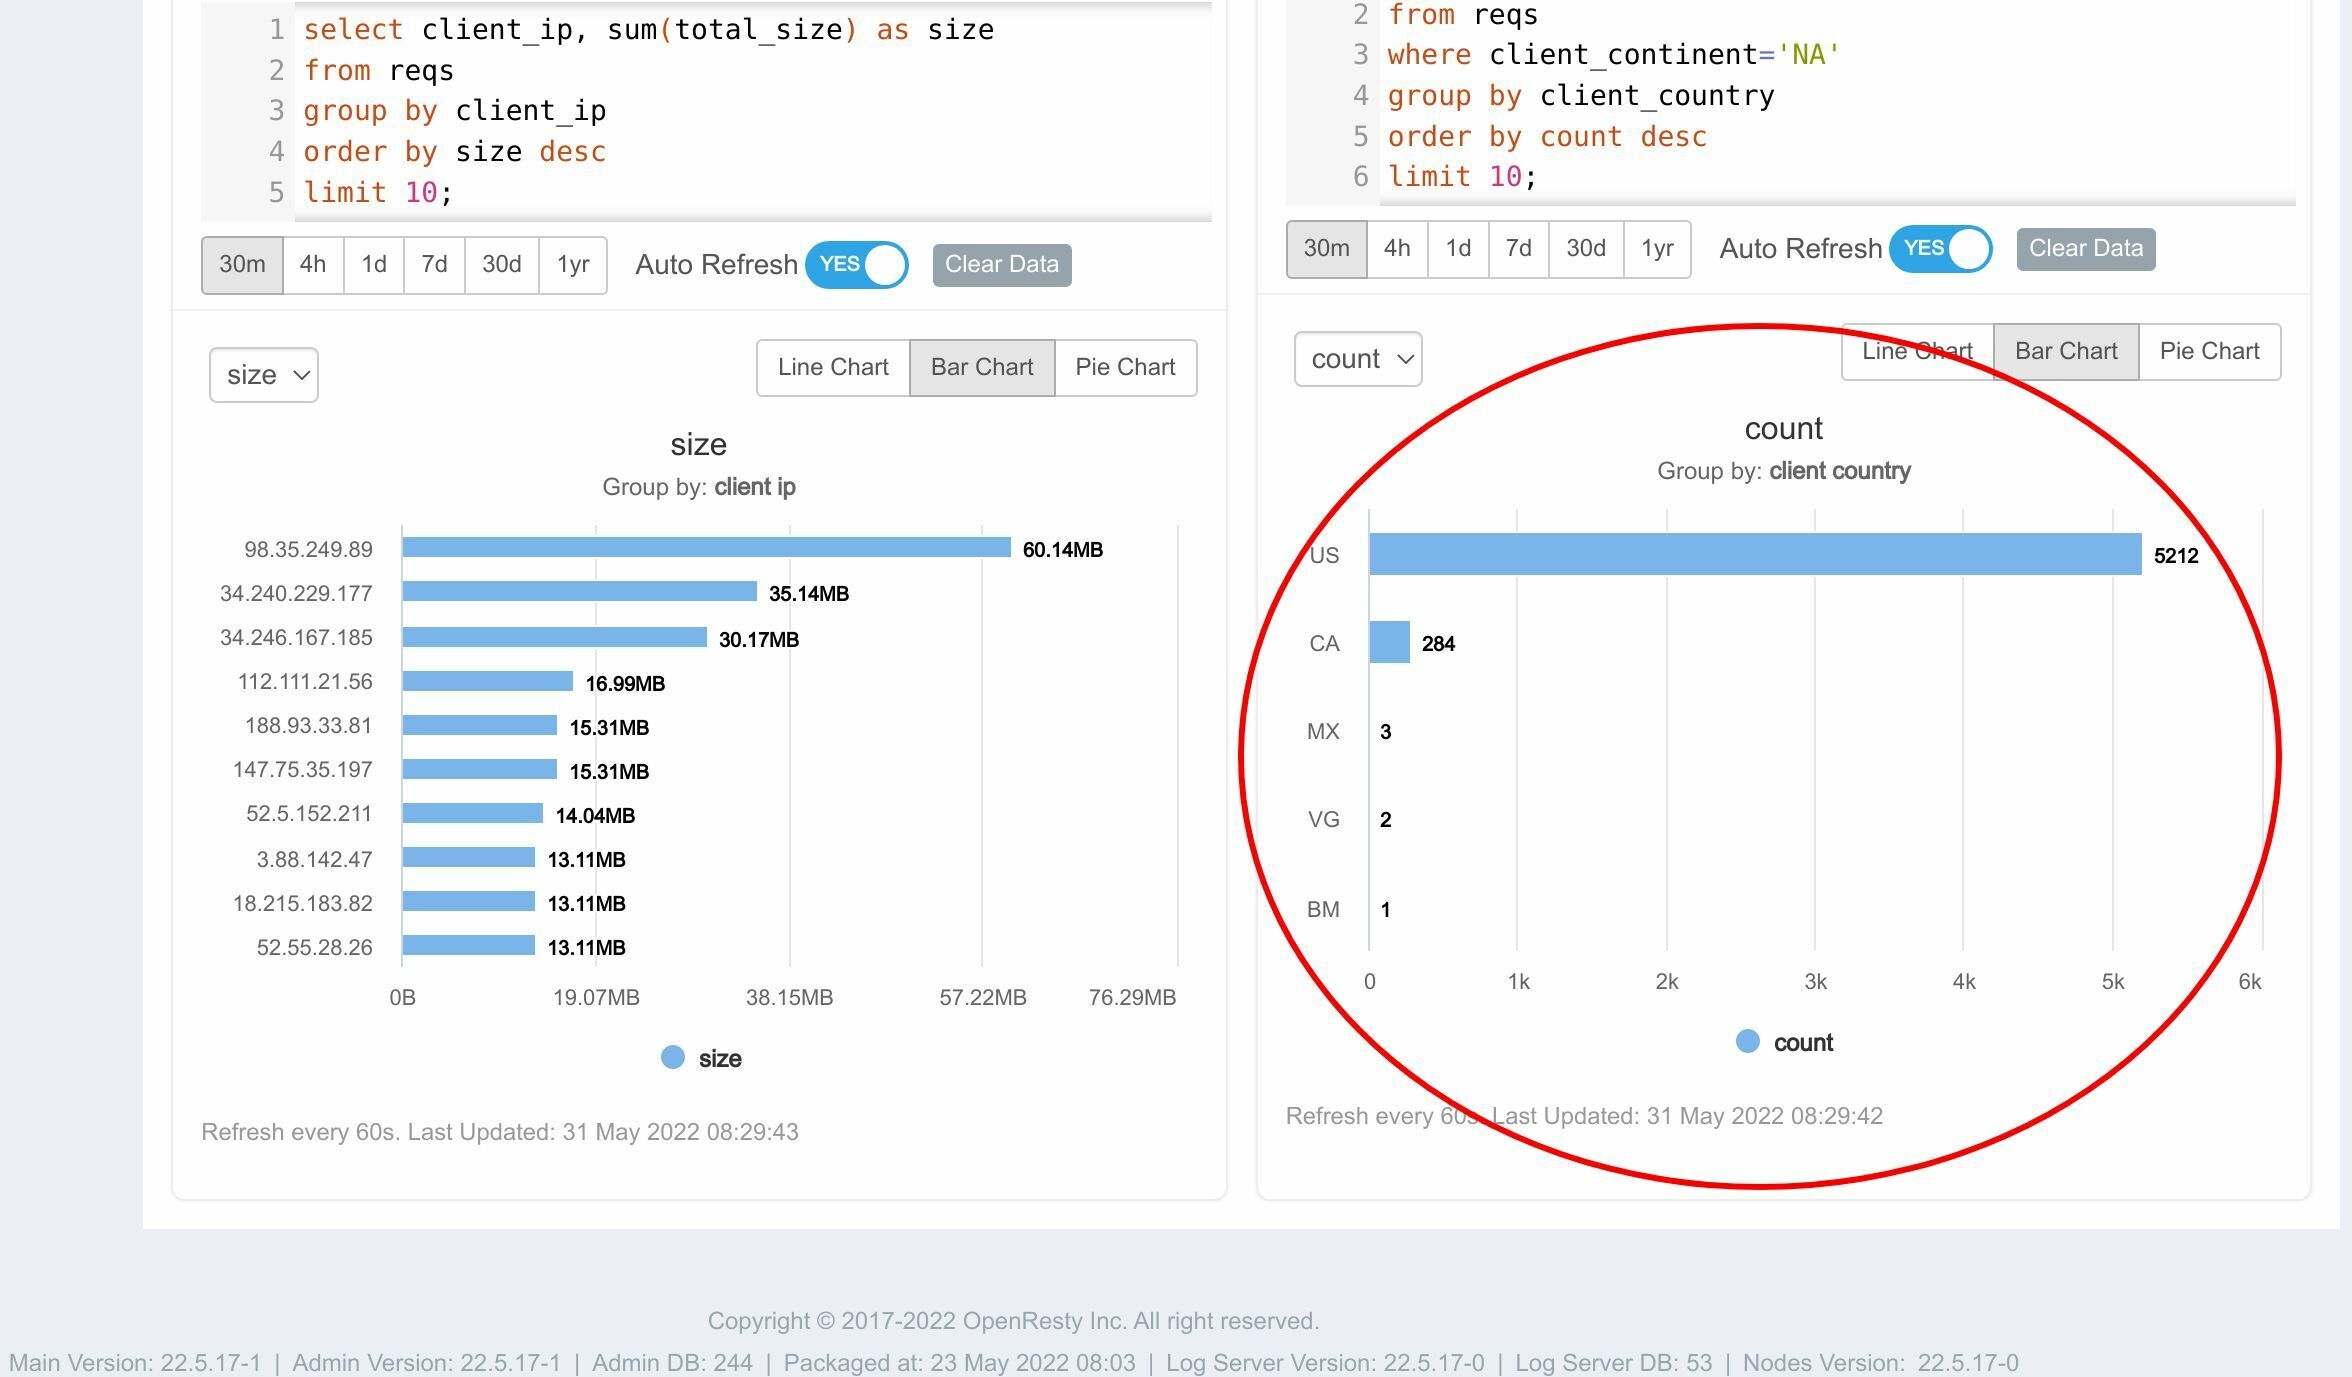
Here goes the chart.
Hopefully, you’ve found these examples helpful and fun. This is what I’d like to cover today.
What is OpenResty Edge
OpenResty Edge is our all-in-one gateway software for microservices and distributed traffic architectures. It combines traffic management, private CDN construction, API gateway, security, and more to help you easily build, manage, and protect modern applications. OpenResty Edge delivers industry-leading performance and scalability to meet the demanding needs of high concurrency, high load scenarios. It supports scheduling containerized application traffic such as K8s and manages massive domains, making it easy to meet the needs of large websites and complex applications.
If you like this tutorial, please subscribe to this blog site and/or our YouTube channel. Thank you!
About The Author
Yichun Zhang (Github handle: agentzh), is the original creator of the OpenResty® open-source project and the CEO of OpenResty Inc..
Yichun is one of the earliest advocates and leaders of “open-source technology”. He worked at many internationally renowned tech companies, such as Cloudflare, Yahoo!. He is a pioneer of “edge computing”, “dynamic tracing” and “machine coding”, with over 22 years of programming and 16 years of open source experience. Yichun is well-known in the open-source space as the project leader of OpenResty®, adopted by more than 40 million global website domains.
OpenResty Inc., the enterprise software start-up founded by Yichun in 2017, has customers from some of the biggest companies in the world. Its flagship product, OpenResty XRay, is a non-invasive profiling and troubleshooting tool that significantly enhances and utilizes dynamic tracing technology. And its OpenResty Edge product is a powerful distributed traffic management and private CDN software product.
As an avid open-source contributor, Yichun has contributed more than a million lines of code to numerous open-source projects, including Linux kernel, Nginx, LuaJIT, GDB, SystemTap, LLVM, Perl, etc. He has also authored more than 60 open-source software libraries.
Related Articles
OpenResty XRay May 22, 2023

OpenResty XRay Jun 7, 2022

OpenResty XRay Mar 1, 2022

OpenResty XRay Jul 8, 2026

OpenResty XRay May 18, 2026


