The Next Stop for Observability: How OpenResty XRay Redefines Problem Troubleshooting
In today’s world dominated by microservices, Serverless, and hybrid cloud, system troubleshooting is becoming increasingly difficult. When a request traverses dozens of services and spans multiple cloud platforms, traditional logging and monitoring tools often only reveal the tip of the iceberg. OpenResty XRay as a new generation dynamic tracing tool, completely changes this situation—it can provide X-ray-like insights into the internal workings of systems without modifying code or restarting services, precisely locating performance bottlenecks and abnormal behaviors. This article will reveal the troubleshooting challenges of modern architectures, explore the evolution trends of observability technology, and introduce how OpenResty XRay makes complex systems transparent and controllable through breakthrough dynamic tracing technology, helping developers remain efficient and confident in increasingly complex technical environments.
Why is Problem Troubleshooting Becoming Increasingly Difficult in Modern Software Architecture?
With the rapid development of technology, our software architecture is experiencing unprecedented transformation. Microservices, Serverless, and hybrid cloud environments have become standard configurations for modern systems, and while this evolution brings flexibility and scalability, it also causes system complexity to grow exponentially.
Imagine today’s enterprise applications: they may be deployed simultaneously across multiple cloud platforms and edge nodes, adopt Serverless architecture, and interact with various SaaS services. This distributed nature poses severe challenges to traditional troubleshooting methods.
Pain Points of Traditional Methods
The complexity of modern systems is mainly reflected in three aspects:
- Multiple Layers of Abstraction: From hardware to operating systems, from containers to application frameworks, each layer increases the difficulty of understanding system behavior
- Heterogeneous Systems: Combinations of different languages, frameworks, and platforms make unified monitoring difficult
- Asynchronous Call Chains: In event-driven architectures, request flows are no longer linear, making tracing extremely complex
Faced with these challenges, traditional troubleshooting approaches seem inadequate:
| Solution Type | Advantages | Limitations |
|---|---|---|
| Log Analysis | Simple implementation, long history | Requires pre-instrumentation, high performance overhead |
| APM Tools | Visualized call chains, out-of-the-box | Limited depth, difficult to customize |
| Traditional Debuggers | Fine-grained control | Requires downtime, not suitable for production |
| Dynamic Tracing | Zero intrusion, on-demand activation | Requires specialized knowledge |
Driven by digital transformation, cloud services, and microservices adoption, the demand for high-performance traffic management and monitoring continues to rise, especially for non-intrusive, low-overhead, full-stack visualization monitoring solutions.
In this trend, we urgently need new methods that can “provide real-time insights into running systems” rather than post-mortem analysis or offline debugging.
Trend Insights: The Future of Observability Technology
Observability technology has undergone significant evolution:
- First Generation: Logs - Recording discrete events
- Second Generation: Metrics - Aggregated numerical monitoring
- Third Generation: Distributed Tracing - Tracking request flows
- Fourth Generation: Dynamic Tracing - On-demand deep system insights
Future computing scenarios will be more diverse: edge computing devices will be ubiquitous, IoT device numbers will grow explosively, and deep observability services will become standard components. These scenarios place new requirements on observability: lightweight, low overhead, high precision.
OpenResty was born to build a full-stack observability system that requires no restarts, has zero intrusion, and can be activated on demand, allowing developers to observe the internal workings of complex systems like using a microscope.
How Does Dynamic Tracing Technology Break Through Abstraction Layers?
The fundamental difference between dynamic tracing and other technologies:
- Compared to Logs: No pre-instrumentation needed, activated on demand, lower overhead
- Compared to APM: Can delve into any function level, not limited to predefined interfaces
- Compared to Debuggers: Usable in production environments, almost zero performance impact
The core of dynamic tracing technology lies in its ability to penetrate various abstraction layers, directly observing internal system behavior without modifying code or restarting services.
Basic Principles
Dynamic tracing mainly relies on three technical mechanisms:
- Kernel Probes: Directly attached to operating system kernel functions, monitoring system calls
- User-space Probes: Dynamically inserted at entry/exit points of application functions
- Event Handlers: Capturing events triggered by probes, executing custom analysis logic
“Time + Space” Dual-Dimension Tracing Model
Dynamic tracing is like performing “acupuncture” on complex systems—placing probes at key “acupoints” to collect real-time data. This method provides deep insights along two key dimensions:
- Time Dimension: Capturing the dynamic behavior of systems over time, such as function execution duration, call frequency, and latency distribution. This is like observing a flowing river, understanding its flow rate changes and water level fluctuations.
- Space Dimension: Collecting data both vertically (across different abstraction layers) and horizontally (different components within the same layer). This allows us to cross process boundaries, connect kernel space with user space, and build a complete map of system behavior.
This dual-dimension model enables us to quickly locate the source of problems from any abnormal signal, like a spider sensing vibrations in its web, no matter how deep the issue is hidden within system layers.
In the process of building OpenResty XRay, we have accumulated rich experience: how to balance tracing depth with performance overhead, how to design user-friendly interfaces, and how to process massive tracing data.
Use Case: Real-time Statistics of Plugin Resource Consumption in Production Kong Services
In the API gateway field, Kong is a widely used open-source solution. However, as the number of plugins increases, identifying resource-intensive consumers becomes a challenge for operations personnel. OpenResty XRay provides an elegant solution for this.
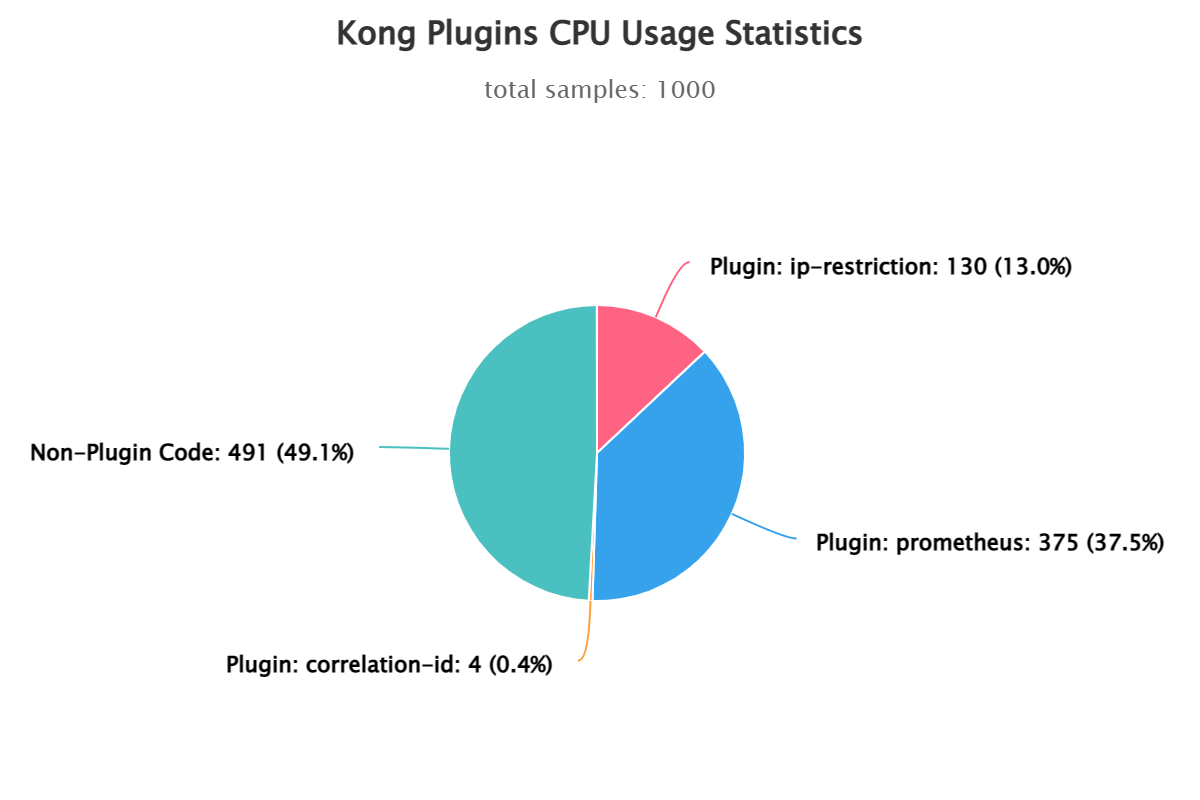
OpenResty XRay can sample and analyze CPU and memory usage statistics for all loaded plugins in any running Kong server instance. You don’t need to install any special plugins or build options for Kong; you just need to run OpenResty XRay and point it to your Kong process.
OpenResty XRay can sample a Kong process for a period of time, from a few seconds to a few minutes, depending on how busy the process is. It then shows you how CPU time is distributed among all currently loaded plugins.
For example, here is a pie chart generated by OpenResty XRay for a Kong process:
To learn more about how to use OpenResty XRay to analyze Kong plugin performance, please visit: Real-time Statistics of CPU and Memory Usage for Plugins in Production Kong Service Processes
Conclusion
As system complexity continues to increase, traditional troubleshooting methods are struggling to cope. OpenResty XRay, as a new generation dynamic tracing tool, provides developers with unprecedented system insight capabilities, making complex systems transparent and solvable. Whether you’re an architect facing performance challenges or a developer needing to quickly locate issues, OpenResty XRay can help you penetrate abstraction layers and reach the core of problems.
What is OpenResty XRay
OpenResty XRay is a dynamic-tracing product that automatically analyzes your running applications to troubleshoot performance problems, behavioral issues, and security vulnerabilities with actionable suggestions. Under the hood, OpenResty XRay is powered by our Y language targeting various runtimes like Stap+, eBPF+, GDB, and ODB, depending on the contexts.
If you like this tutorial, please subscribe to this blog site and/or our YouTube channel. Thank you!
About The Author
Yichun Zhang (Github handle: agentzh), is the original creator of the OpenResty® open-source project and the CEO of OpenResty Inc..
Yichun is one of the earliest advocates and leaders of “open-source technology”. He worked at many internationally renowned tech companies, such as Cloudflare, Yahoo!. He is a pioneer of “edge computing”, “dynamic tracing” and “machine coding”, with over 22 years of programming and 16 years of open source experience. Yichun is well-known in the open-source space as the project leader of OpenResty®, adopted by more than 40 million global website domains.
OpenResty Inc., the enterprise software start-up founded by Yichun in 2017, has customers from some of the biggest companies in the world. Its flagship product, OpenResty XRay, is a non-invasive profiling and troubleshooting tool that significantly enhances and utilizes dynamic tracing technology. And its OpenResty Edge product is a powerful distributed traffic management and private CDN software product.
As an avid open-source contributor, Yichun has contributed more than a million lines of code to numerous open-source projects, including Linux kernel, Nginx, LuaJIT, GDB, SystemTap, LLVM, Perl, etc. He has also authored more than 60 open-source software libraries.
Related Articles
OpenResty XRay Jul 1, 2025

OpenResty XRay Jun 27, 2025

OpenResty XRay Jun 27, 2025

OpenResty XRay May 30, 2025

OpenResty XRay May 26, 2025


