The Wonderland of Dynamic Tracing (Part 7 of 7)
This is the last part, Part 7, of the series “The Wonderland of Dynamic Tracing” which consists of 7 parts in total. I will keep updating this series to reflect the state of the art of the dynamic tracing world.
The previous one, Part 6, looks at the Linux kernel support needed by dynamic tracing, as well as some other more exotic tracing needs like tracing hardware and “corpses” of dead processes. This part will cover traditional debugging technologies and the modern dynamic tracing world in general.
See also Part 1, Part 2, Part 3, Part 4, and Part 5.
Traditional Debugging Technologies
When it comes to GDB, I must mention the differences and connections between dynamic tracing and traditional debugging approaches. Experienced engineers, if they are careful enough, should have noticed that dynamic tracing has its “predecessor” which sets breakpoints in GDB before a host of examinations are made there. They are different in that dynamic tracing always pursues non-interactive batch processing as well as the lowest possible performance losses. In contrast, the implementation in GDB, designed for interactive operations, does not consider production safety or prioritize performance losses, making them have an extremely huge performance impact in most cases. Meanwhile, GDB is based on the very old ptrace system call which has a great variety of pitfalls and problems. For example, ptrace needs to change the father of the target debugging process and forbids multiple debuggers from simultaneously analyzing the same process. In a certain sense, GDB can simulate “low-level dynamic tracing”.
I see many programming beginners performing “single-step execution” with GDB. This, however, is often a very inefficient way in the production and development of the real industrial community. The reason for this is that changes in program execution sequence often come with single-step execution, and thus prevent plenty of sequence-related problems from recurring. In addition, when software systems are complicated, executors tend to get stuck in separate code paths and lose sight of the whole picture.
Given those factors, my suggestion is to take the seemingly stupidest yet simplest approach of printing and outputting statements on key code paths to handle debugging in daily development. Outputs such as viewing logs can deliver a complete context, in which the result of program execution can be well analyzed. This approach, when combined with test-driven development, will prove to be particularly efficient. The previous discussions have sufficed to demonstrate the impracticability of adding logs and event tracking codes in online debugging. Also, traditional performance analysis tools, including DProf in Perl, gprof in the C world, and performance profilers for other languages and environments, often require recompiling programs with special options or rerunning them in a special way. Such performance analysis tools, which require special handling and cooperation, are obviously not suitable for online, real-time live analysis.
A Messy World of Debugging
Today’s debugging world is a real mess, being flooded with DTrace, SystemTap, ePBF/BCC, GDB, LLDB, and many other things not mentioned here. Relevant information can be found online. Their number may just be a reflection of the disorder of the real world we are in.
An idea that used to linger in my mind for years was to design and create a universal debugging language. My efforts in OpenResty Inc. made the dream a reality. It’s called Y language, whose compilers can automatically generate input codes acceptable to various debugging frameworks and technologies. Among them is D language code for DTrace, stap script for SystemTap, Python script for GDB, another incompatible API Python script of LLDB, bytecode acceptable to eBPF, and even a mixture of C and Python codes acceptable to BCC.
I pointed out earlier the workload is very high in manually porting a designed debugging tool into different debugging frameworks. But if the said Y language is in place, its compilers will be able to automatically convert the same Y code into input codes tailored for diverse debugging platforms and carry out automatic optimization for these platforms. We would only need to write each debugging tool in Y once. This would be a huge relief. And debuggers will be free from the trouble of studying all those fragmented details about debugging technologies and the danger of falling into the “traps” in each of them.
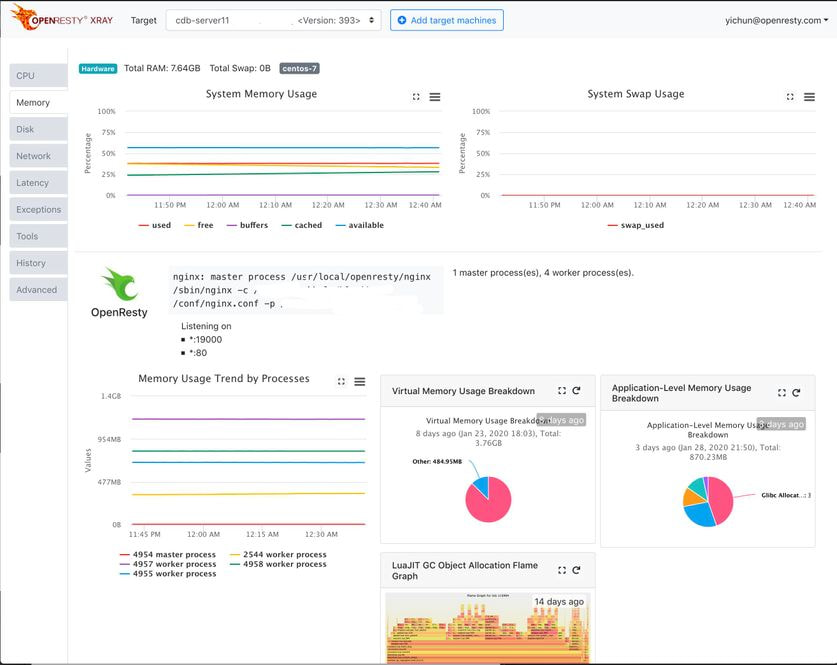
The Y language is included in OpenResty XRay and has been available to its users.
Some may wonder where the name Y originates. From a personal perspective, Y is the first letter of my name, Yichun. Of course, the more important implication lies in the nature of the language. Y language is created to answer questions starting with “why”, which has the same pronunciation as Y.
OpenResty XRay
As a commercial product of OpenResty Inc., OpenResty XRay aids users in delving deep into specific behaviors of different kinds of software systems, whether online or offline and accurately analyzing and identifying various problems in terms of performance, reliability, and security, without needing any cooperation from the target program. Its technology ensures more powerful tracing functions than SystemTap, and its performance and accessibility far surpass the latter. Besides, it supports automatically analyzing program remains like core dump files.
Conclusion
This part of the series covered traditional debugging technologies and the modern dynamic tracing world in general.
A Word on OpenResty XRay
OpenResty XRay is a commercial dynamic tracing product offered by our OpenResty Inc. company. We use this product in our articles like this one to demonstrate implementation details, as well as provide statistics about real-world applications and open-source software. In general, OpenResty XRay can help users gain deep insight into their online and offline software systems without any modifications or any other collaborations, and efficiently troubleshoot difficult problems for performance, reliability, and security. It utilizes advanced dynamic tracing technologies developed by OpenResty Inc. and others.
We welcome you to contact us to try out this product for free.
About The Author
Yichun Zhang (Github handle: agentzh), is the original creator of the OpenResty® open-source project and the CEO of OpenResty Inc..
Yichun is one of the earliest advocates and leaders of “open-source technology”. He worked at many internationally renowned tech companies, such as Cloudflare, Yahoo!. He is a pioneer of “edge computing”, “dynamic tracing” and “machine coding”, with over 22 years of programming and 16 years of open source experience. Yichun is well-known in the open-source space as the project leader of OpenResty®, adopted by more than 40 million global website domains.
OpenResty Inc., the enterprise software start-up founded by Yichun in 2017, has customers from some of the biggest companies in the world. Its flagship product, OpenResty XRay, is a non-invasive profiling and troubleshooting tool that significantly enhances and utilizes dynamic tracing technology. And its OpenResty Edge product is a powerful distributed traffic management and private CDN software product.
As an avid open-source contributor, Yichun has contributed more than a million lines of code to numerous open-source projects, including Linux kernel, Nginx, LuaJIT, GDB, SystemTap, LLVM, Perl, etc. He has also authored more than 60 open-source software libraries.
Translations
We provide a Chinese translation for this article on blog.openresty.com.cn We also welcome interested readers to contribute translations in other languages as long as the full article is translated without any omissions. We thank anyone willing to do so in advance.

