The Wonderland of Dynamic Tracing (Part 1 of 3)
This is the first part of the article “The Wonderland of Dynamic Tracing which consists of 3 parts. I will keep updating this series to reflect the state of art of the dynamic tracing world.
Dynamic Tracing
It’s my great pleasure to share my thoughts on dynamic tracing —— a topic I have a lot of passion and excitement for. Let’s cut to the chase: what is dynamic tracing?
What It Is
As a kind of post-modern advanced debugging technology, dynamic tracing allows software engineers to answer some tricky problems about software systems, such as high CPU or memory usage, high disk usage, long latency, or program crashes. All this can be detected at a low cost within a short period of time, to quickly identify and rectify the problems. It emerged and thrived in a rapidly developing Internet era of cloud computing, service mesh, big data, API computation etc., which exposed engineers to two major challenges. The first challenge relates to the scale of computation and deployment. Today, the number of users, colocations, and machines are all experiencing rapid growth. The second one is complexity. Software engineers are facing increasingly complicated business logic and software systems. There are many, many layers to them. From bottom to top, there are operating system kernels, different kinds of system software like databases and Web servers, then, virtual machines, interpreters and Just-In-Time (JIT) compilers of various scripting languages or other advanced languages, and finally at the application level, the abstraction layers of various business logic and numerous complex code logic.
These huge challenges have consequences. The most serious is that software engineers today are quickly losing their insight and control over the whole production systems, which has become so enormous and complex that all kinds of bugs are much more likely to arise. Some may be fatal, like the 500 error pages, memory leaks, and error return values, just to name a few. Also worth noting is the issue of performance. You probably may have been confused about why software sometimes runs very slowly, either by itself or on some machines. Worse, as cloud computing and big data are gaining more popularity, the production environment will only see more and more unpredictable problems on this massive scale. In these situations, engineers must devote most of their time and energy to them. Here, two factors are at play. Firstly, a majority of problems only occur in online environments, making it extremely difficult, if not impossible, reproduce these problems. Secondly, some have only a very low frequency of occurrences, say, one in a hundred, one in a thousand, or even lower. For engineers, it would be ideal if they are able to analyze and pinpoint the root cause of a problem and take the targeted measure to address it while the system is still running, without having to drop the machine offline, edit existing code or configurations, or reboot the processes or machines.
Too Good to be True?
And this is where dynamic tracing comes in. It can push software engineers toward that vision, greatly unleashing their productivity. I still remember when I worked for Yahoo!. Sometimes I had to take a taxi, you know, at midnight, to the company to deal with online problems. I had no choice, but it obviously frustrated me, blurring the lines between my work and life. Later I came to a CDN service provider in the United States. The maintenance team of our clients always looked through the original logs provided by us, reporting any problems they deemed important. From the perspective of the service provider, some of them may just occur with a frequency of one in hundred or one in a thousand. Even so, we must identify the real cause and give feedback to the client. The abundance of such subtle occurrences in reality has fueled the creation and emergence of new technologies.
The best part of dynamic tracing, in my humble opinion, is its “live process analysis”. In other words, the technology allows software engineers to analyze one program or the whole software system while it is still running, providing online services and responding to real requests. Just like querying a database. That is a very intriguing practice. Many engineers tend to ignore the fact that a running software system, itself containing most precious information, serves as a database that is changing in real time and open to direct queries. Of course, the special “database” must be read-only, otherwise the said analysis and debugging would possibly affect the system’s own behaviors, and hamper online services. With the help of the operating system kernel, engineers can initiate a series of targeted queries from the outside to secure invaluable raw data about the running software system. This data will guide a multitude of tasks like problem analysis, security analysis, and performance analysis.
How it Works
Dynamic tracing usually works based on the operating system kernel level, where the “supreme being of software” has complete control over the entire software world. With absolute authority, the kernel can ensure the above-mentioned “queries” targeted at the software system will not influence the latter’s normal running. That is to say, those queries must be secure enough for wide use on production systems. Then, there arises another question concerning how a query is made if the software system is regarded as a special “database”. Clearly, the answer is not SQL.
Dynamic tracing generally starts a query through the probe mechanism. Probes will be dynamically planted into one or several layers of the software system, and the processing handlers associated with them will be defined by engineers. This procedure is similar to acupuncture in traditional Chinese medicine. Imagine that the software system is a person, and dynamic tracing means pushing some “needles” into particular spots of his body, or acupuncture points. As these needles often carry some engineer-defined “sensors”, we can freely garner and collect essential information from those points, to perform reliable diagnosis and create feasible treatment schemes. Here, tracing usually involves two dimensions. One dimension is the timeline. As long as the software is running, a course of continuous changes are incurring along the timeline. The other is the spatial dimension, because tracing may be related to various different processes, including kernel tasks and threads. Each process often has its own memory space and process space. So, among different layers, and within the memory space of the same layer, engineers can obtain abundant information in space, both vertically and horizontally. Doesn’t this sound like a spider searching for preys on the cobweb?
The information-gathering process goes beyond the operating system kernel to higher levels like the user mode program. The information collected can piece together along the timeline to form a complete software view and serve as a useful guide for some very complex analyses —— we can easily find various kinds of performance bottlenecks, root causes of weird exceptions, errors and crashes, as well as potential security vulnerabilities. A crucial point here is that dynamic tracing is non-invasive. Again, if we compare the software system to a person, to help them diagnose a condition, we clearly wouldn’t want to do so by ripping apart the living body or planting wires. Instead, the sensible action would be doing an X-ray or MRI, feeling their pulse, or using a stethoscope to listen to their heart and breathing. The same should go for diagnosis of a production software system. With the non-invasiveness of dynamic tracing comes speediness and high efficiency in accurately acquiring desired information firsthand, which helps identify different problems under investigation. No revision of the operating system kernels, application programs, or any configurations is needed here.
Most engineers should already be very familiar with the process of constructing software systems. This is a basic skill for software engineers after all. It usually means creating various abstraction layers to construct software, layer by layer, either with a bottom-up manner, or top-down. Among many other paradigms, software abstraction layers can be created via the classes and methods in object-oriented programming, or directly via functions and subroutines. In contrast with software construction, debugging works in a way that can easily “rip off” existing abstraction layers. Engineers can then have free access to any necessary information from any layers, regardless of the concrete modular design, the code encapsulation, and man-made constraints set for software construction. This is because during debugging people usually wants to get as much information as possible. After all, bugs may happen at any software layer (or even on the hardware level).
Still Having Doubts?
But will the abstraction layers built when constructing the software hinder the debugging process? The answer is a big no. Dynamic tracing, as mentioned above, is generally based on the operating system kernel which claims absolute authority as the “supreme being”. So the technology can easily (and legally) penetrate through the abstraction layers. In fact, if well-designed, those abstraction layers will actually help the debugging process, which I will detail later on. In my own work, I noticed a common phenomenon. When an online problem arises, some engineers become nervous and are quick to come up with wild guesses about the root of the problem without any evidence. Even worse, through trial and error of confirming their guesses about the root problem, they leave the system in a mess which they and their colleagues may be pained to clean up after. Finally, they miss out on valuable time for debugging or simply destroy the first scene of the incidents. All such pains could go away when dynamic tracing plays a part here. Troubleshooting could even turn out to be a lot of fun. Emergence of weird online problems would present a rare opportunity to solve a fascinating puzzle for experts. All this, of course, requires powerful tools available for collecting and analyzing information which can help quickly prove or disprove any assumptions and theories about the culprits.
The Advantages of Dynamic Tracing
Dynamic tracing does not require any cooperation or collaboration from the target application. Back to the example of a human, who is now receiving a physical examination while still running on the playground. With dynamic tracing, we can directly have a real-time X-ray for him, and he will not sense it at all. Almost all analytical tools based on dynamic tracing operate in a “hot-plug” or post-mortem manner, allowing us to run the tools at any time, and begin and end sampling at any time, without restarting or interfering the target software processes. In reality, most of analytical requirements come after the target software system starts running, and before that, software engineers are unlikely to be able to predict what problems might arise, not to mention all the information which needs to be collected to troubleshoot those issues. In this case, one advantage of dynamic tracing is, to collect data anywhere and anytime, in an on-demand manner. Another strength is it brings extremely small performance overhead. The impact of a carefully written debugging tool on the ultimate performance of the system tends to be no more than 5%, minimizing the observable performance impact on the ultimate users. Moreover, the performance overhead, already miniscule, only occurs within a few seconds or minutes of the actual sampling time window. Once the debugging tool finishes operation, the online system will automatically return to its original full speed.
DTrace
We cannot talk about dynamic tracing without mentioning DTrace. DTrace is the earliest modern dynamic tracing framework. Originating from the Solaris operating system at the beginning of this century, it was developed by engineers of Sun Microsystems. Many you may have heard about the Solaris system and its original developer Sun.
A story circulates around the creation of DTrace. Once upon a time, several kernel engineers of the Solaris operating system spent several days and nights troubleshooting a very weird online issue. They originally considered it very complicated, and spared great effort to address it, only to realize it was just a very silly configuration issue. Learning from the painful experience, they created DTrace, a highly sophisticated debugging framework to enable tools which can prevent them from going through similar pains in the future. Indeed, most of the so-called “weird problems” (high CPU or memory usage, high disk usage, long latency, program crashes etc.) are so embarrassing that it is even more depressing after pinpointing the real cause.
As a highly general-purpose debugging platform, DTrace provides the D language, a scripting language that looks like C. All DTrace-based debugging tools are written by D. The D language supports special notations to specify “probes” which usually contain information about code locations in the target software system (being either in the OS kernel or in a user-land process). For example, you can put the probe at the entry or exit of a certain kernel function, or the function entry or exit of certain user mode processes, and even on any machine instructions. Writing debugging tools in the D language requires some understanding and knowledge of the target software system. These powerful tools can help us regain insight of complex systems, greatly increasing the observability. Brendan Gregg, a former engineer of Sun, was one of the earliest DTrace users, even before DTrace was open-sourced. Brendan wrote a lot of reusable DTrace-based debugging tools, most of which are in the open-source project called DTrace Toolkit. Dtrace is the earliest and one of the most famous dynamic tracing frameworks.
DTrace Pros and Cons
DTrace has an edge in closely integrating with the operating system kernel. Implementation of the D language is actually a virtual machine (VM), kinda like a Java virtual machine (JVM). One benefit of the D language is that its runtime is resident in the kernel and is very compact, meaning the startup and quitting time for the debugging tools are very short. However, I think DTrace also has some notable weaknesses. The most frustrating one is the lack of looping language structures in D, making it very hard to write many analytical tools targeting complicated data structures in the target. The official statement attributed the lack to the purpose of avoiding infinite loops, but clearly DTrace can instead limit the iteration count of each loop on the VM level. The same applies to recursive function calls. Another major flaw is its relatively weak tracing support for user-mode code as it has no built-in support for utilizing user-mode debug symbols. So the user must declare in their D code the type of user-mode C language structures used.1
DTrace has such a large influence that many engineers port it over to several
other operating systems. For example, Apple has added DTrace support in its
Mac OS X (and later macOS) operating system. In fact, each Apple laptop or desktop
computer launched in recent years offers a ready-to-use dtrace command line
utility. Those who have an Apple computer can have a try on its command line
terminal. Alongside the Apple system, DTrace has also made its way into the
FreeBSD operating system. Not enabled by default, the DTrace kernel module in
FreeBSD must be loaded through extra user commands. Oracle has also tried to
introduce DTrace into their own Linux distribution, Oracle Linux, without much
progress though. This is because the Linux kernel is not controlled by Oracle,
but DTrace needs close integration with the operating system kernel. Similar
reasons have long left the DTrace-to-Linux porting attempted by some bold amateur
engineers to be far below the production-level requirement.
Those DTrace ports lack some advanced features here and there (it would be nice to have the floating-point number support, and they are also missing support for a lot of built-in probes etc.) In addition, they cannot really match the original DTrace implementation in the Solaris operating system.
SystemTap
Another influence of DTrace on the Linux operating system is reflected in the open-source project SystemTap, a relatively independent dynamic tracing framework built by engineers from Red Hat and other companies. SystemTap has its own little language, the SystemTap scripting language, which is not compatible with DTrace’s D language (although it does also resemble C). Serving a wide range of enterprise-level users, Red Hat naturally relies on engineers who have to cope with a lot of “weird problems” on a daily basis. The real-life demand has inevitably prompted it to develop this technology. In my opinion, SystemTap is one of the most powerful and the most usable dynamic tracing frameworks in today’s open source Linux world, and I have been using it in work for years. Authors of SystemTap, including Frank Ch. Eigler and Josh Stone are all very smart engineers full of enthusiasm. I once raised questions through their IRC channel and their mailing list, and they often answered me very quickly and in great detail. I’ve been contributing to SystemTap by adding new features and fixing bugs.
SystemTap Pros and Cons
The strengths of SystemTap include its great maturity in automatic loading of user-mode debug symbols, complete looping language structures to write complicated probe processing programs, with support for a great number of complex aggregations and statistics. Due to the immature implementation of SystemTap and Linux kernels in the early days, outdated criticisms over SystemTap have already flooded the Internet, unfortunately. In the past few years we have witnessed significant improvements in it. In 2017, I established OpenResty Inc. which have also been helping improve SystemTap.
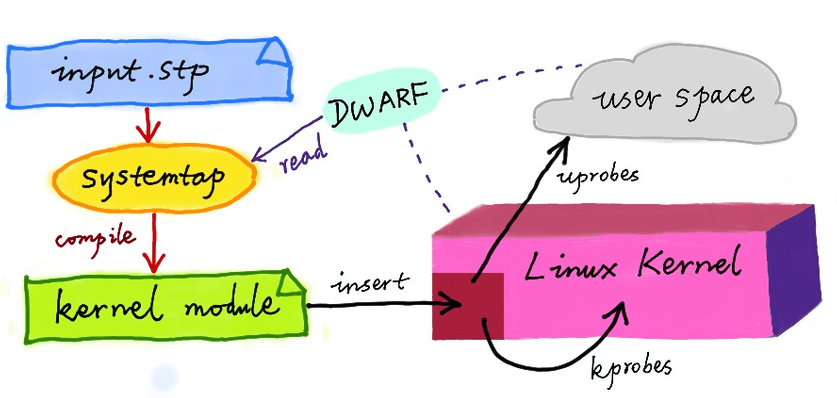
Of course, SystemTap is not perfect. Firstly, it’s not a part of the Linux kernel, and such lack of close integration with the kernel means SystemTap has to keep track of changes in the mainline kernel all the time. Secondly, SystemTap usually complies (or “translates”) its language scripts (in its own language) into C source code of a Linux kernel module. It is therefore often necessary to deploy the full C compiler toolchain and the header files of the Linux kernel in online systems2. For these reasons, SystemTap script starts much more slowly than DTrace, and at a speed similar to JVM. Overall, SystemTap is still a very mature and outstanding dynamic tracing framework despite these shortcomings3.
DTrace and SystemTap
Neither DTrace nor SystemTap supports writing complete debugging tools as both lack convenient primitives for command-line interactions. This is why a slew of real world tools based on them have come with wrappers written in Perl, Python, and even Shell script4. To use a clean language to write complete debugging tools, I once extended the SystemTap language to a higher-level “macro language” called stap++5. I employed Perl to implement the stap++ interpreter capable of directly interpreting and executing stap++ source code and internally calling the SystemTap command-line tool. Those interested please visit GitHub for my open-source code repository stapxx, where many complete debugging tools backed by my stap++ macro language are available.
Applications of SystemTap in Production
The huge impact of DTrace today wouldn’t be possible without the contributions of the renowned leading expert on DTrace, Brendan Gregg. I already mentioned him before. He previously worked on the Solaris file system in Sun Microsystems, being one of the earliest users of DTrace. He authored several books on DTrace and systems performance optimization, as well as many high quality blog posts concerning dynamic tracing in general.
After leaving Taobao in 2011, I went to Fuzhou and led an “idyllic life” there for a whole year. During the last few months there, I dived into Brendan’s public blog and obsessively studied DTrace and dynamic tracing. Before that, I had never heard of DTrace until one of my Sina Weibo followers mentioned it very briefly in a comment. I was immediately intrigued and did my own research to learn more about it. Well, I would never have imagined that my exploration would lead me to a totally new world and completely change my views about the entire computing world. So I devoted a lot of time to thoroughly reading each personal blog of Brendan’s. Ultimately, my efforts paid off. Fully enlightened, I felt I could finally take the subtleties of dynamic tracing in.
Then in 2012, my “idyllic life” in Fuzhou came to an end and I left for the US to join a CDN service provider and network security company. I immediately started to apply SystemTap and the whole set of dynamic tracing methods I had acquired to the company’s global network, to solve those very weird, very strange online problems. I found that my colleagues at the time would always add additional event tracking code into the software system on their own when troubleshooting online problems. They did so by directly editing the source code and adding various counters, or event tracking code to emit log data, primarily to the applications’ Lua code, and sometimes even to the code base of systems software like Nginx. In this way, a large number of logs would be collected online in real time, before entering the special database and going through offline analysis. However, their practice clearly brought colossal costs. This not only raised the cost related to hacking and maintaining the business system sharply, but also the online costs resulting from full-volume data collection and storage of enormous amounts of log data. Moreover, the following situation is not uncommon: Engineer A adds an event tracking code in the business code and Engineer B does the same later. However, they may end up being forgotten and left in the code base, without being noticed again. The final result would only be that these endlessly increasing events mess up the code base. And the invasive revisions would make corresponding software, whether system software or business code, more and more difficult to maintain.
Two serious problems exist in the way metrics and event tracking code is done. The first one is “too many” event tracking counters and logging statements are added. Out of a desire to cover all, we tend to gather some totally useless information, leading to unnecessary collection and storage costs. Even if sampling is already enough to analyze problems in many cases, the habitual response is still carrying out whole-network and full-volume data collection, which is clearly very expensive in the long run. The second problem is when “too few” counters and logging are added. It is often very difficult to plan all necessary information collection points in the first place, as no one can predict future problems needing troubleshooting. Consequently, whenever a new problem emerges, existing information collected is almost always insufficient. What follows is to revise the software system and conduct online operations frequently, causing much heavier workload to development and maintenance engineers, and higher risk of more severe online incidents.
Another brute force debugging method some maintenance engineers often use is to drop the servers offline, and then set a series of temporary firewall rules to block or screen user traffic or their own monitoring traffic, before fiddling with the production machine. This cumbersome process has a huge impact; firstly, as the machine is unable to continue its services, the overall throughput of the entire online system is impaired; secondly, problems which are reproduced only when real traffic exists will no longer occur. You can imagine how frustrating it will be.
Fortunately, SystemTap dynamic tracing offers an ideal solution to such problems while avoiding those headaches. You don’t have to change the software stack itself, be it systems software or business-level applications. I often write some dedicated tools that place dynamic probes on the “key spots” of the relevant code paths. These probes collect information separately, which will be combined and transmitted by the debugging tools to the terminal. This way of doing things enables me to quickly get key information I need through sampling on one or more machines, and obtain quick answers to some very basic questions to navigate subsequent (deeper) debugging work.
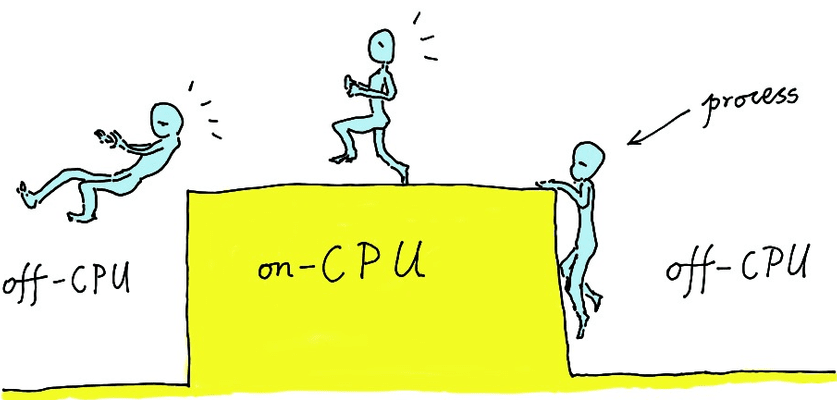
We earlier mentioned manually adding metrics & event tracking/logging code into the production systems to record logs and putting them in a database. The manual work is a far inferior strategy compared to seeing the whole production system as a directly accessible “database” from which we can obtain the needed information in a safe and quick manner, without leaving any trace. Following this train of thought, I wrote a number of debugging tools, most being open-sourced on GitHub. Many of these tools were targeted at systems software such as Nginx, LuaJIT and the operating system kernel, and some focused on higher-level Web frameworks like OpenResty. GitHub offers access to the following code repositories: nginx-systemtap-toolkit, perl-systemtap-toolkit and stappxx.
These tools helped me identify a lot of online problems, some even unexpectedly. We will walk through five examples below.
Case #1: Slow Debugging Code Left in Production
The first example is an accidental discovery when I analyzed the online Nginx process using the SystemTap-based Flame Graph. I noticed a big portion of CPU time was spent on a very strange code path. The code path turned out to be some temporary debugging statements left by one of my former colleagues when debugging an ancient problem. It’s like the “event tracking code” mentioned above. Although the problem had long been fixed, the debugging statements were left there forgotten, both online and in the company’s code repository. The existence of that piece of code came at a high price —— ongoing performance overhead was going unnoticed. The approach I used was sampling so that the tool can automatically draw a Flame Graph (the specifics of which we will cover in detail in Part 2.) From the graph, I can understand the problem and take measures accordingly. This process is much more efficient.
Case #2: Long request latency outliers
Long delays may be seen only in a very small portion of all the online requests, or “request latency outliers”. Though small in numbers, they may have delays on the level of whole seconds. I used to run into such things a lot. For example, one former colleague just took a wild guess that my OpenResty had a bug. Unconvinced, I immediately wrote a SystemTap tool for online sampling to analyze those requests delayed by over one second. The tool can directly test the internal time distribution of problematic requests, including delay of each typical I/O operation and pure CPU computing delay in the course of request handling. It soon found the delay appeared when OpenResty accessed the DNS server written in Go. Then the tool output detailed about those long-tailed DNS queries, which were all related to CNAME. Well, mystery solved! The delay had nothing to do with OpenResty. And the finding paved the way for further investigation and optimization.
Case #3: From Network Issues to Disk Issues
Our third example is very interesting. It’s about shifting from network problems to hard disk issues in debugging. My former colleagues and I once noticed machines in a computer room showed a higher ratio of network timeout errors than the other colocations or data centers, albeit at a mere 1 percent. At first, we naturally paid attention to the network protocol stack. However, a series of dedicated SystemTap tools focusing directly on those outlier requests later led me to a hard disk configuration issue. First-hand data steered us to the correct track very quickly. A presumed network issue turned out to be a hard disk problem.
Case #4: File Handle Cache Tradeoffs
The fourth example turns to the Flame Graphs again. In the CPU flame graph for online nginx processes, we observed a phenomenon in the Nginx process: file opening and closing operations took a significant portion of the total CPU time. Our natural response was to initiate the file-handle caching of Nginx itself, without yielding any noticeable optimization results. With a new flame graph sampled, however, we found the “spin lock” used in the cache meta data now took a lot of CPU time. All became clear via the flame graph. Although we initiated the caching, it had been set at so large a size that its benefits were voided by the overhead of the meta data spin lock. Imagine that if we had no flame graphs and just performed black-box benchmarks, we would have reached the wrong conclusion that the file-handle cache of Nginx was useless instead of tuning cache parameters.
Case #5: Compiled Regex Cache Tuning
Now comes our last example for this section. After one online release operation, I remembered, the latest online flame graph revealed that the operation of compiling regular expressions consumed a lot of CPU time, but the caching of the compiled regular expression had already been enabled online. Apparently the number of regular expressions used in our business system had exceeded the maximum cache size. Accordingly, the next thing that came to my mind was simply to increase the cache size for online regular expressions. As expected, the bottleneck then immediately disappeared from our online flame graphs after the cache size growth.
Wrapping up
These examples demonstrate that new problems will always occur and vary depending on the data centers, the servers, and even the time period of the day on the same machine. Whatever the problem, the solution is to analyze the root cause of the problem directly and take online samples from the first scene of events, instead of jumping into trials and errors with wild guesses. With the help of powerful observability tools, troubleshooting can actually yield much more with much less effort.
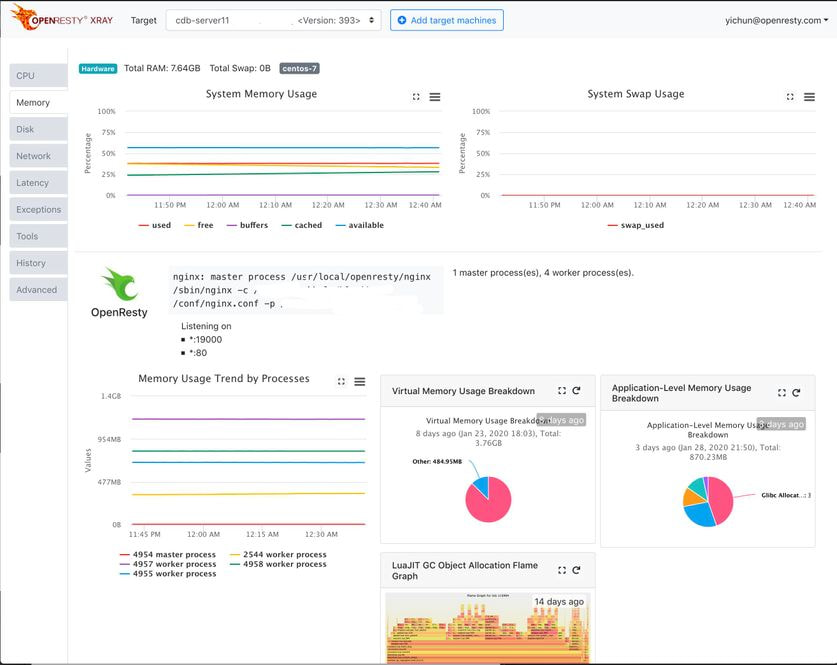
After we founded OpenResty Inc., we developed OpenResty XRay as a brand new dynamic tracing platform, putting an end to manual uses of open-source solutions like SystemTap.
Conclusion
In this part, we introduced the concept of dynamic tracing on a very high level and two famous dynamic tracing frameworks, DTrace and SystemTap. In Part 2 of this series, we will talk about a very powerful visualization method to analyze resource usage across all software code paths, Flame Graphs and the methodology commonly used in the troubleshooting process involved with dynamic tracing technologies.
A Word on OpenResty XRay
OpenResty XRay is a commercial dynamic tracing product offered by our OpenResty Inc. company. We use this product in our articles like this one to demonstrate implementation details, as well as provide statistics about real-world applications and open-source software. In general, OpenResty XRay can help users gain deep insight into their online and offline software systems without any modifications or any other collaborations, and efficiently troubleshoot difficult problems for performance, reliability, and security. It utilizes advanced dynamic tracing technologies developed by OpenResty Inc. and others.
We welcome you to contact us to try out this product for free.
About The Author
Yichun Zhang (Github handle: agentzh), is the original creator of the OpenResty® open-source project and the CEO of OpenResty Inc..
Yichun is one of the earliest advocates and leaders of “open-source technology”. He worked at many internationally renowned tech companies, such as Cloudflare, Yahoo!. He is a pioneer of “edge computing”, “dynamic tracing” and “machine coding”, with over 22 years of programming and 16 years of open source experience. Yichun is well-known in the open-source space as the project leader of OpenResty®, adopted by more than 40 million global website domains.
OpenResty Inc., the enterprise software start-up founded by Yichun in 2017, has customers from some of the biggest companies in the world. Its flagship product, OpenResty XRay, is a non-invasive profiling and troubleshooting tool that significantly enhances and utilizes dynamic tracing technology. And its OpenResty Edge product is a powerful distributed traffic management and private CDN software product.
As an avid open-source contributor, Yichun has contributed more than a million lines of code to numerous open-source projects, including Linux kernel, Nginx, LuaJIT, GDB, SystemTap, LLVM, Perl, etc. He has also authored more than 60 open-source software libraries.
Translations
We provide a Chinese translation for this article on blog.openresty.com We also welcome interested readers to contribute translations in other languages as long as the full article is translated without any omissions. We thank anyone willing to do so in advance.
Neither SystemTap nor OpenResty XRay has these restrictions. ↩︎
SystemTap also supports the “translator server” mode which can remotely compile its scripts on some dedicated machines. But it is still required to deply the C compiler tool chain and header files on these “server” machines. ↩︎
OpenResty XRay’s dynamic tracing solution has overcome SystemTap’s these shortcomings. ↩︎
Alas. The newer BCC framework targeting Linux’s eBPF technology also suffers from such ugly tool wrappers for its standard usage. ↩︎
The stap++ project is no longer maintained and has been superseded by the new generation of dynamic tracing framework provided by OpenResty XRay. ↩︎


 Tool Cloud My SystemTap Tool Cloud](/images/systemtap-tool-cloud.png)
