Why Dynamic Tracing is the Future of Production Troubleshooting
Has your team ever felt like you’re playing a guessing game? A production service suddenly triggers an alert, yet your monitoring dashboards and logs offer zero clues. What if you could talk directly to your live production system? Instead of endlessly scrolling through logs, you could just ask it, “What exactly are you busy with? Which function, which specific line of code, is slowing everything down?” and get a precise, immediate answer. Imagine that.
This article will introduce you to a technology that is changing the industry: Dynamic Tracing. It’s the very key to having that “conversation with your system.” We’ll explore why so many traditional tools are becoming ineffective against today’s complex, next-generation systems. We’ll also share how OpenResty XRay uses the superpower of dynamic tracing to free engineers from problems that could otherwise take days or even weeks to diagnose. It’s a true game-changer, compressing troubleshooting time down to a matter of hours.
The Unseen Crisis in Modern Software
It’s 3 AM, and your phone shatters the silence. A slowdown or outage is crippling a core service, yet every dashboard is a sea of green. Your team scrambles onto an emergency call, everyone staring at their screens, but no one knows where to even begin to pinpoint and resolve issues. Does this scenario feel a little too familiar?
The root of the problem is that modern software systems are incredibly complex “black boxes.” From the OS kernel and databases to web servers, virtual machines, and application code, each layer of abstraction that boosts development efficiency also erects another wall against effective root cause analysis.
This complexity is magnified in today’s cloud-native world:
- Technology Stack Proliferation: With the rise of containers and microservices, the number of application instances has multiplied. The coexistence of various tech stacks and distributions increases system complexity exponentially.
- A Lack of Observability: In the pursuit of lightweight images, containers are often stripped of essential debugging tools, making it significantly harder to debug problems in microservices when they occur.
- Elusive Root Causes: While the ability to rapidly destroy and recreate containers improves system resilience, it also tends to erase the “crime scene” of a software failure, making root cause analysis nearly impossible.
This dilemma isn’t just a technical challenge; it translates directly into business losses:
- Costly Service and Application Downtime: Service degradation or outages directly impact transactions and can lead to SLA violations that severely damage your bottom line.
- Wasted Time: Your top engineers are no longer creating value. Instead, they’re forced to spend days, or even weeks, playing a guessing game to pinpoint and resolve issues.
- Frictionless Customer Experiences at Risk: Persistent performance issues and unstable services will inevitably degrade the customer experience, making it impossible to consistently deliver frictionless customer experiences and causing you to lose valuable clients.
Why Traditional Tools Are Failing
As modern systems grow in complexity, traditional tools are falling behind, revealing their fundamental weaknesses:
- Lack of Deep Insight: Most traditional tools only scratch the surface with high-level metrics. They might flag an issue, but they can’t explain the “why.” When problems are buried deep in your application code, third-party libraries, or even the kernel, these tools hit a wall, leaving you without any path to the root cause.
- Added Complexity: Conventional APM solutions often force you to embed cumbersome agents and probes deep within your applications. This doesn’t just complicate your architecture; it can introduce new bugs, create instability, and trap your team in a frustrating cycle of monitoring the monitoring tools themselves.
- Expensive Overhead: Collecting, transmitting, and storing massive volumes of data takes a real toll on your production performance and your budget. Worse, complex data processing often leads to a storm of false positives and missed alerts, wasting your team’s valuable time and energy.
- Crippling Delays: The traditional workflow—from anomaly detection and data collection to manual analysis and eventual remediation—is painfully slow. This time lag is a critical failure when you need to adapt to the rapid pace of modern business.
It’s time for a new approach. We need a way to interrogate any running system—safely, non-intrusively, and in real time—to get the answers we need, right when we need them.
Dynamic Tracing: The New Paradigm for Troubleshooting
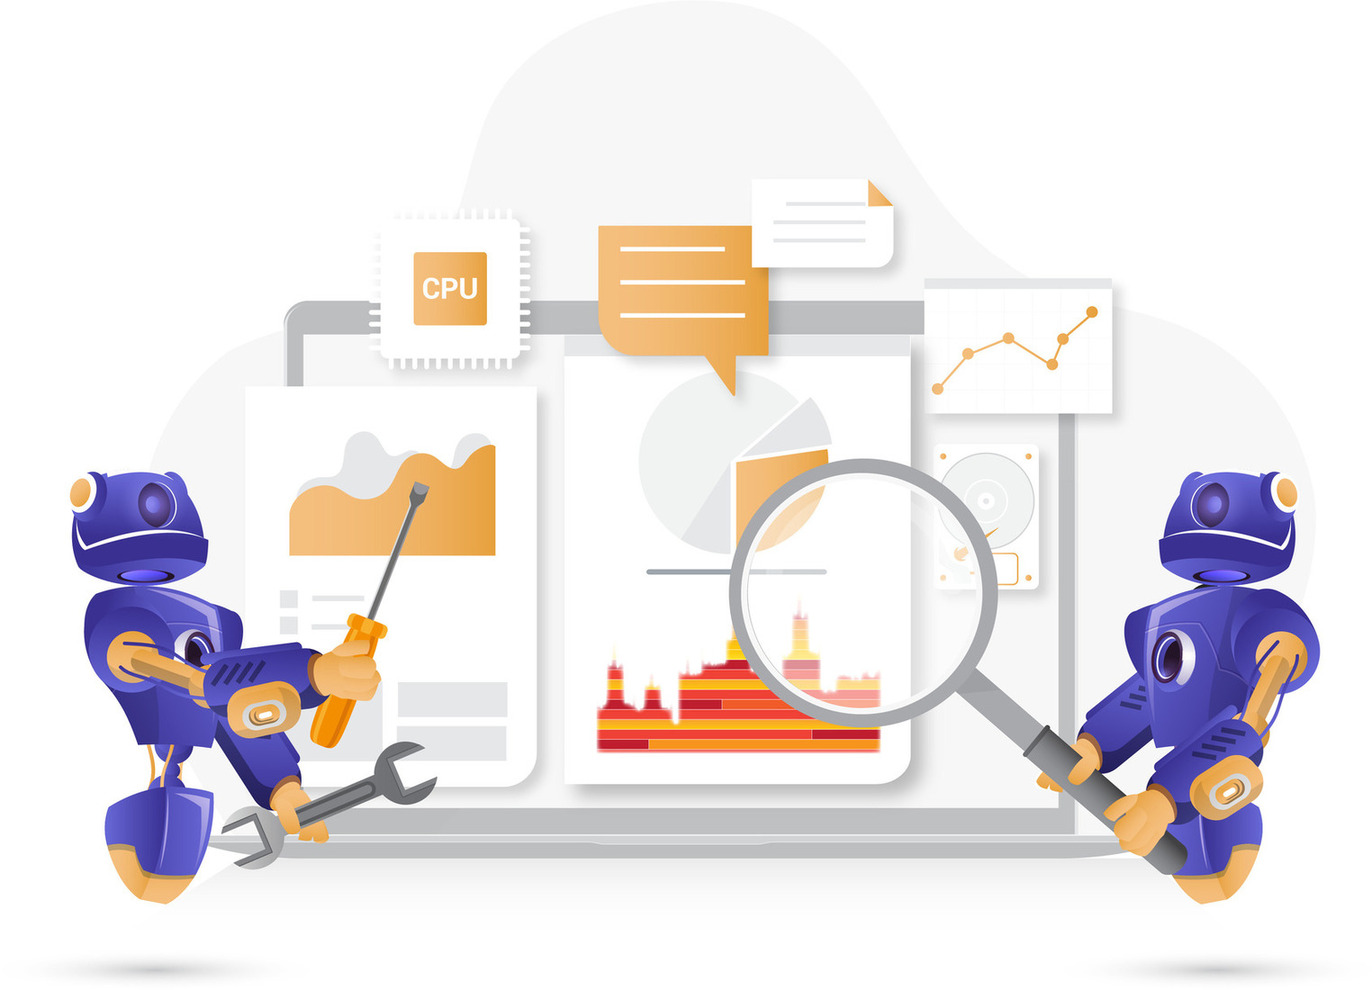
Think of dynamic tracing technology as a “CT scanner” for your software systems. It treats any of your running processes and containers as a read-only database. From this database, you can safely and precisely extract all the information you need to solve problems—be it performance bottlenecks, application errors, or security vulnerabilities.
Best of all, this process is truly “hot-pluggable” and non-intrusive. You don’t need to modify your application code, install any plugins or modules, restart your services, or even use special compilation or startup options. It never injects any code into your processes, observing them purely from the outside.
This capability revolutionizes the entire process from spotting an anomaly to fixing the problem. It enables you to:
- Real-time Insight: Get answers the moment a problem occurs, just like querying a database, instead of digging through logs after the fact.
- Absolute Safety: Treat your production system as read-only. With no code modifications, restarts, or injections required, there is zero interference with your business operations.
- Pinpoint Accuracy: Dive deep into the system to identify the exact line of code causing an issue, even without access to the source code. Say goodbye to guesswork for good.
The OpenResty XRay Difference
Dynamic tracing technology is evolving rapidly, but achieving high efficiency, low intrusiveness, and easy implementation remains a major industry challenge. OpenResty XRay is leading the charge with a groundbreaking solution.
Unlocking the “Black Box” of Closed-Source Software
- Most dynamic tracing tools are powerless against closed-source software that lacks debugging symbols, such as commercial databases or third-party libraries. You’re left unable to understand what’s truly happening inside the “black box.”
- We built OpenResty XRay to see through most components in your system, whether they are open-source or closed-source. This is the core differentiator that sets us apart from any other tool on the market.
Unifying the “Tower of Babel” of Tech Stacks
Modern applications are a complex mix of multiple languages and technologies. Flame graphs are great, but you might need one tool for your C applications, another for Python, and yet another for system metrics. You’re then forced to manually piece together these fragmented insights.
We firmly believe that “fragmented information is no information at all.” That’s why we are dedicated to building a unique, unified solution:
- Richer Flame Graphs: We support a wide array of programming languages like Lua, Python, Perl, and Go, as well as various system metrics such as CPU usage and memory distribution. Flame graphs are a powerful and intuitive tool for performance analysis. They provide a complete panoramic view of your system’s performance in a single, compact visualization, making critical bottlenecks instantly obvious, no matter how complex the software. Unlike traditional profilers, flame graphs cut through the noise, allowing you to quickly focus on the critical paths that truly impact performance. Unimportant code fades into the background while hotspots stand out, ensuring every optimization effort is spent where it counts the most. To learn how to interpret a flame graph, check out this introduction to Lua-level CPU flame graphs.
- The Ylang Language: A universal front-end language for various debugging and dynamic tracing frameworks. Its greatest strength is its ability to transcend different tech stacks and application scenarios, eliminating the need to develop redundant code for each specific context. With a single Ylang tool, users can flexibly perform complex tasks like online tracing and core dump analysis across multiple frameworks and systems, dramatically boosting versatility and efficiency. Furthermore, the Ylang compiler offers exceptional semantic fidelity, ensuring that meaning is strictly preserved across different back-end environments. This prevents discrepancies in debugging results, significantly saving on labor and maintenance costs, and truly delivering on the promise of “write once, run anywhere.”
- Fully Automated Analysis Reports: OpenResty XRay now delivers fully automated, human-readable, real-time analysis reports. It acts like a 24/7 super-doctor for your software, continuously monitoring its health. It automatically analyzes applications written in various languages and consolidates these findings with other system metrics into automatically generated system reports. By providing deep insights and actionable recommendations, it completely transforms the experience of troubleshooting and system optimization.
Starting from a high-level flame graph, the final analysis report allows you to clearly trace a single request as it travels through your Java, Go, or Python code, all the way down to the kernel. Pinpointing bottlenecks within a single, consolidated report boosts diagnostic efficiency by an order of magnitude.
Escape the Performance ‘Observer’ Dilemma
Every diagnostic tool faces a critical question: “Can you run this on our core production services?” Traditional APM tools, with their constant in-memory presence and continuous data collection, introduce significant performance overhead.
We’ve completely solved this problem with our innovative Automatic On-Demand Sampling method.
- Precision Targeting: Trace only the code paths and functions relevant to the problem—nothing extra.
- Lightweight & Efficient: We collect far less information than traditional APMs and aggregate it at the source, dramatically reducing data volume and analytical load.
- Extreme Low Overhead: When not sampling, the performance overhead is strictly zero. Even during sampling, the overhead is often too low to measure.
You can use OpenResty XRay in any production environment without hesitation. Think of it as an on-call doctor for your systems: it stays out of the way during normal operation but intervenes with precision when a problem arises, without making the “patient” worse.
From Firefighting to True Observability
Don’t let a complex software stack be the bottleneck for your business growth. While traditional tools are still just scratching the surface, OpenResty XRay delivers global, bone-deep insights into your entire system.
- How did Bilibili quickly resolve a major incident involving maxed-out CPU and stalled requests in their gateway system? Read about it here: Analyzing and Resolving a Major Production Incident at Bilibili with OpenResty XRay.
- Curious how we helped a client fix high CPU usage on their Kong servers and even squashed a bug in a custom plugin along the way? See how we did it: Real-time Profiling of High CPU and Memory Usage in Kong Plugins on Production.
- Want to see how Yundun used XRay to solve a high memory consumption issue in half a day, reducing usage by over 60%? Find out more: How OpenResty XRay Helped Yundun Analyze and Fix Memory Problems.
We believe complex systems can be transparent and that technical teams can operate with calm efficiency. OpenResty XRay turns your black boxes into white boxes, rapidly pinpoints root causes, and frees your team from tedious troubleshooting. Our mission is to empower you to focus on what matters most: innovation and business growth.
Additionally, OpenResty Inc. offers powerful private library services for industries like finance, e-commerce, travel, and media. We provide mature, reliable solutions for performance optimization, security, and data processing, helping businesses build highly efficient and secure applications.
What is OpenResty XRay
OpenResty XRay is a dynamic-tracing product that automatically analyzes your running applications to troubleshoot performance problems, behavioral issues, and security vulnerabilities with actionable suggestions. Under the hood, OpenResty XRay is powered by our Y language targeting various runtimes like Stap+, eBPF+, GDB, and ODB, depending on the contexts.
If you like this tutorial, please subscribe to this blog site and/or our YouTube channel. Thank you!
About The Author
Yichun Zhang (Github handle: agentzh), is the original creator of the OpenResty® open-source project and the CEO of OpenResty Inc..
Yichun is one of the earliest advocates and leaders of “open-source technology”. He worked at many internationally renowned tech companies, such as Cloudflare, Yahoo!. He is a pioneer of “edge computing”, “dynamic tracing” and “machine coding”, with over 22 years of programming and 16 years of open source experience. Yichun is well-known in the open-source space as the project leader of OpenResty®, adopted by more than 40 million global website domains.
OpenResty Inc., the enterprise software start-up founded by Yichun in 2017, has customers from some of the biggest companies in the world. Its flagship product, OpenResty XRay, is a non-invasive profiling and troubleshooting tool that significantly enhances and utilizes dynamic tracing technology. And its OpenResty Edge product is a powerful distributed traffic management and private CDN software product.
As an avid open-source contributor, Yichun has contributed more than a million lines of code to numerous open-source projects, including Linux kernel, Nginx, LuaJIT, GDB, SystemTap, LLVM, Perl, etc. He has also authored more than 60 open-source software libraries.


