How CPU Time is Spent inside Go’s CockroachDB (using OpenResty XRay)
In this tutorial, we will demonstrate how the CPU time is spent quantitatively inside Go’s CockroachDB with OpenResty XRay. We will show the most CPU-intensive Go code paths in it. OpenResty XRay will automatically analyze and interpret the Go (golang) language level CPU flame graph.
Problem: high CPU usage
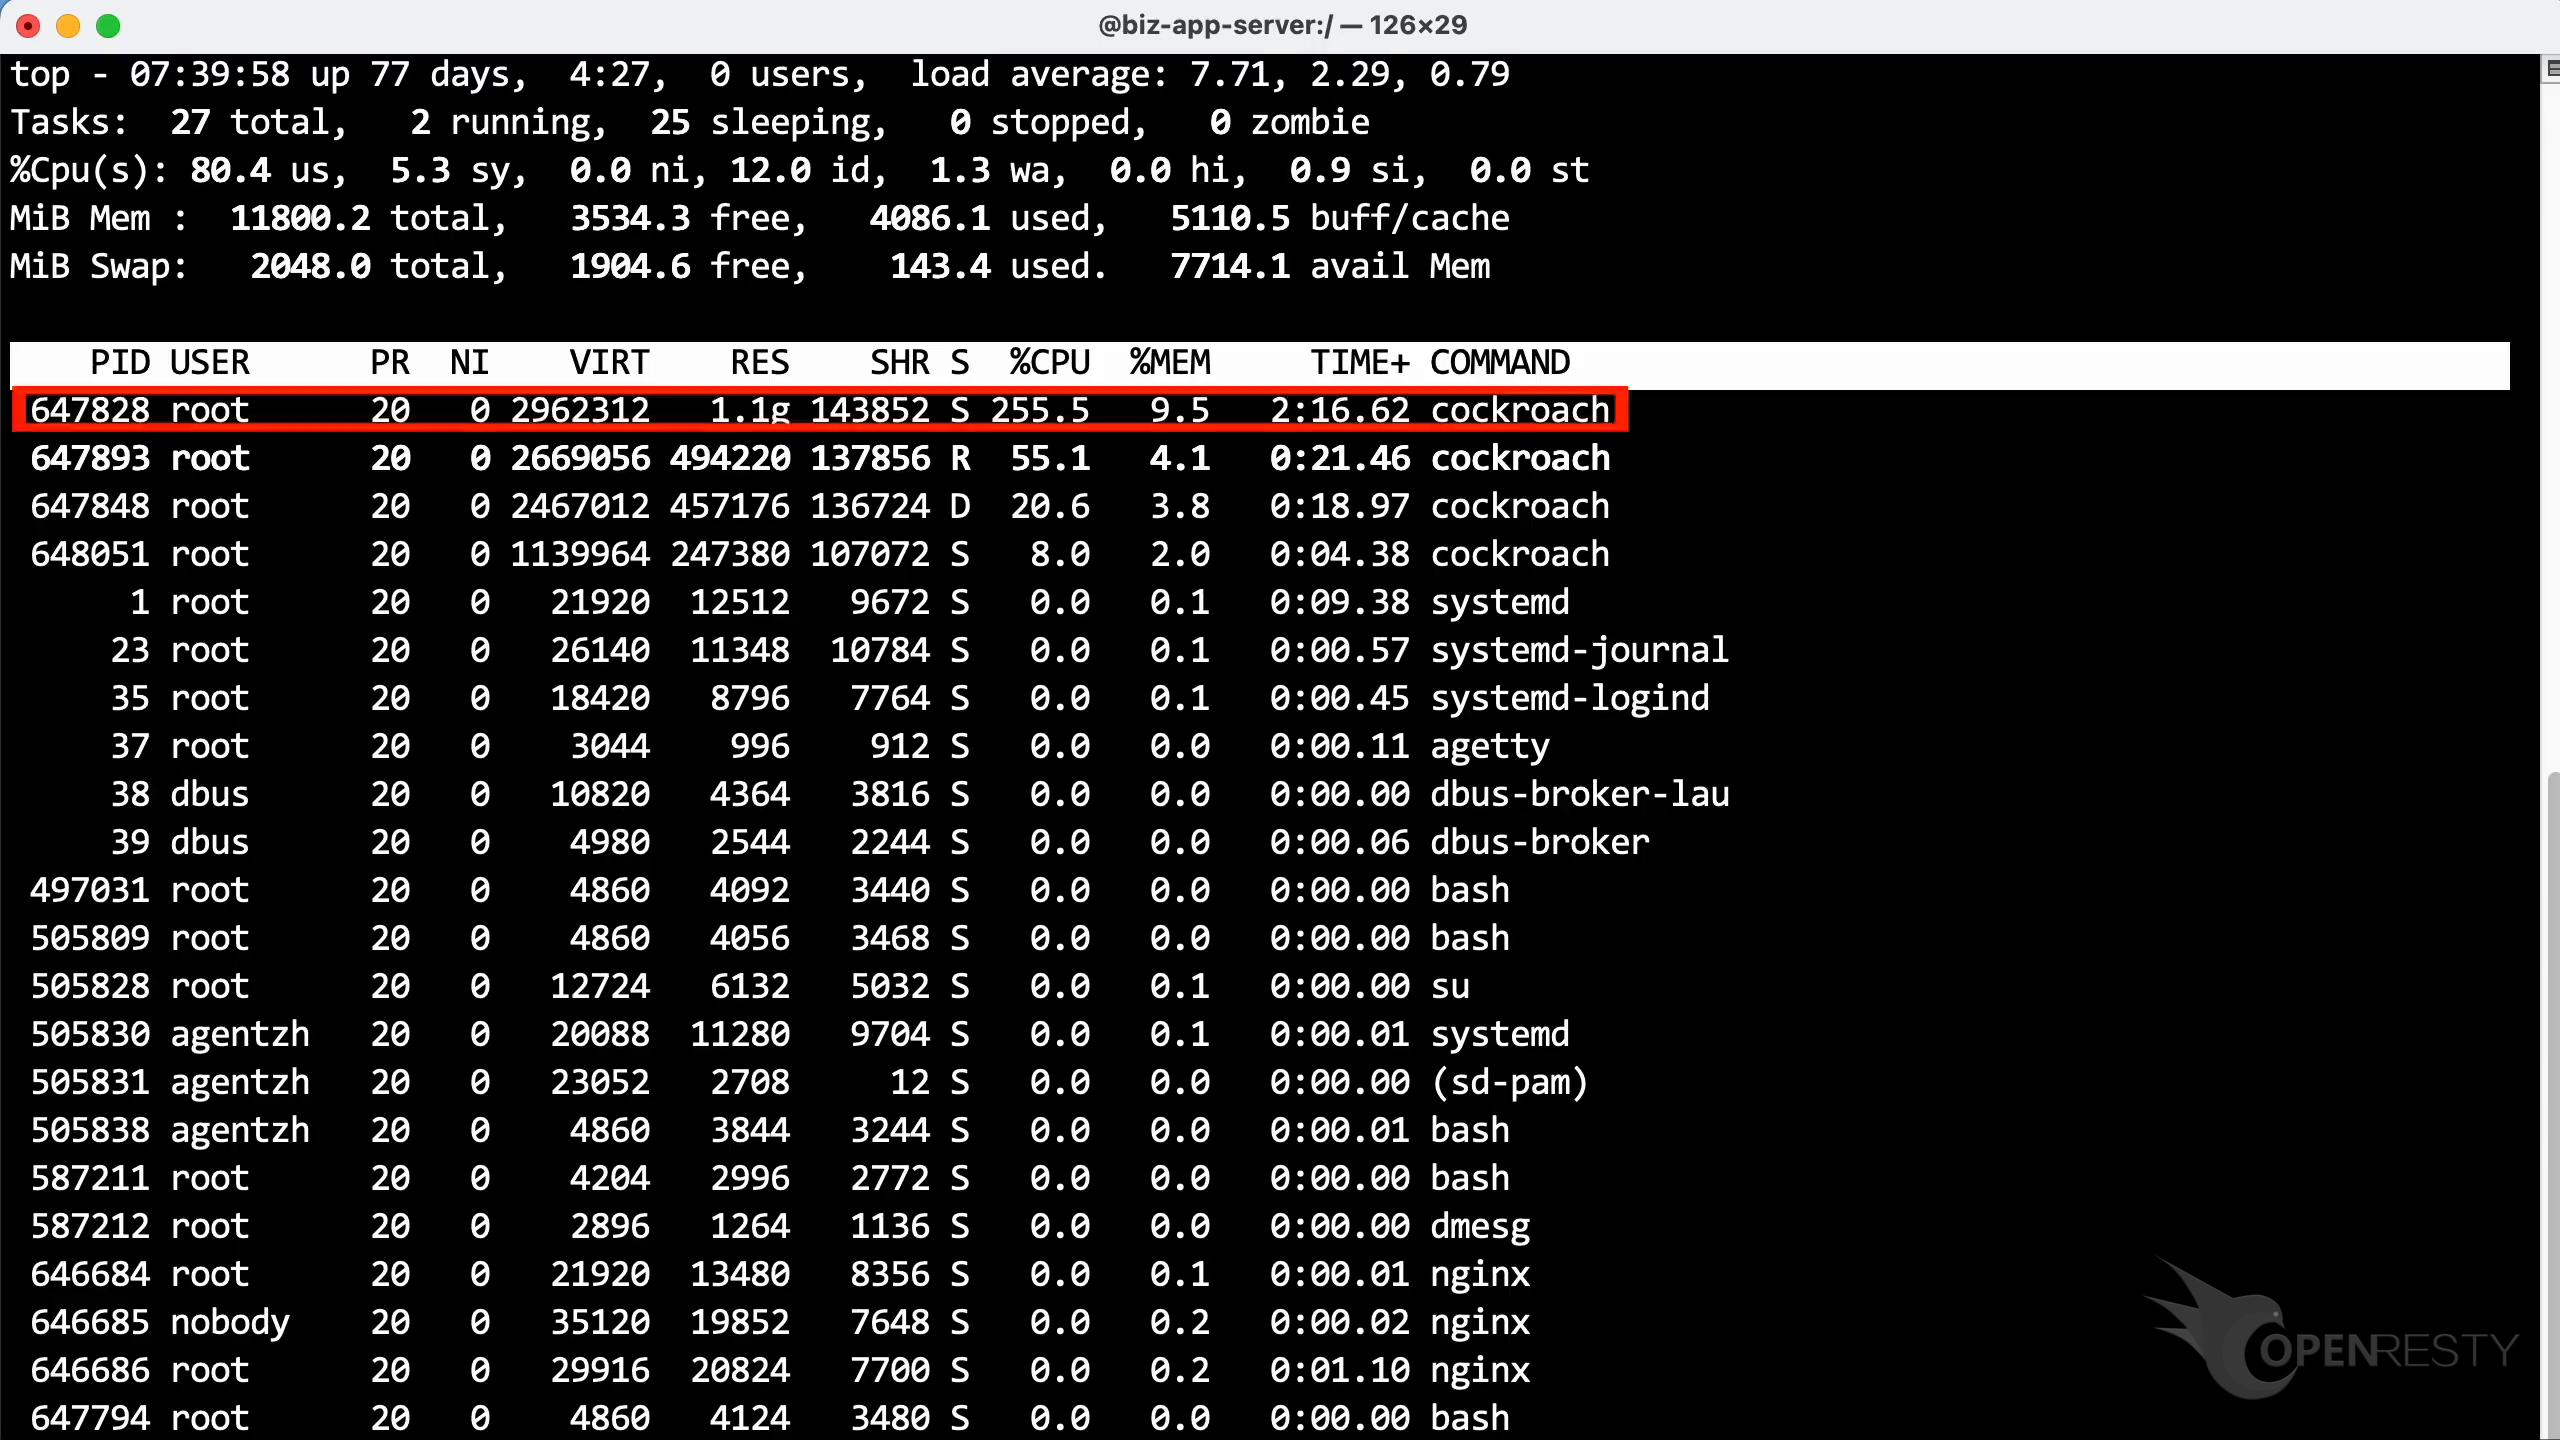
CockroachDB is a distributed database written in the Go(golang) programming language. We’ll analyze how CPU time is distributed inside a running CockroachDB server.
Run the top command to check the CPU usage. As shown, this process consumes more than 250% of CPU cores.
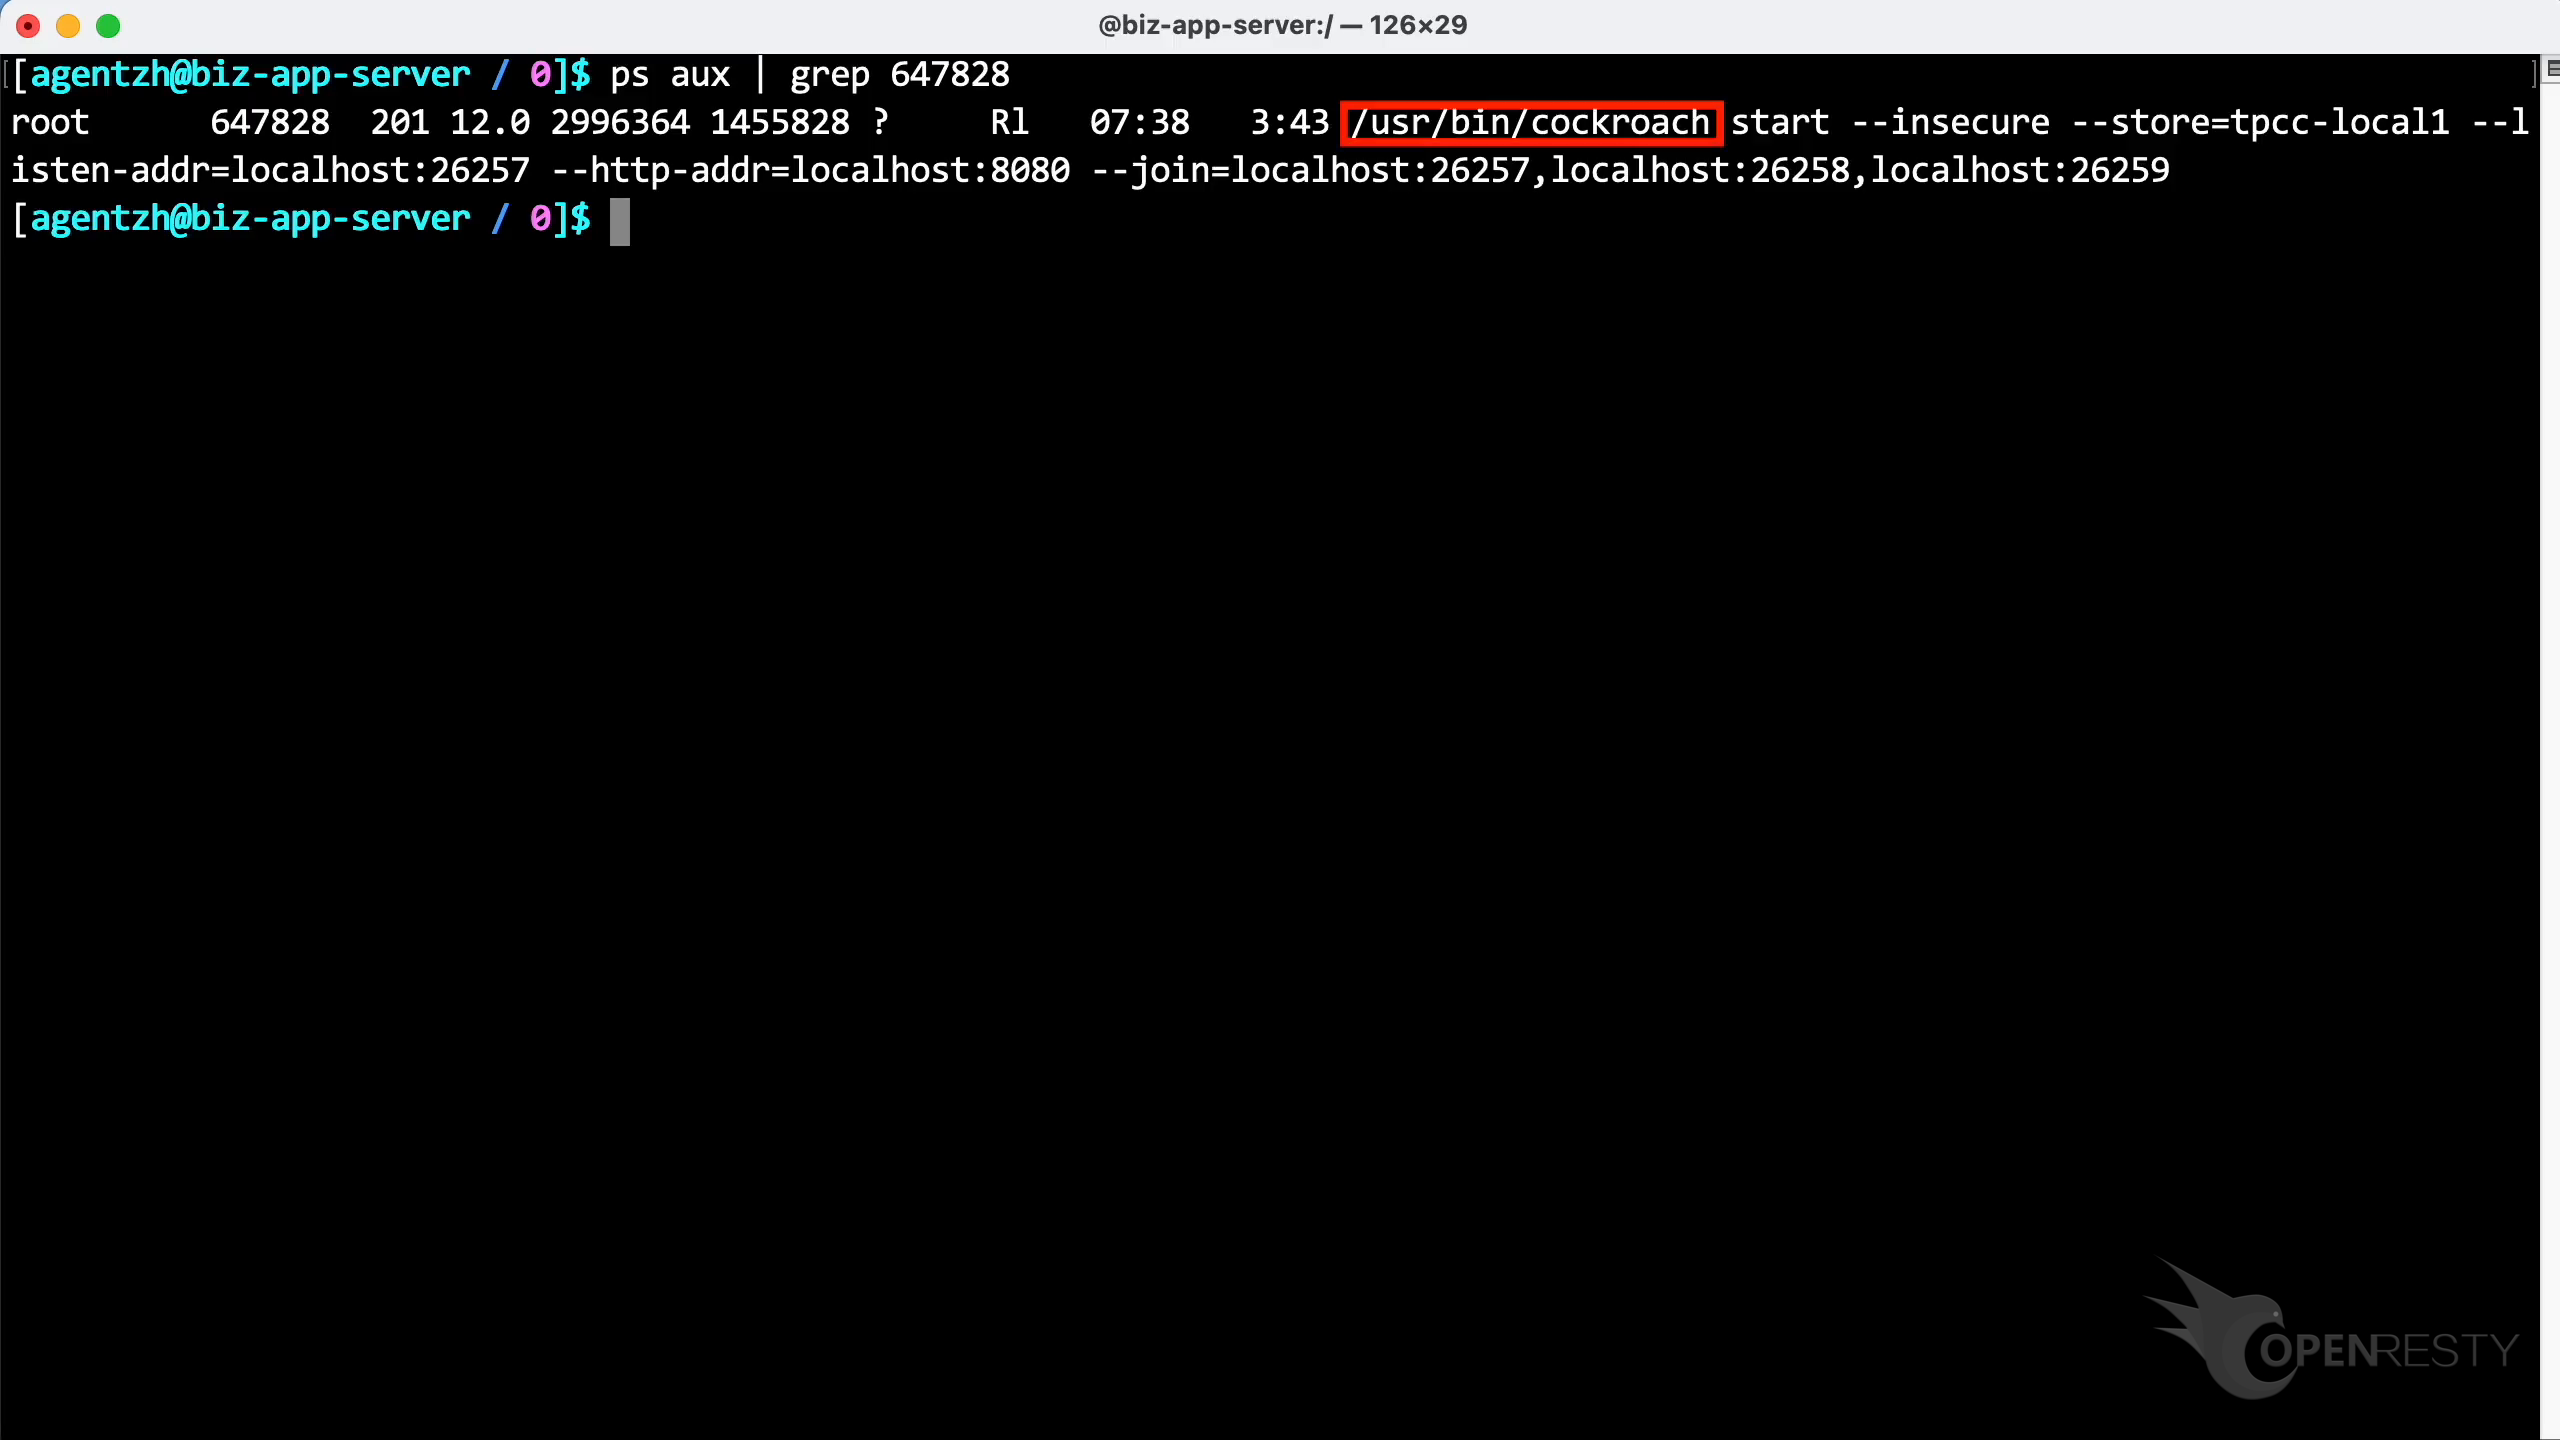
Let’s run the ps command to see more details about this process. We can see it is the standard CockroachDB binary executable shipped with the Linux distribution.
Use the guidede analysis feature of OpenResty XRay to spot the most CPU-intensive Go code paths
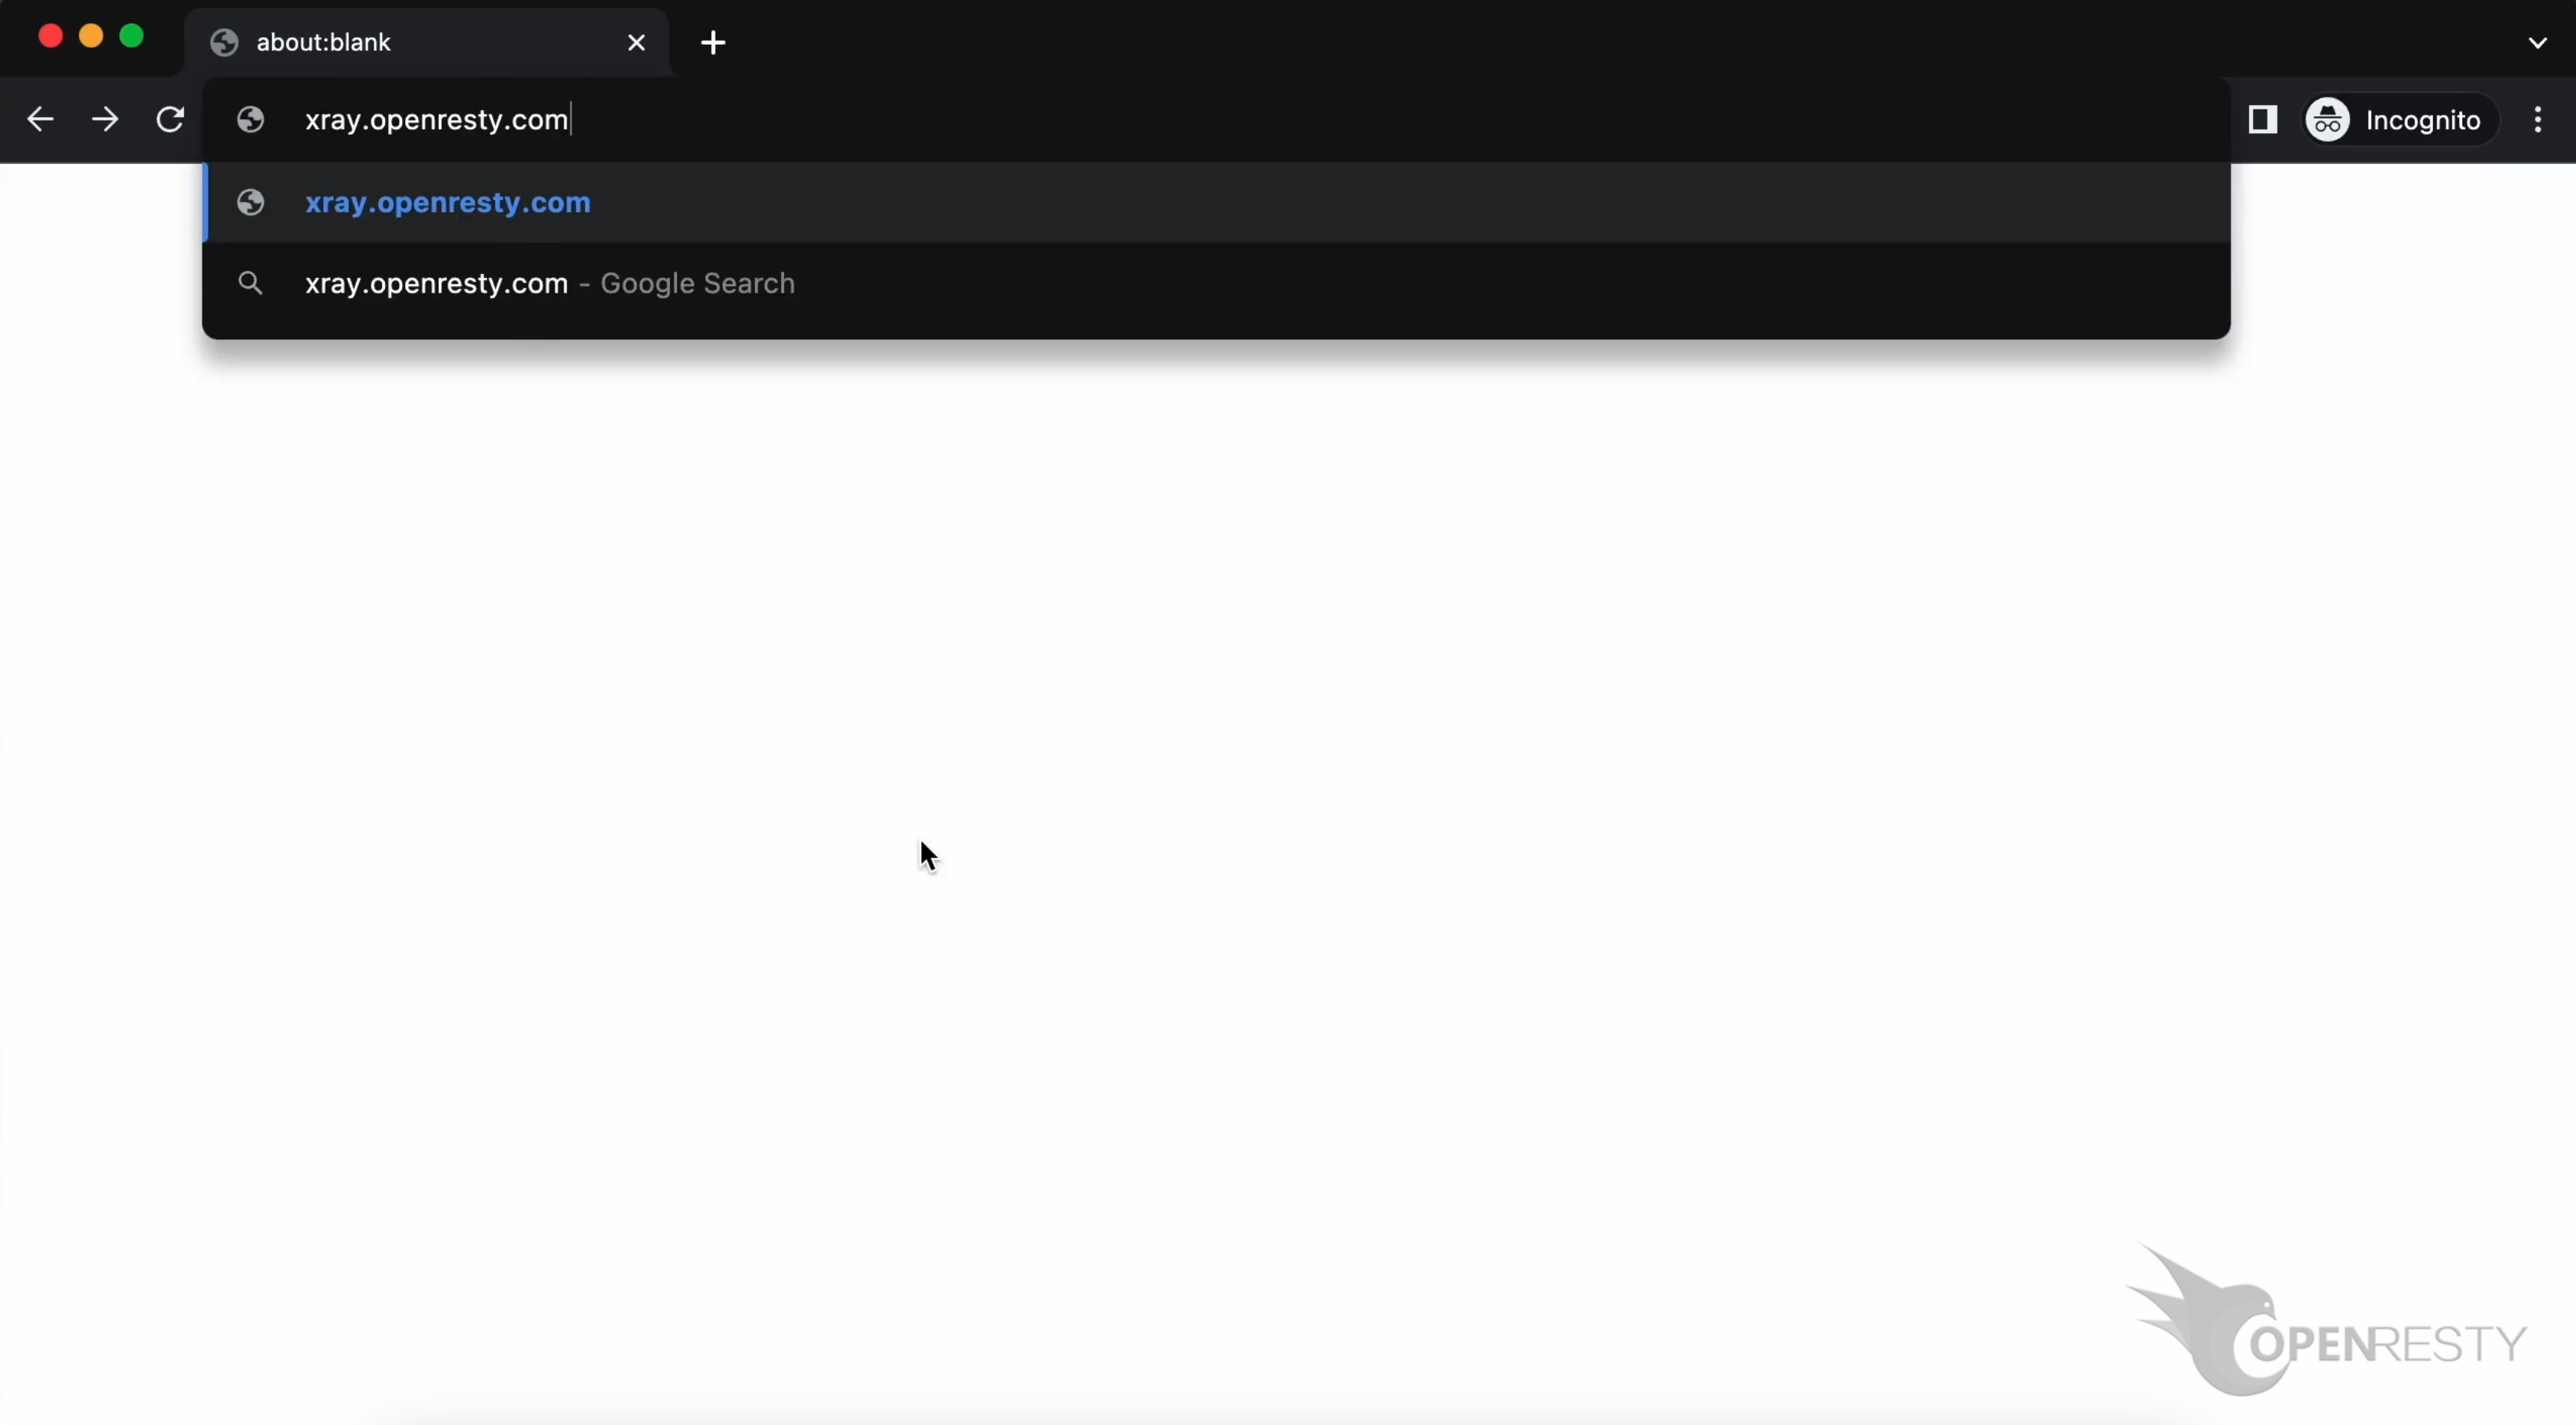
Let’s use OpenResty XRay to check this unmodified process. You can analyze it in real-time and figure out what is happening. Open the OpenResty XRay web console in the web browser.
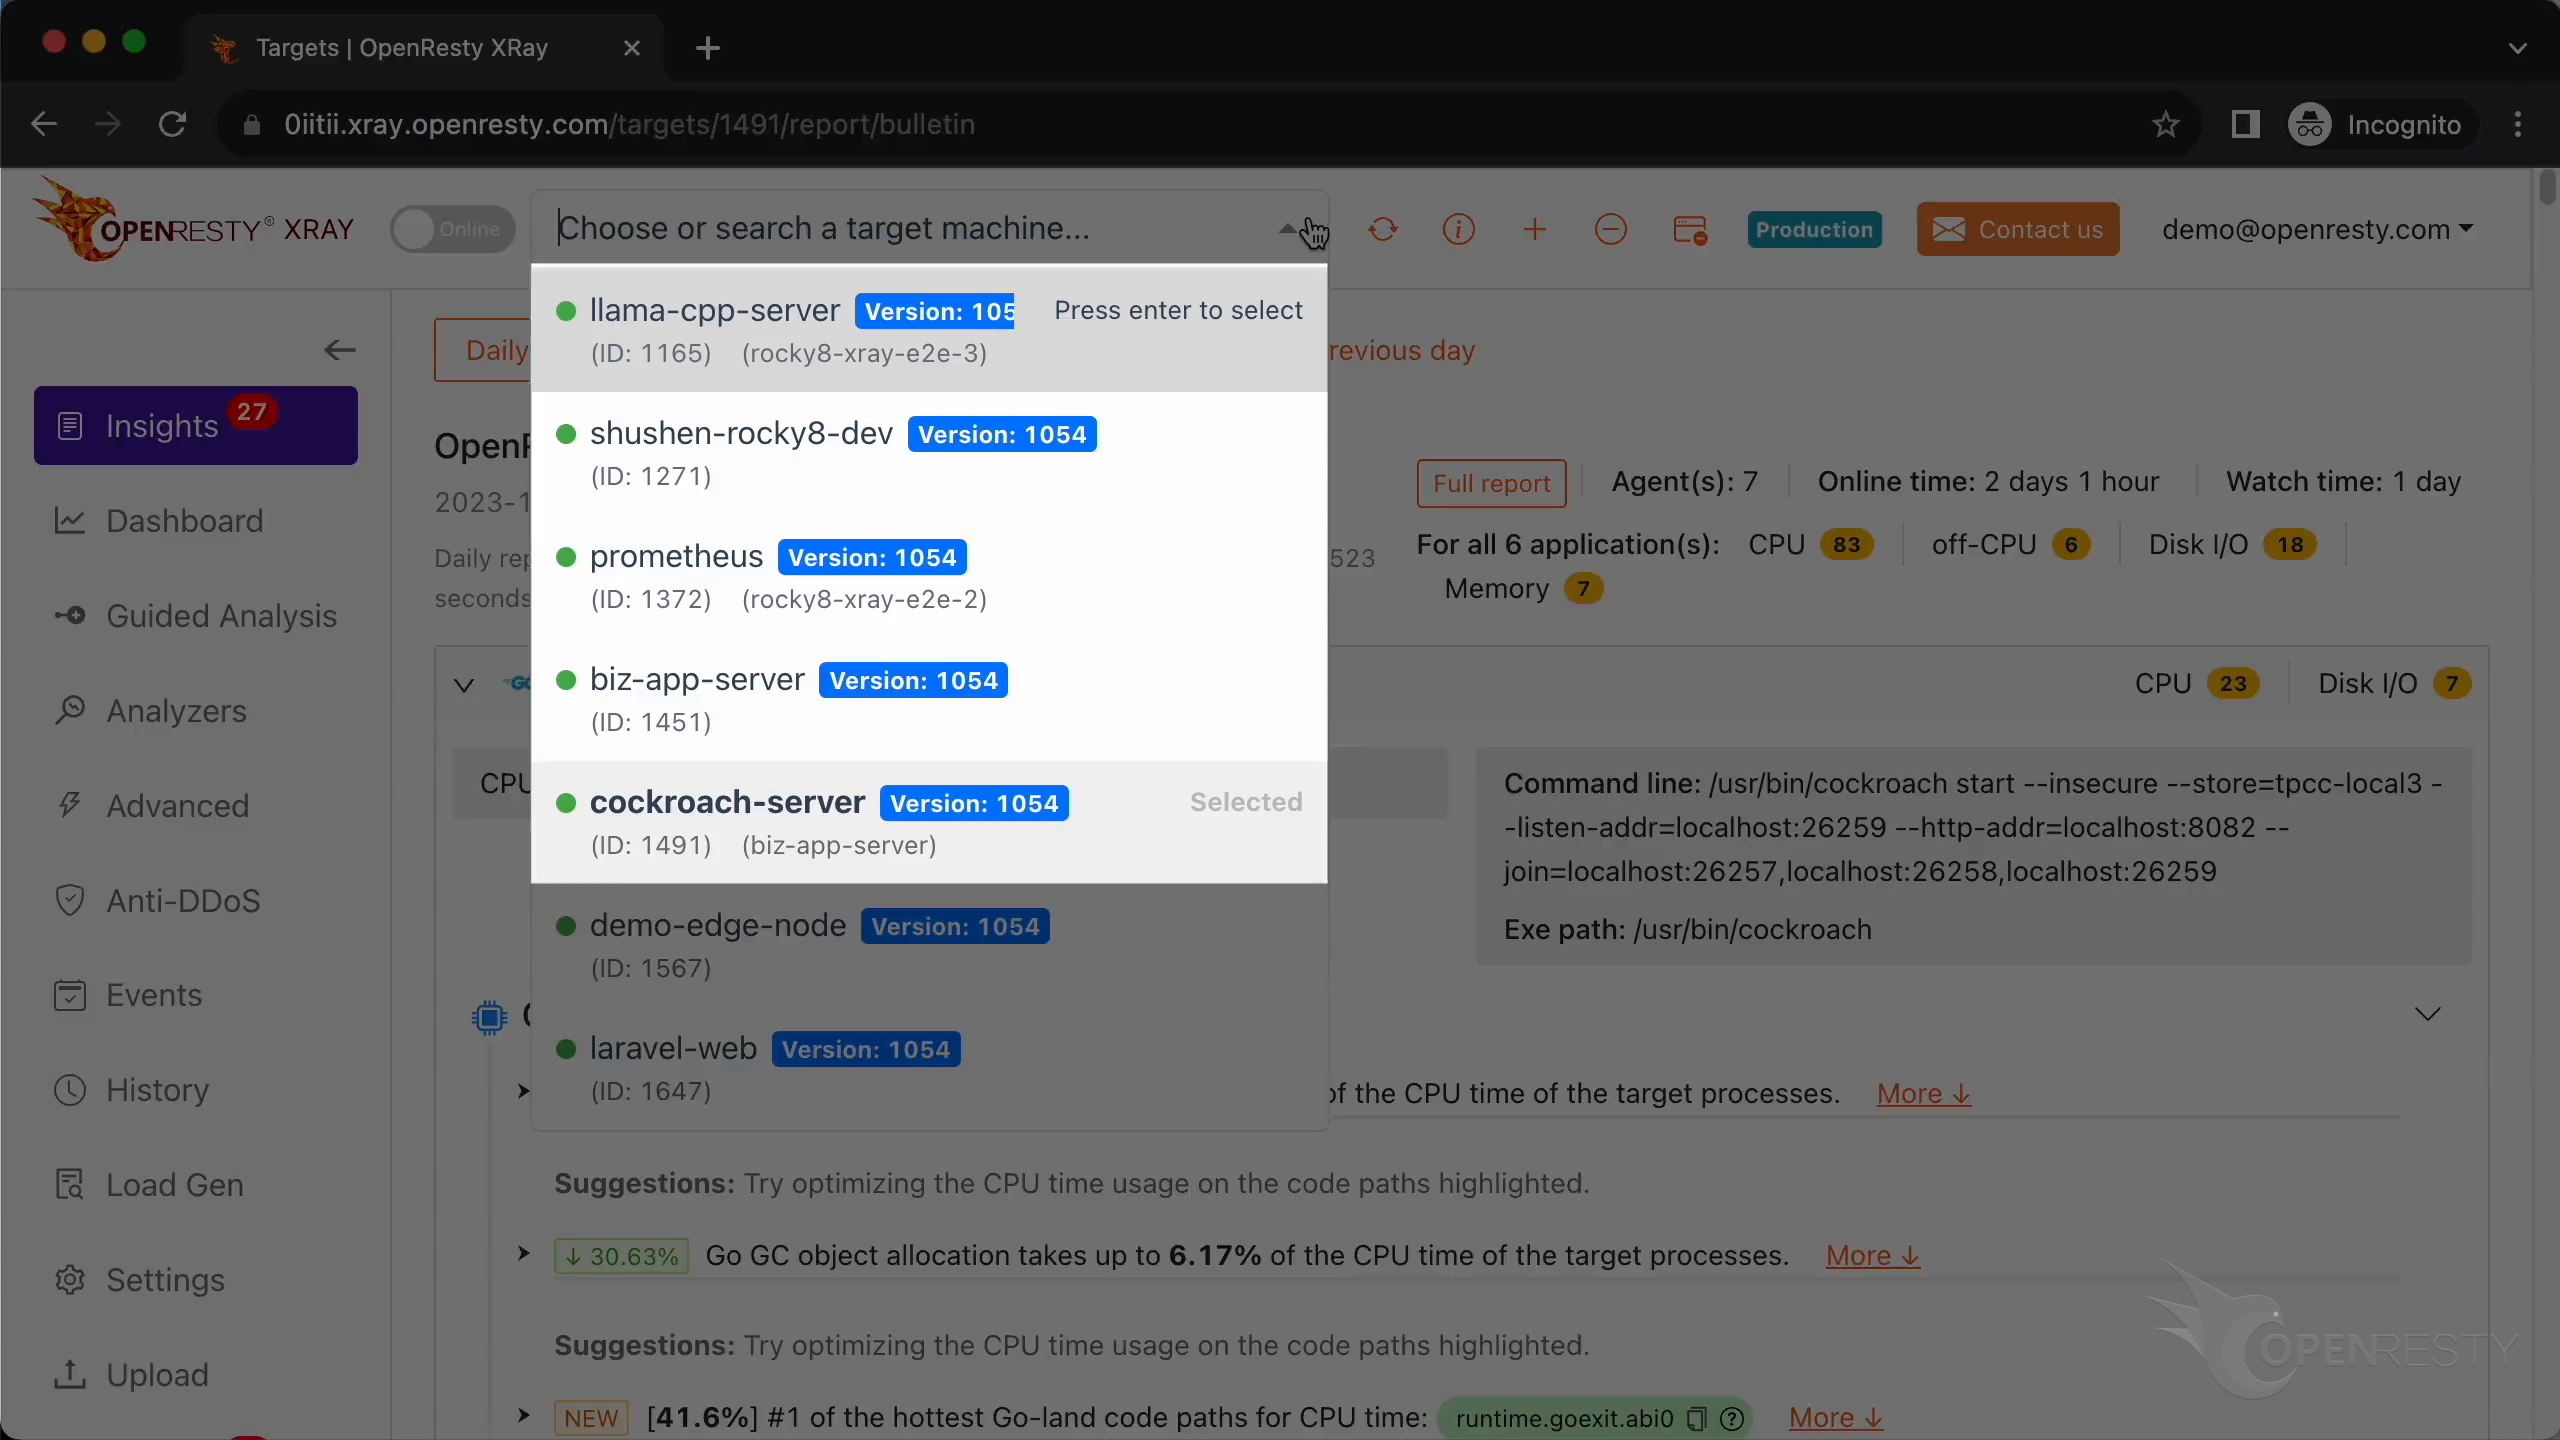
Make sure it is the right machine you are watching.
You can choose the right machine from the list below if the current one is not correct.
Go to the “Guided Analysis” page.
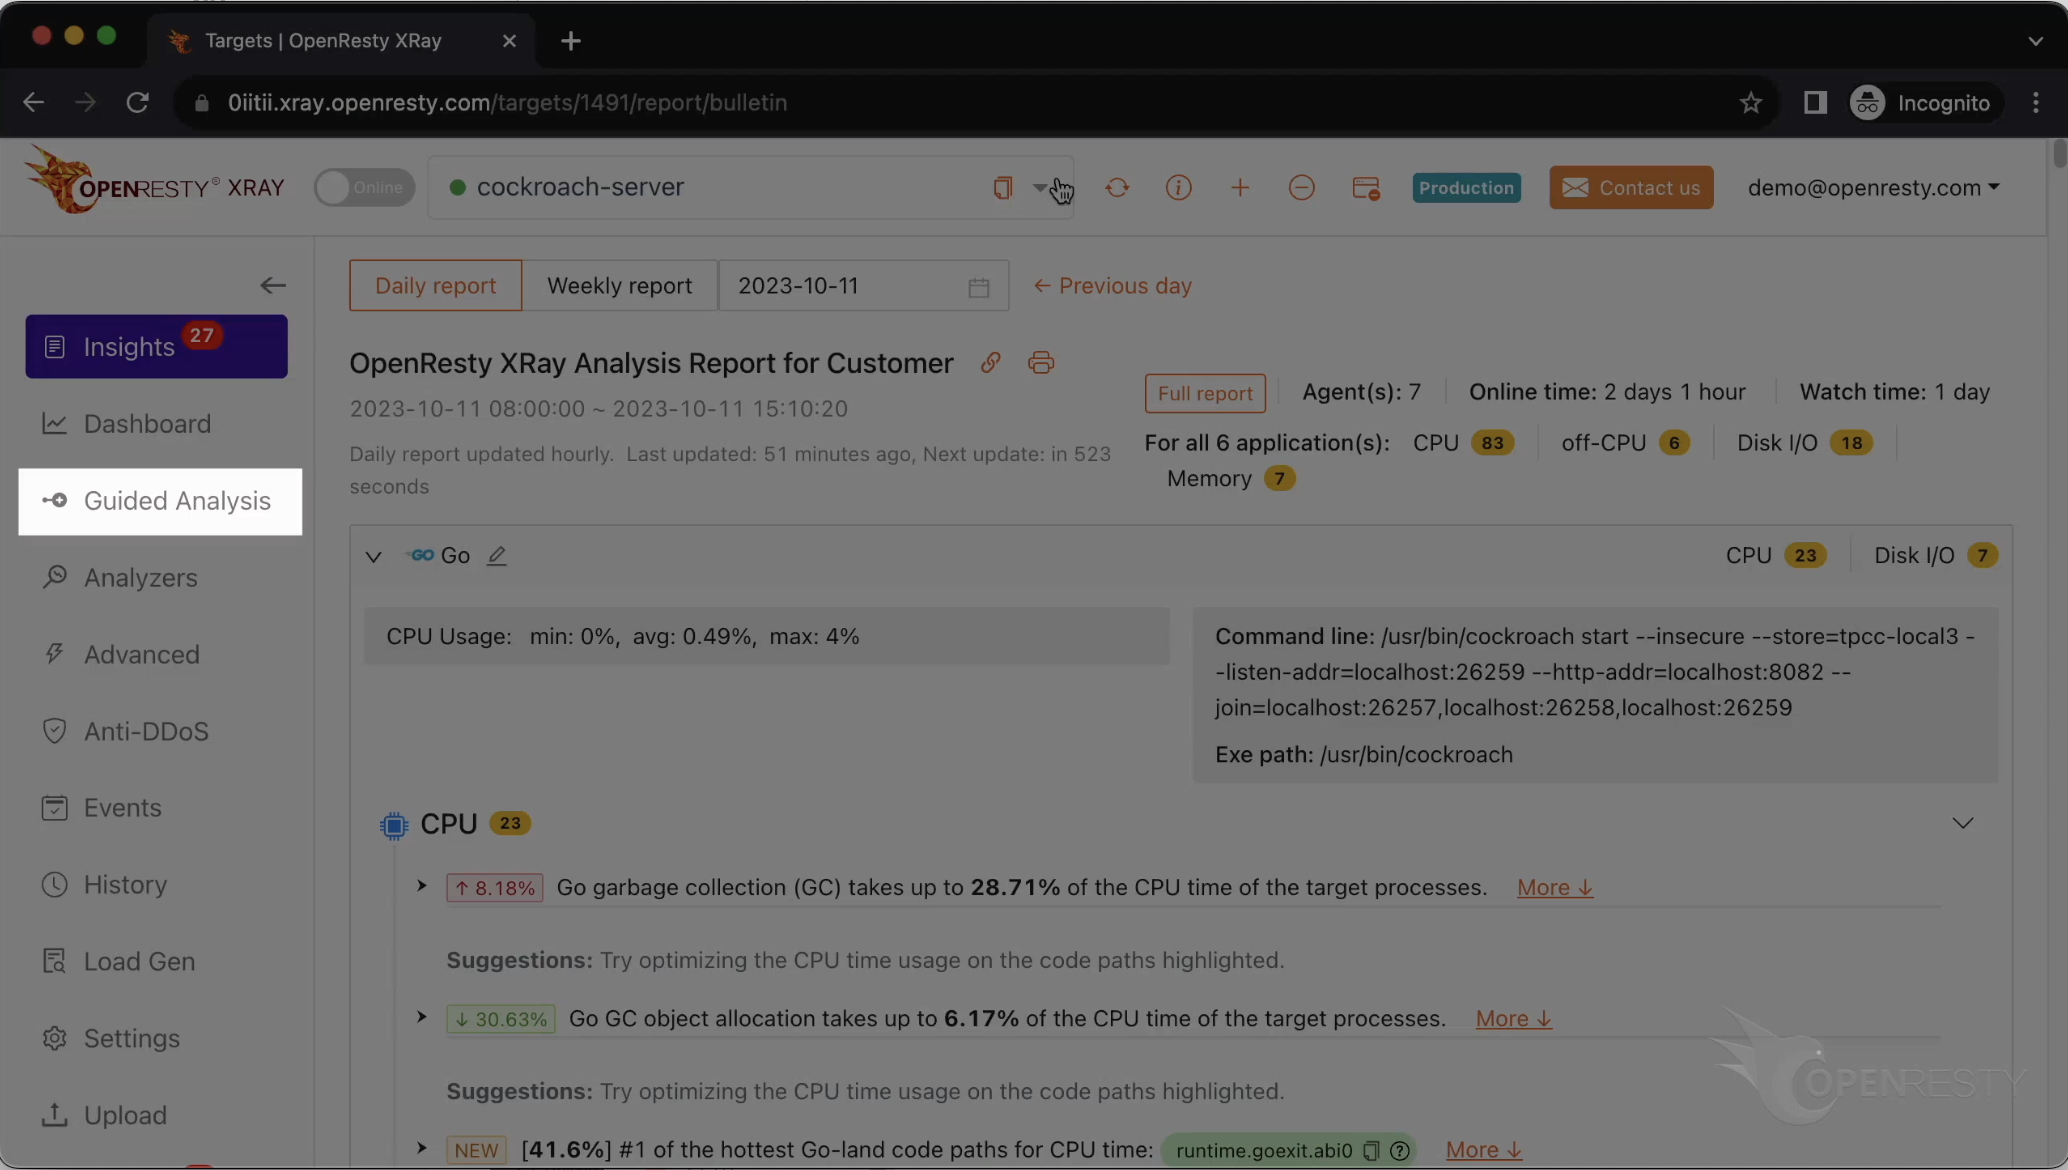
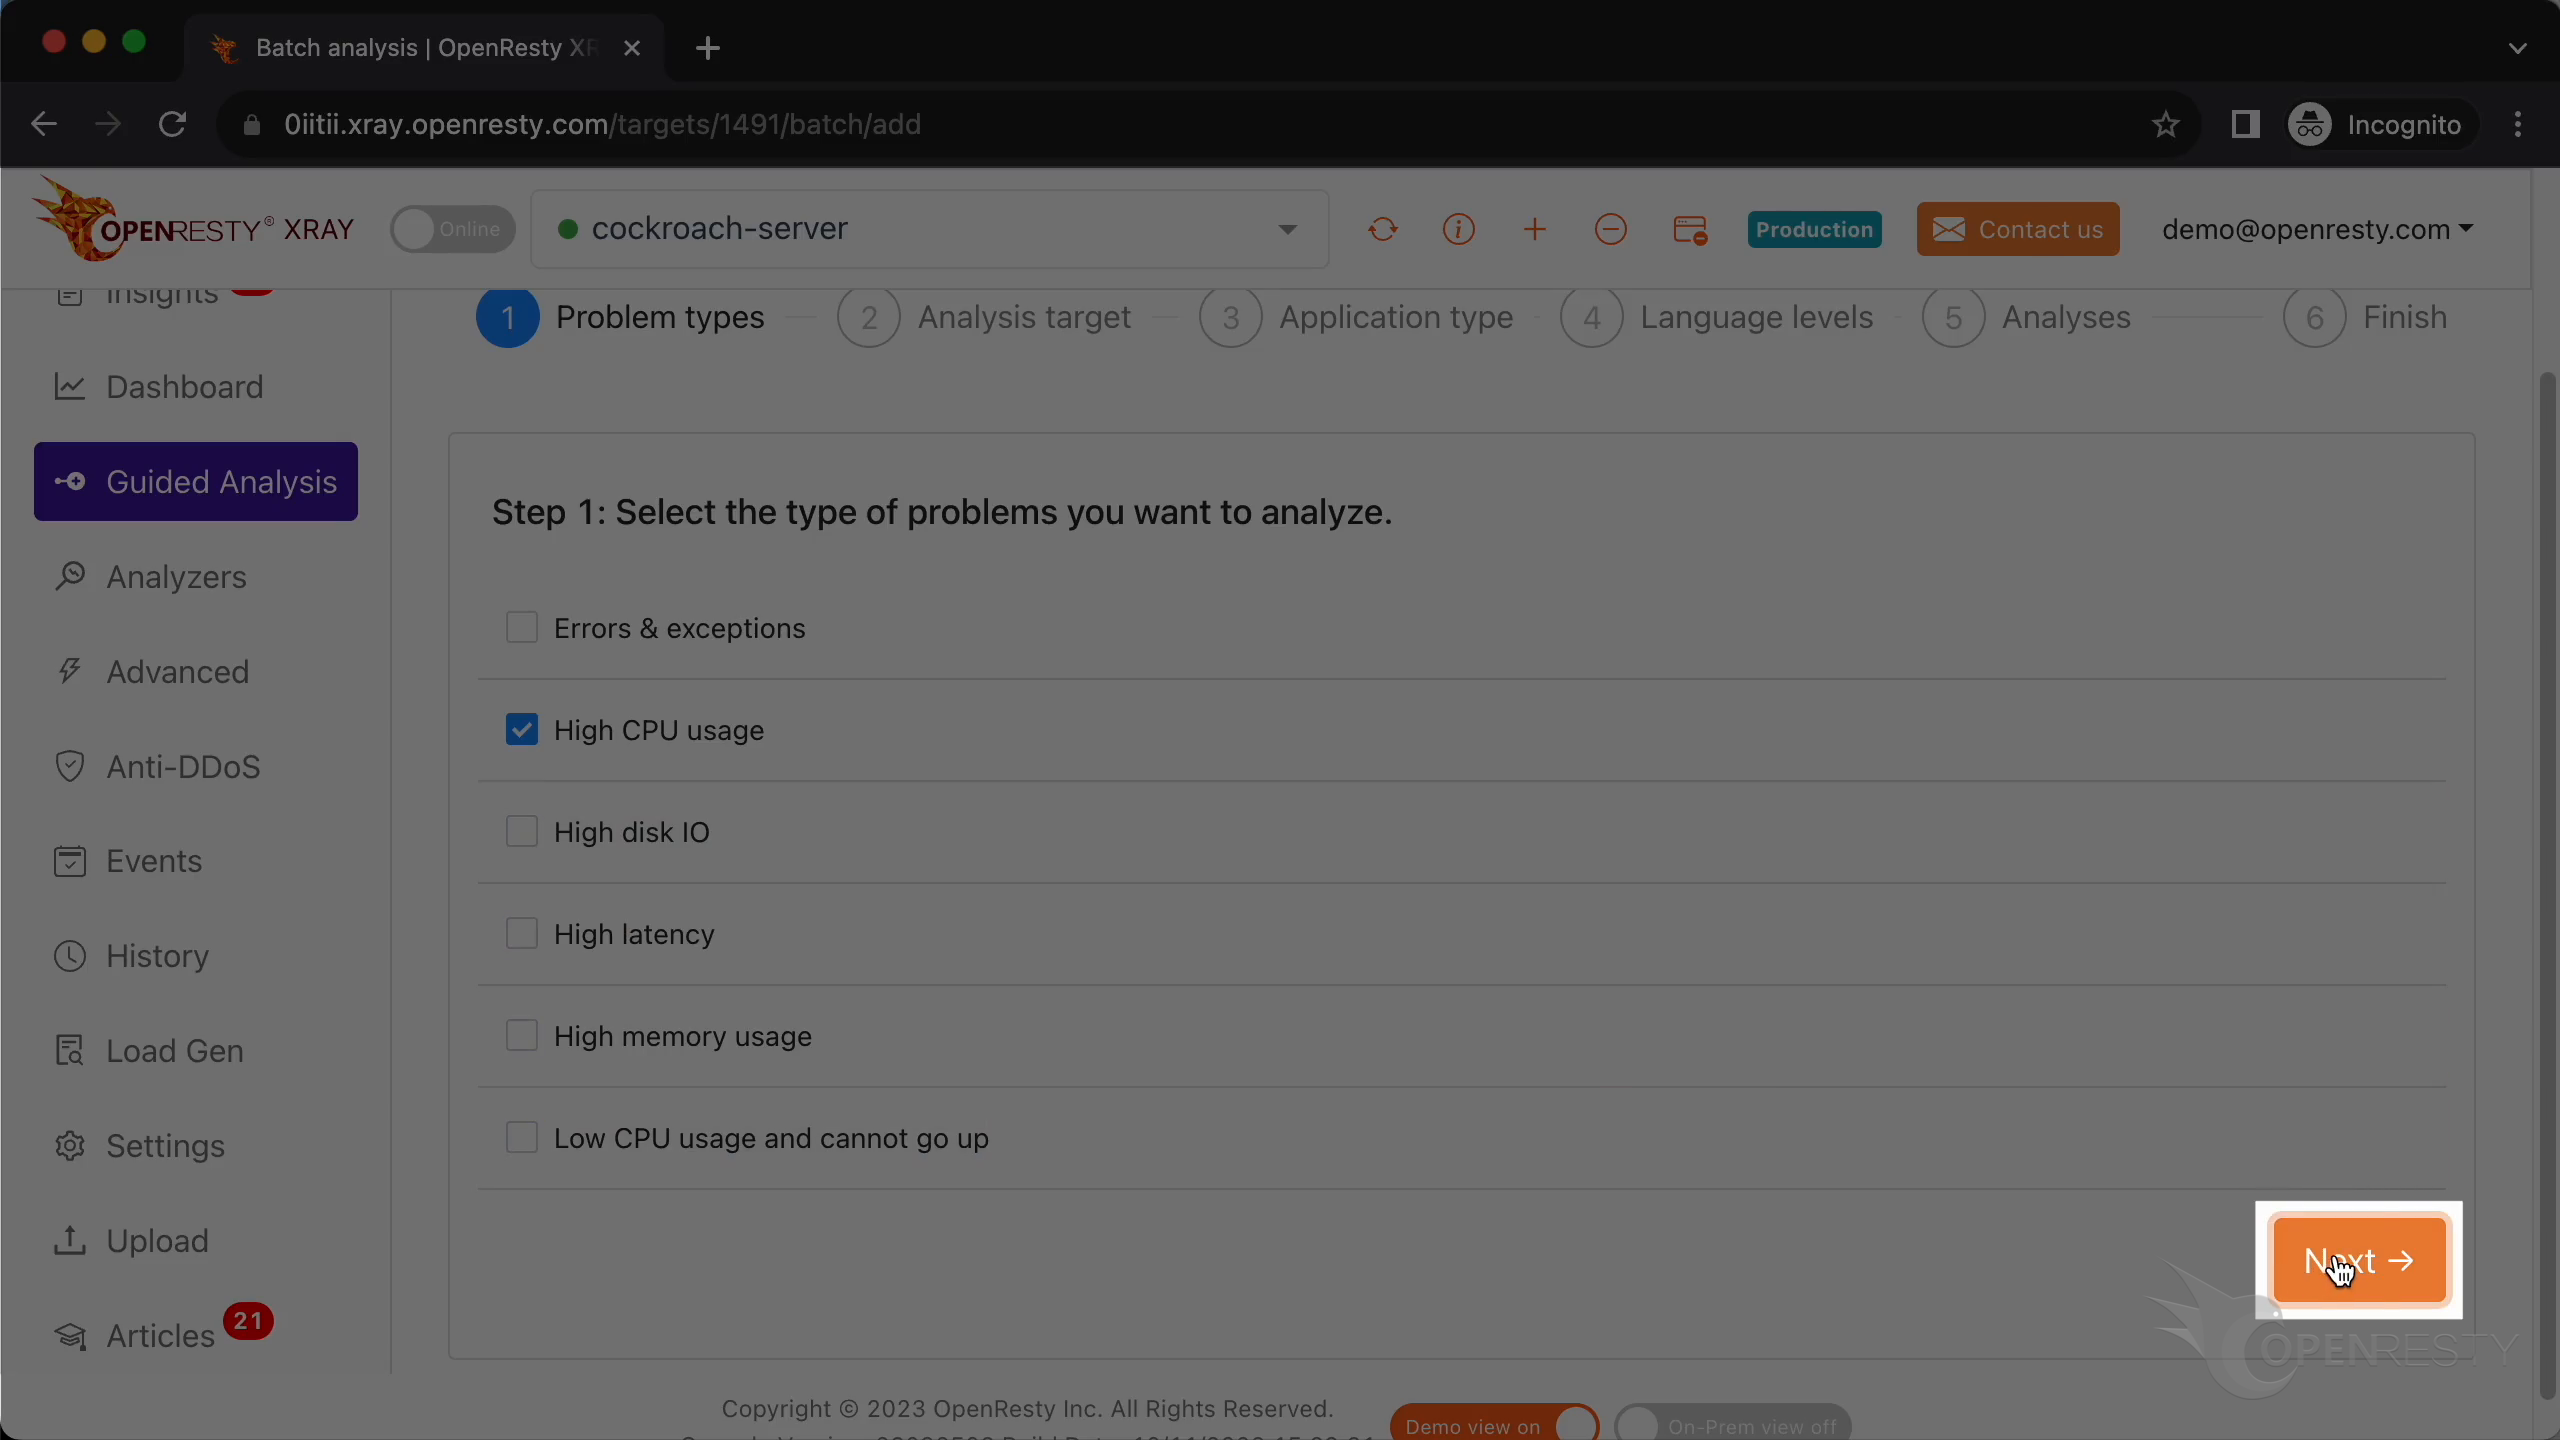
Here you can see different types of problems that you can diagnose.
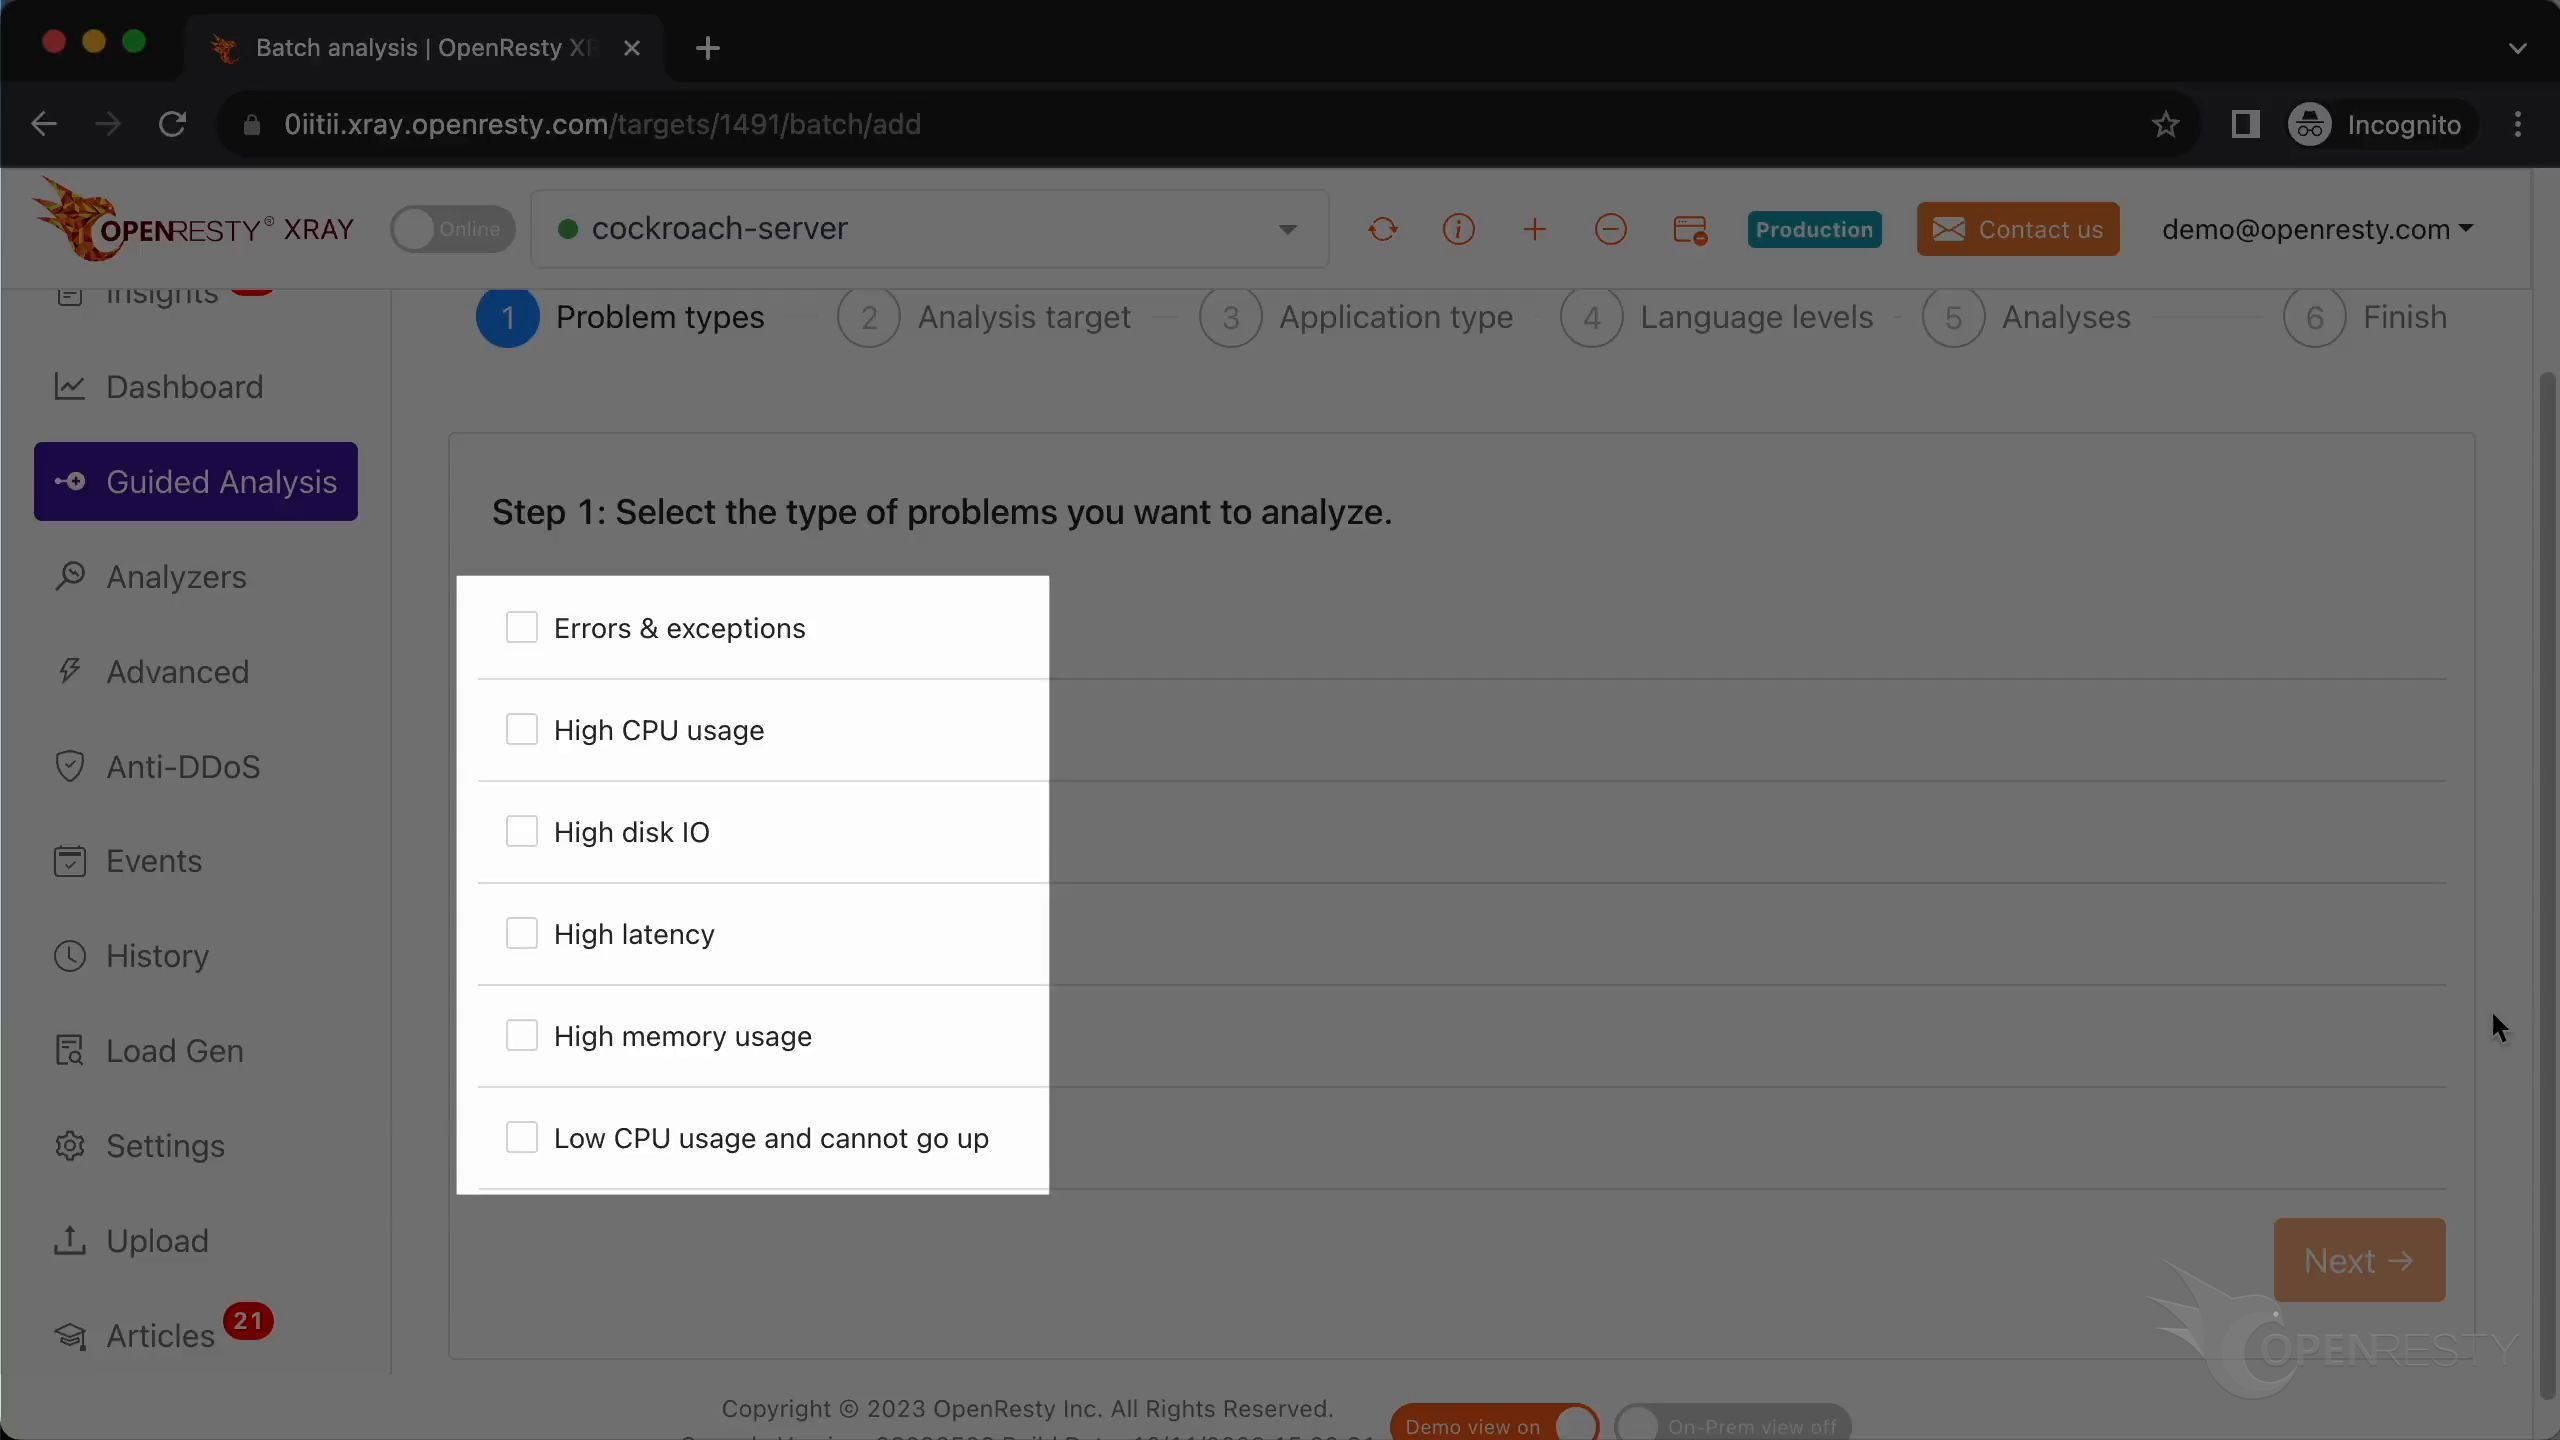
Let’s select “High CPU Usage”.
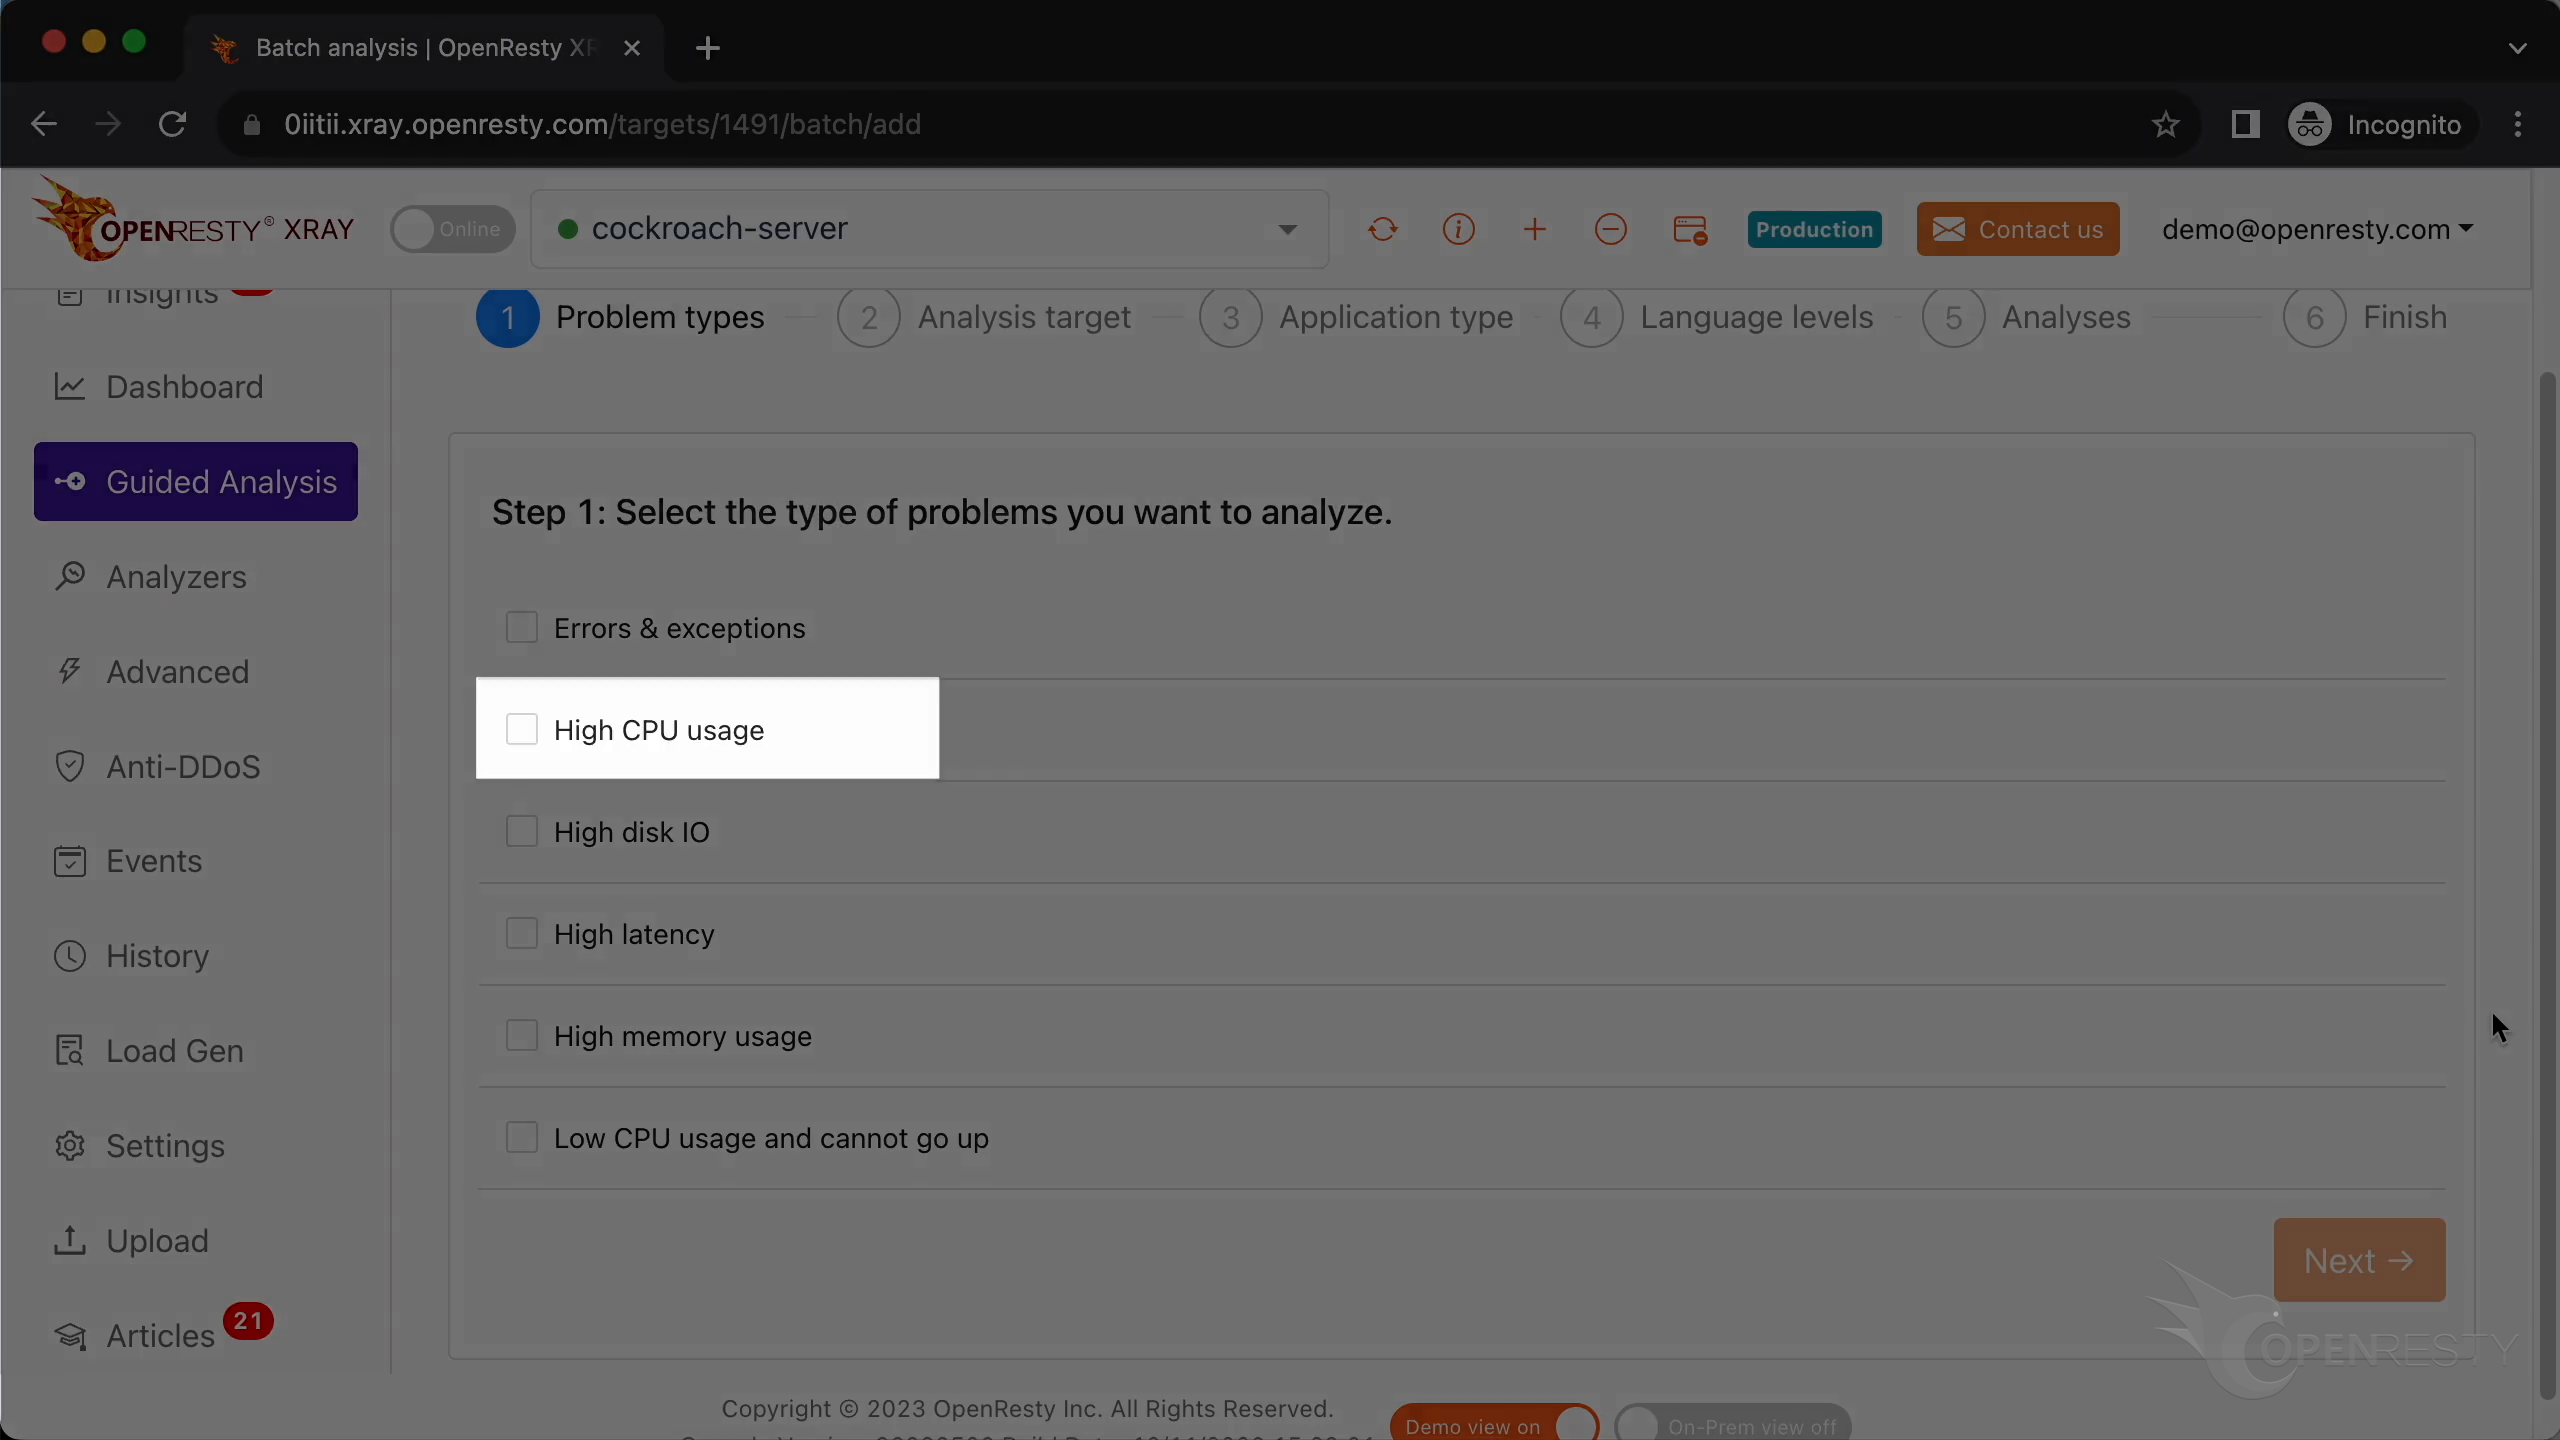
Click on “Next”.
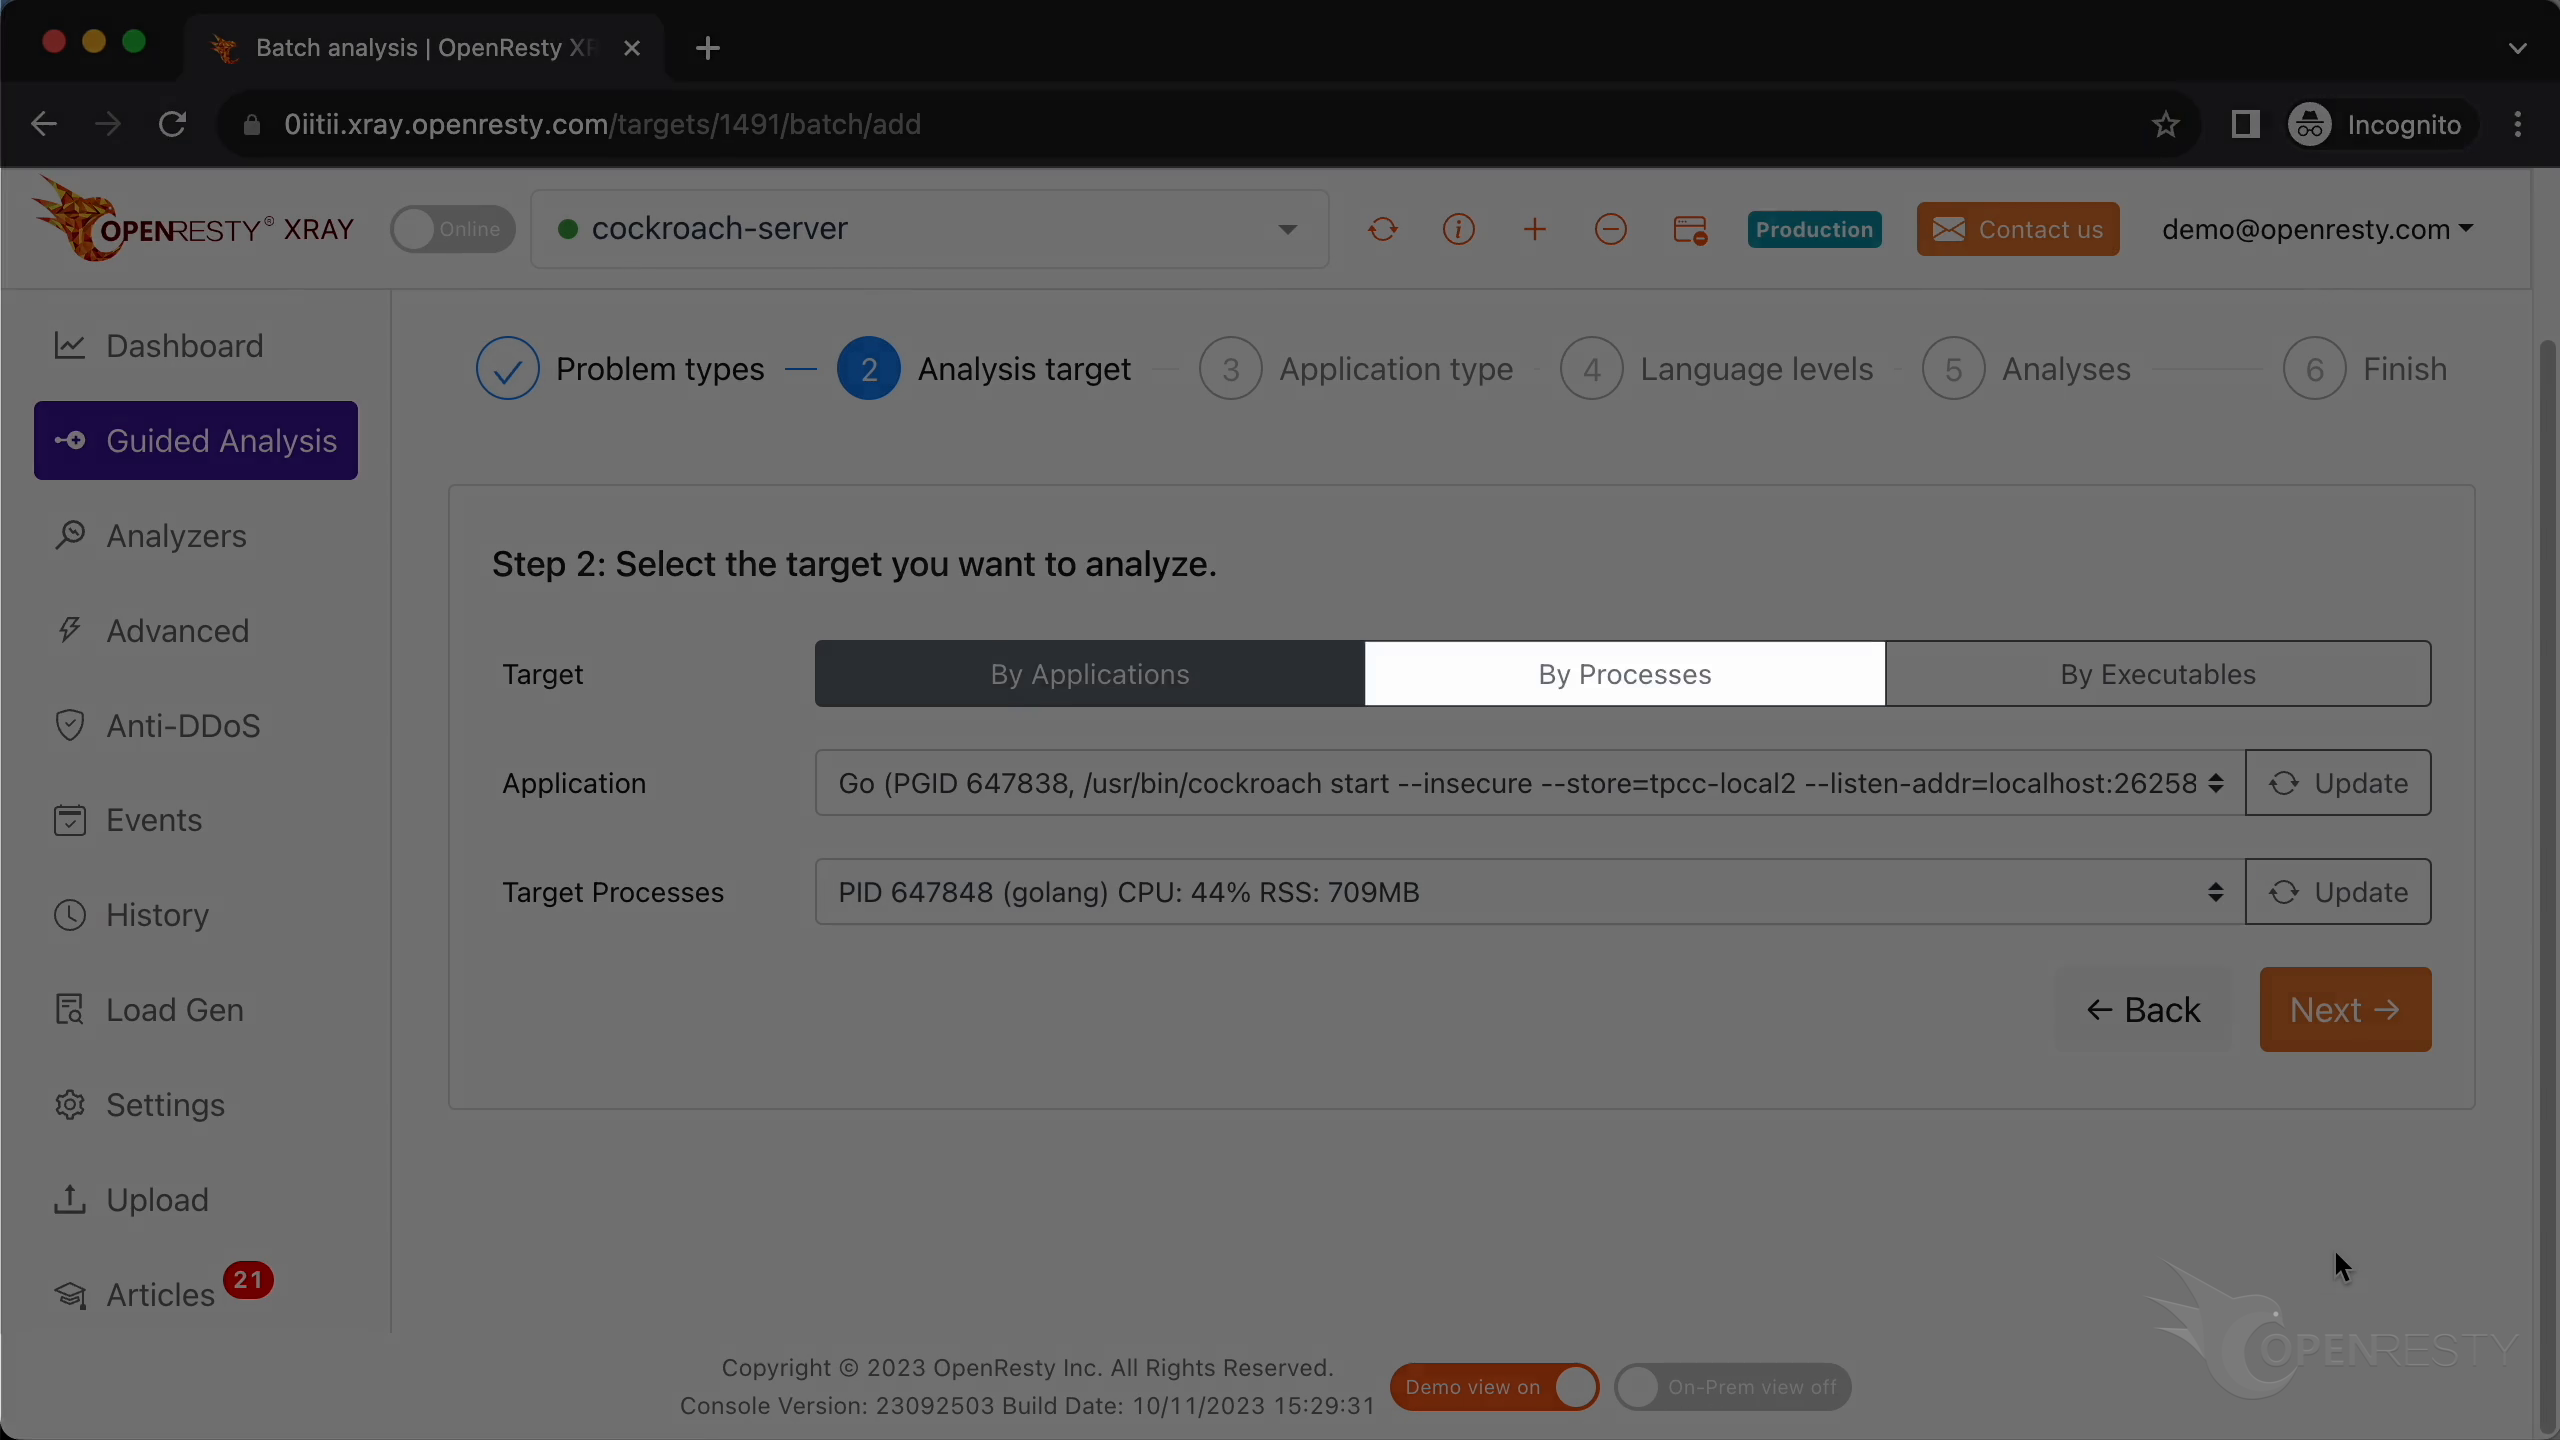
Click on “By Processes”.
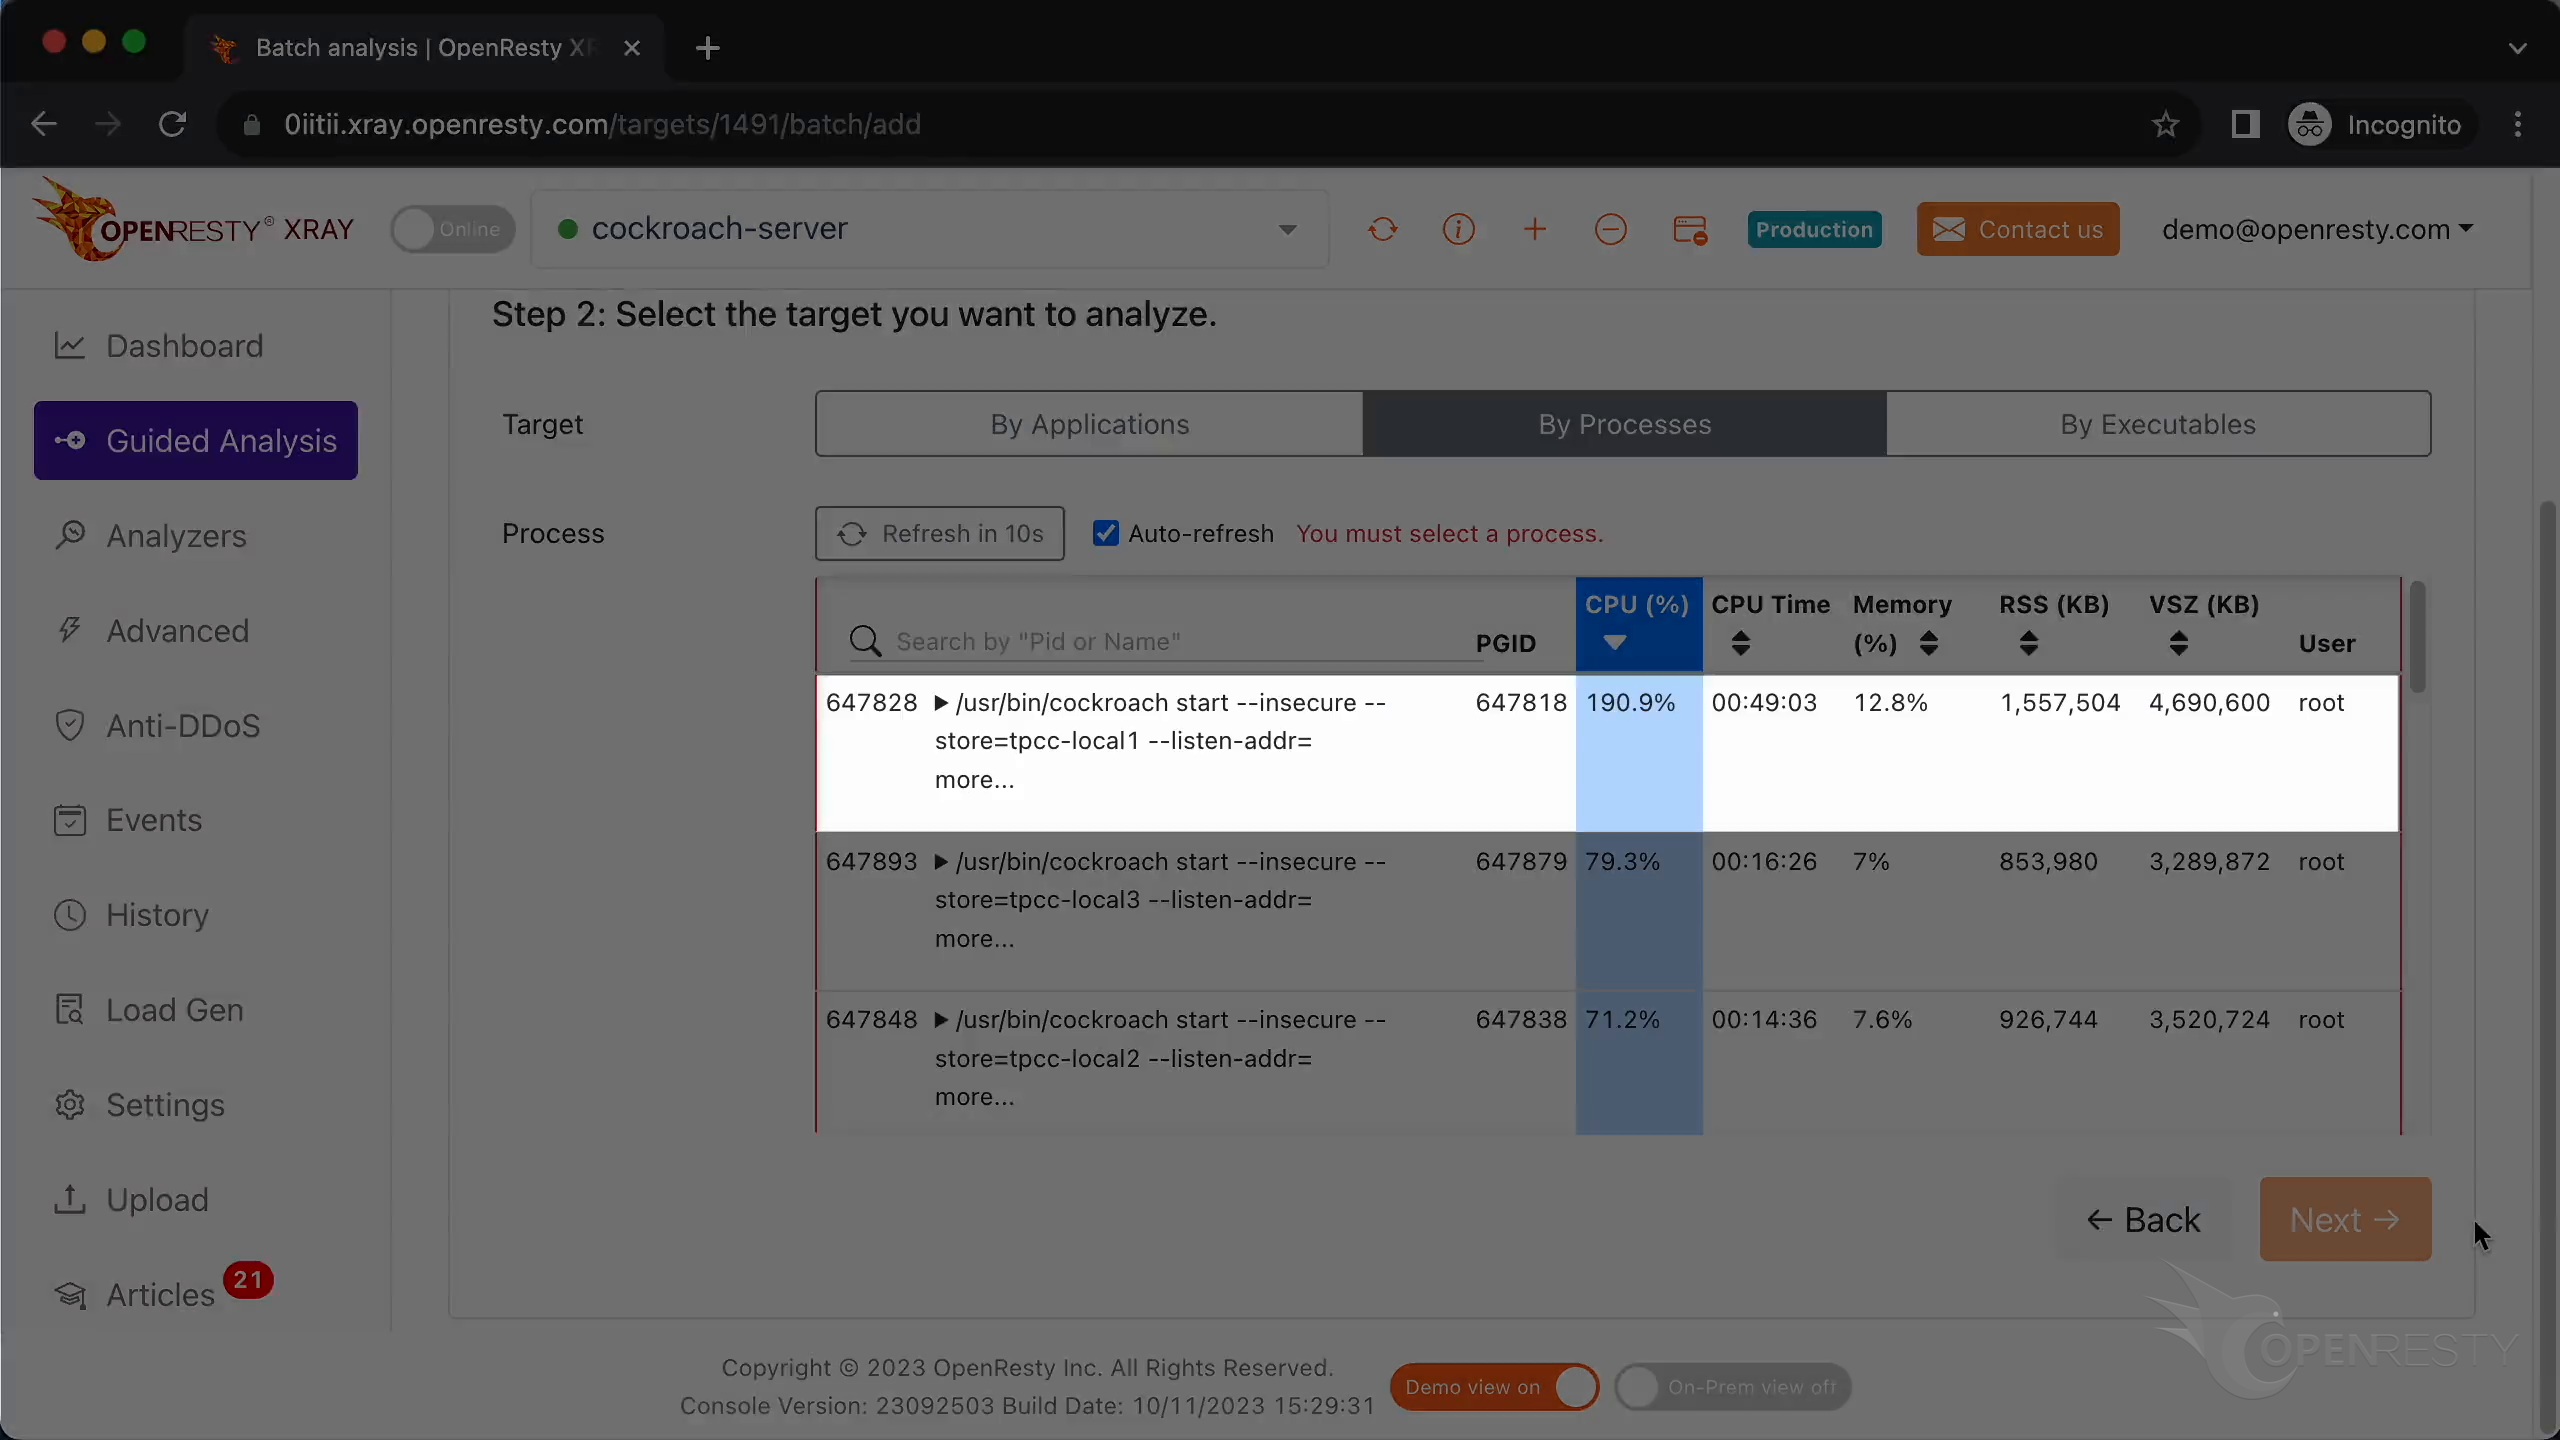
Select the process that consumes almost 200% of CPU cores. This is what we saw previously in top.
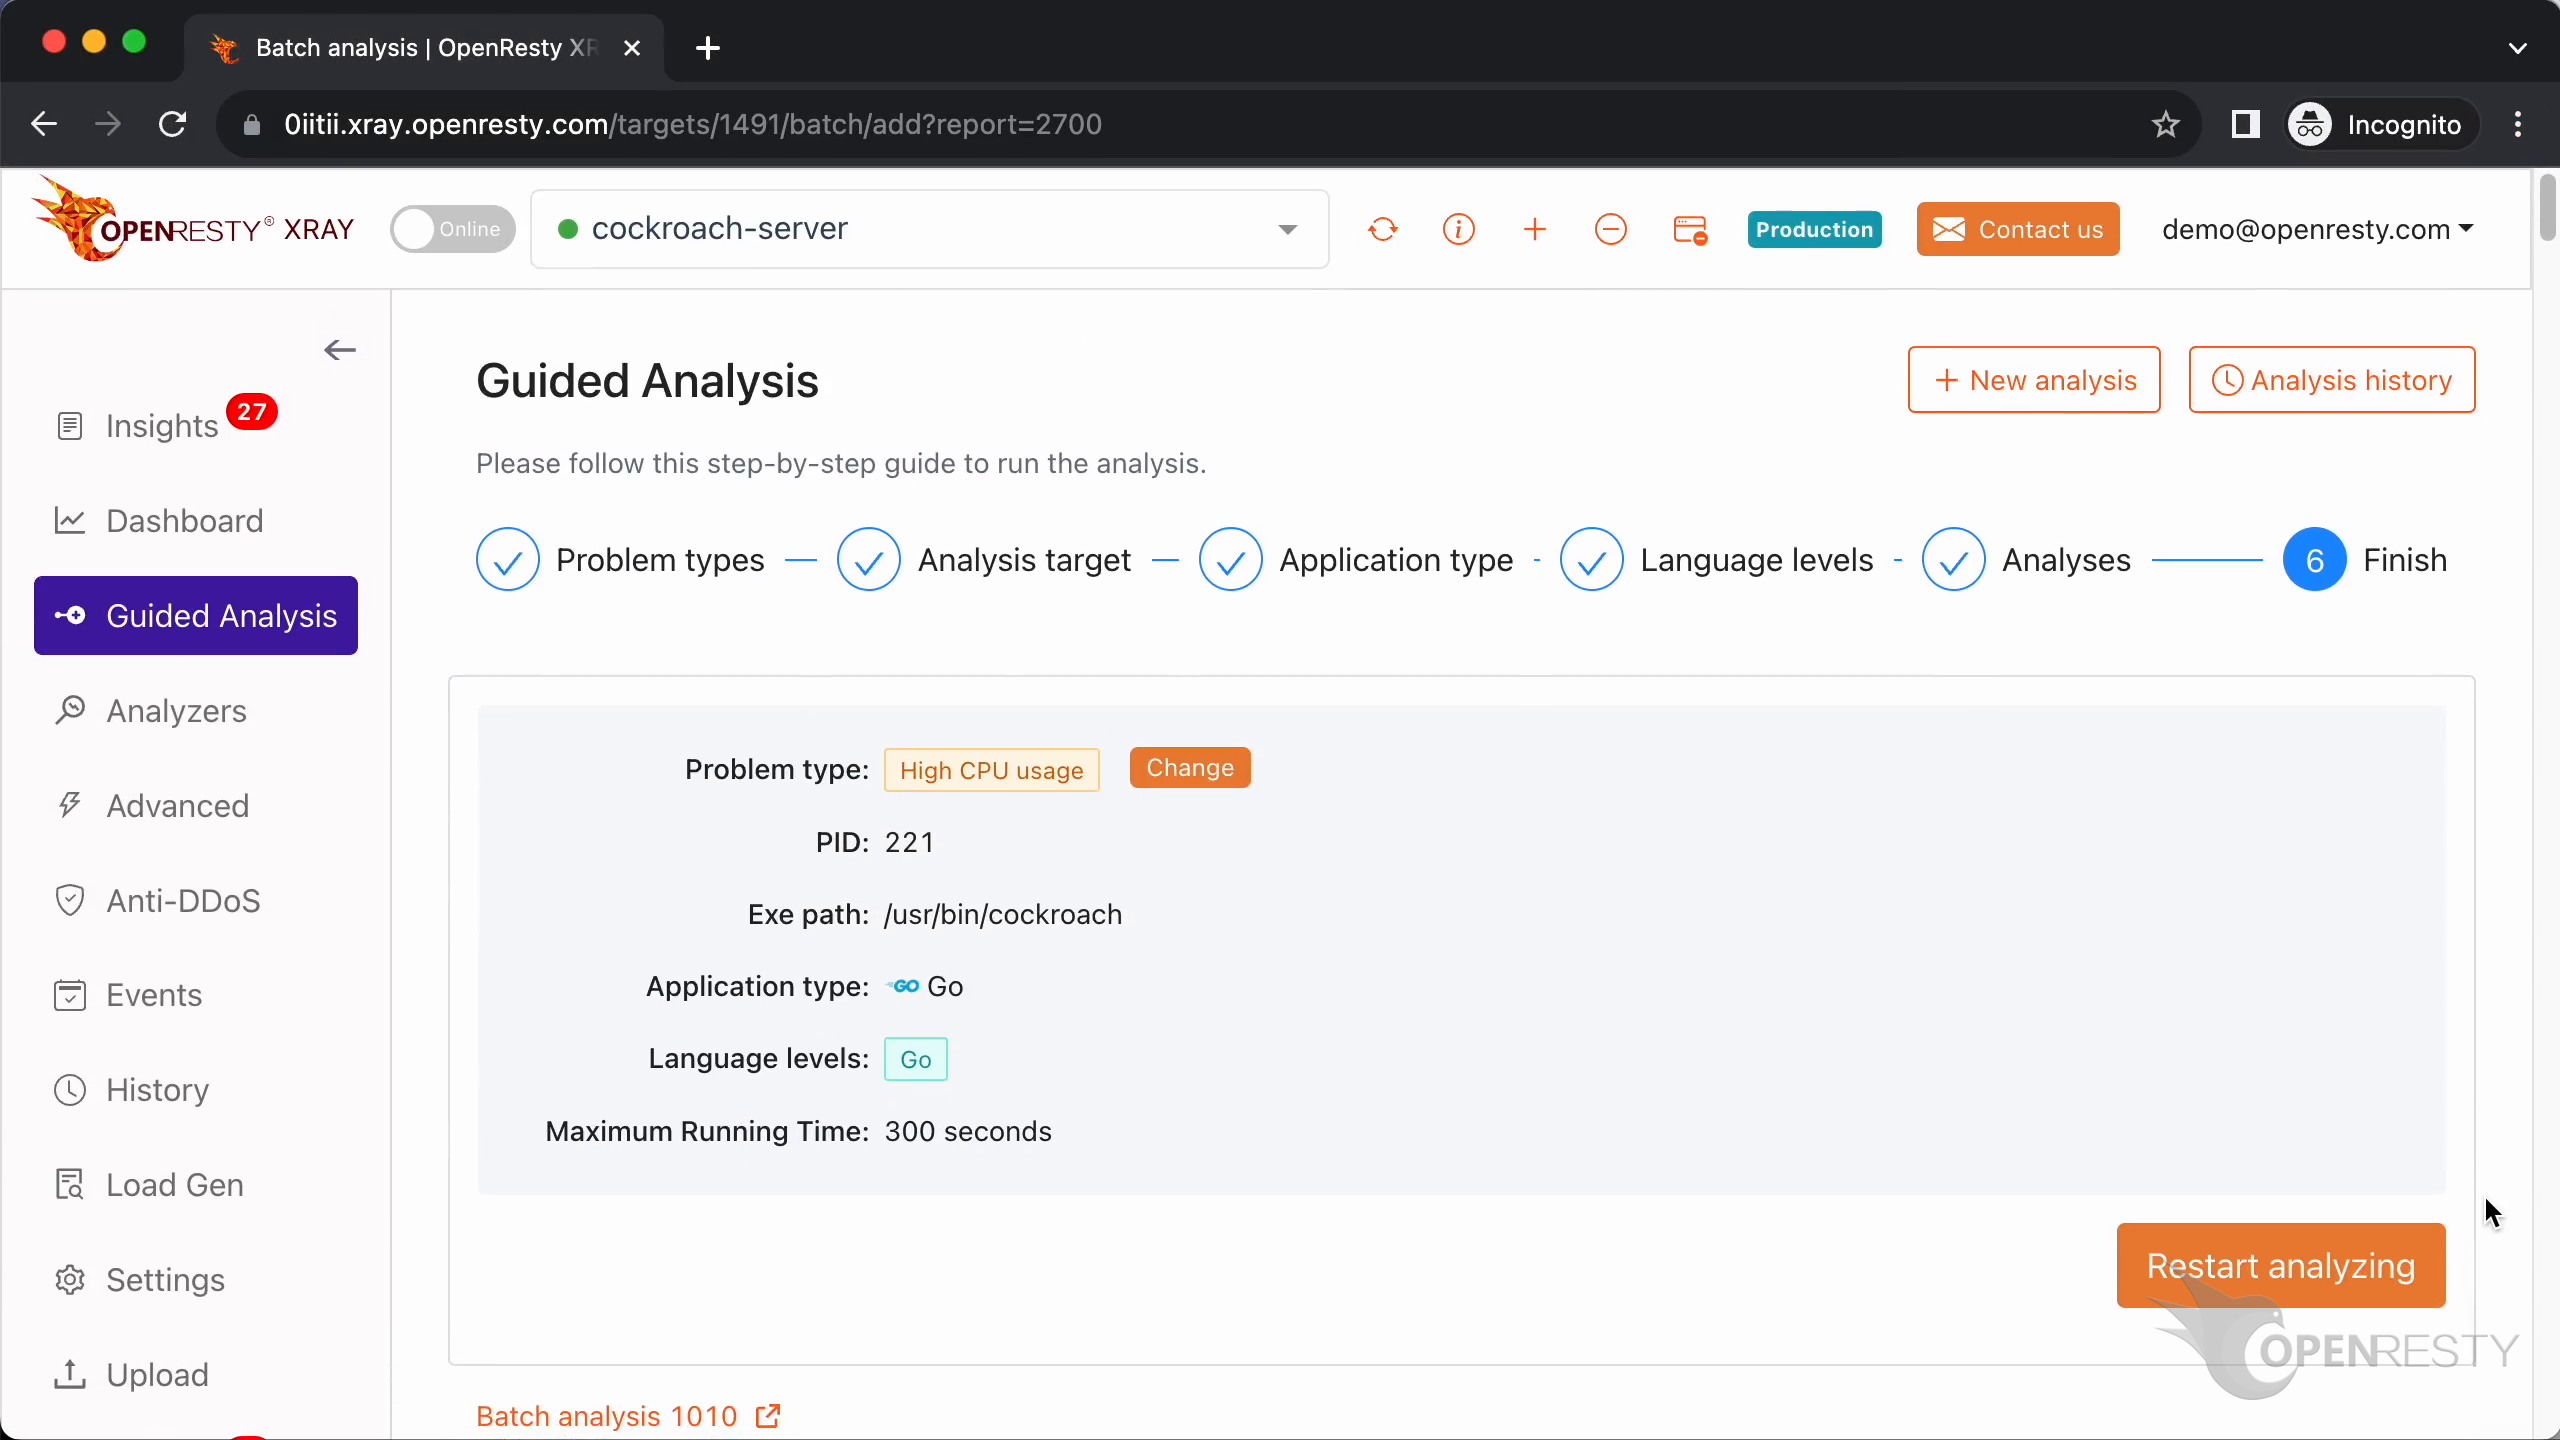
Make sure that the application type is right. Usually, the default should be correct.
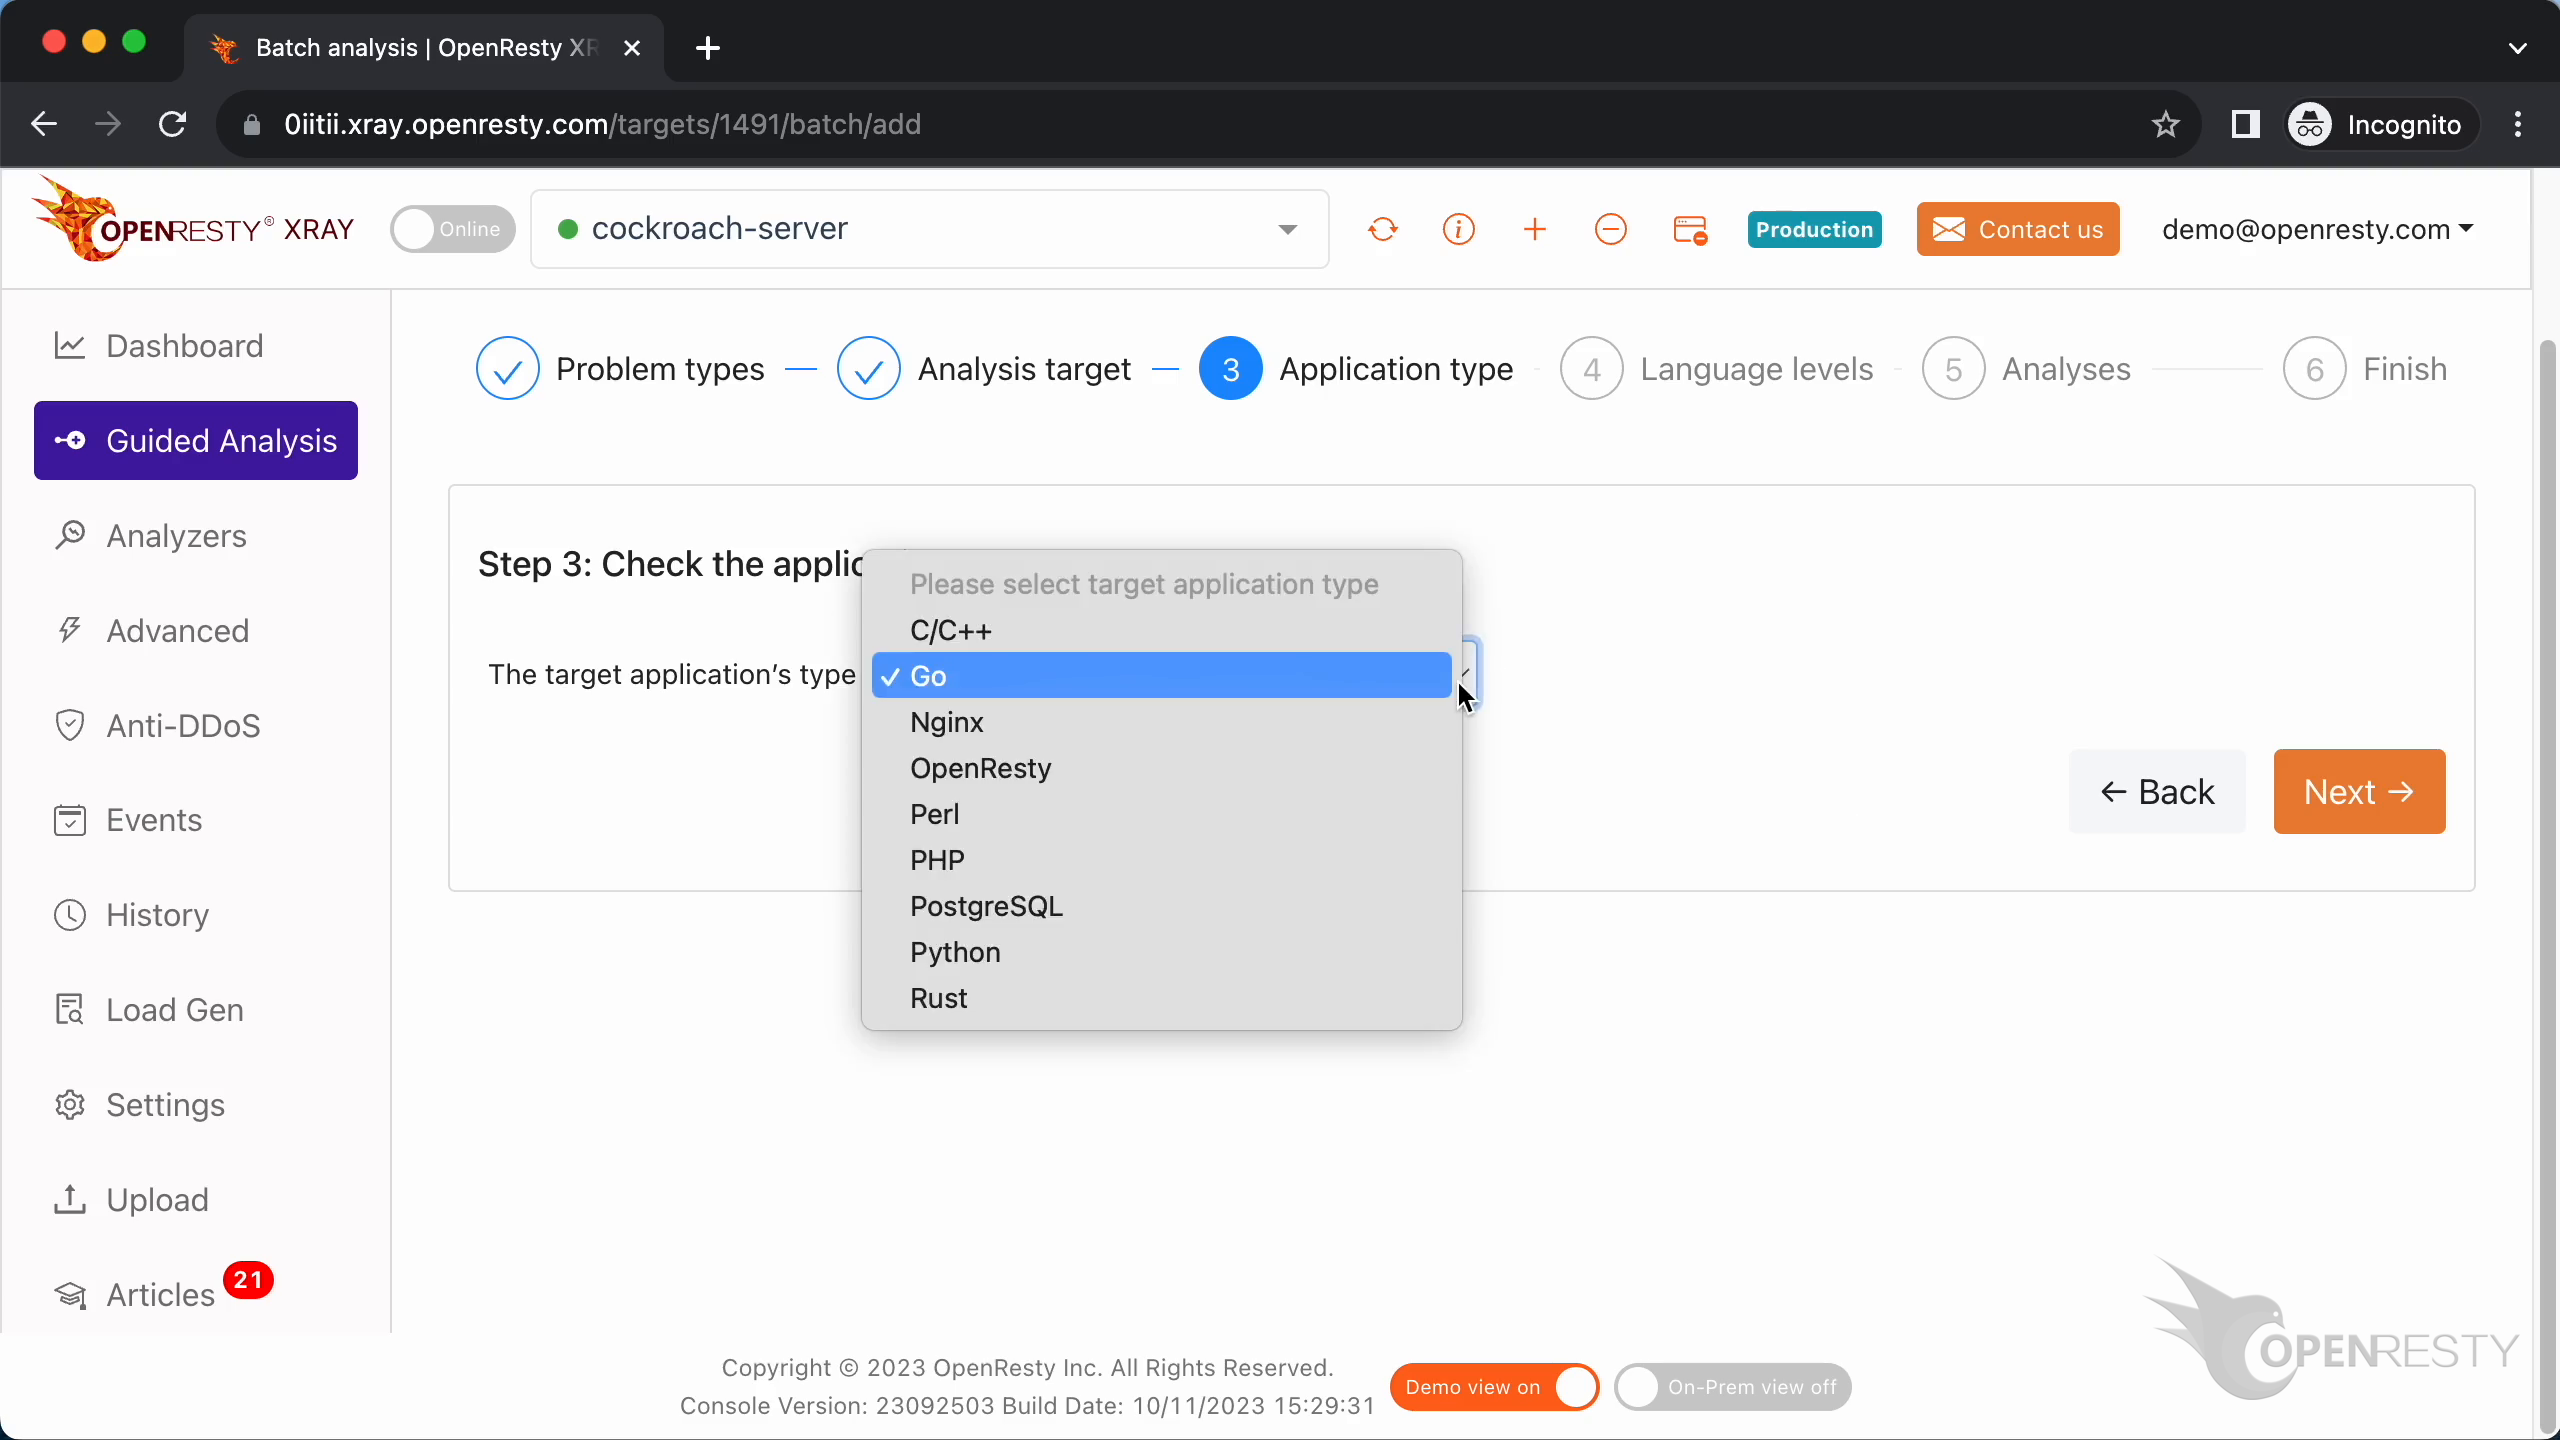
The language level here is just “Go”.
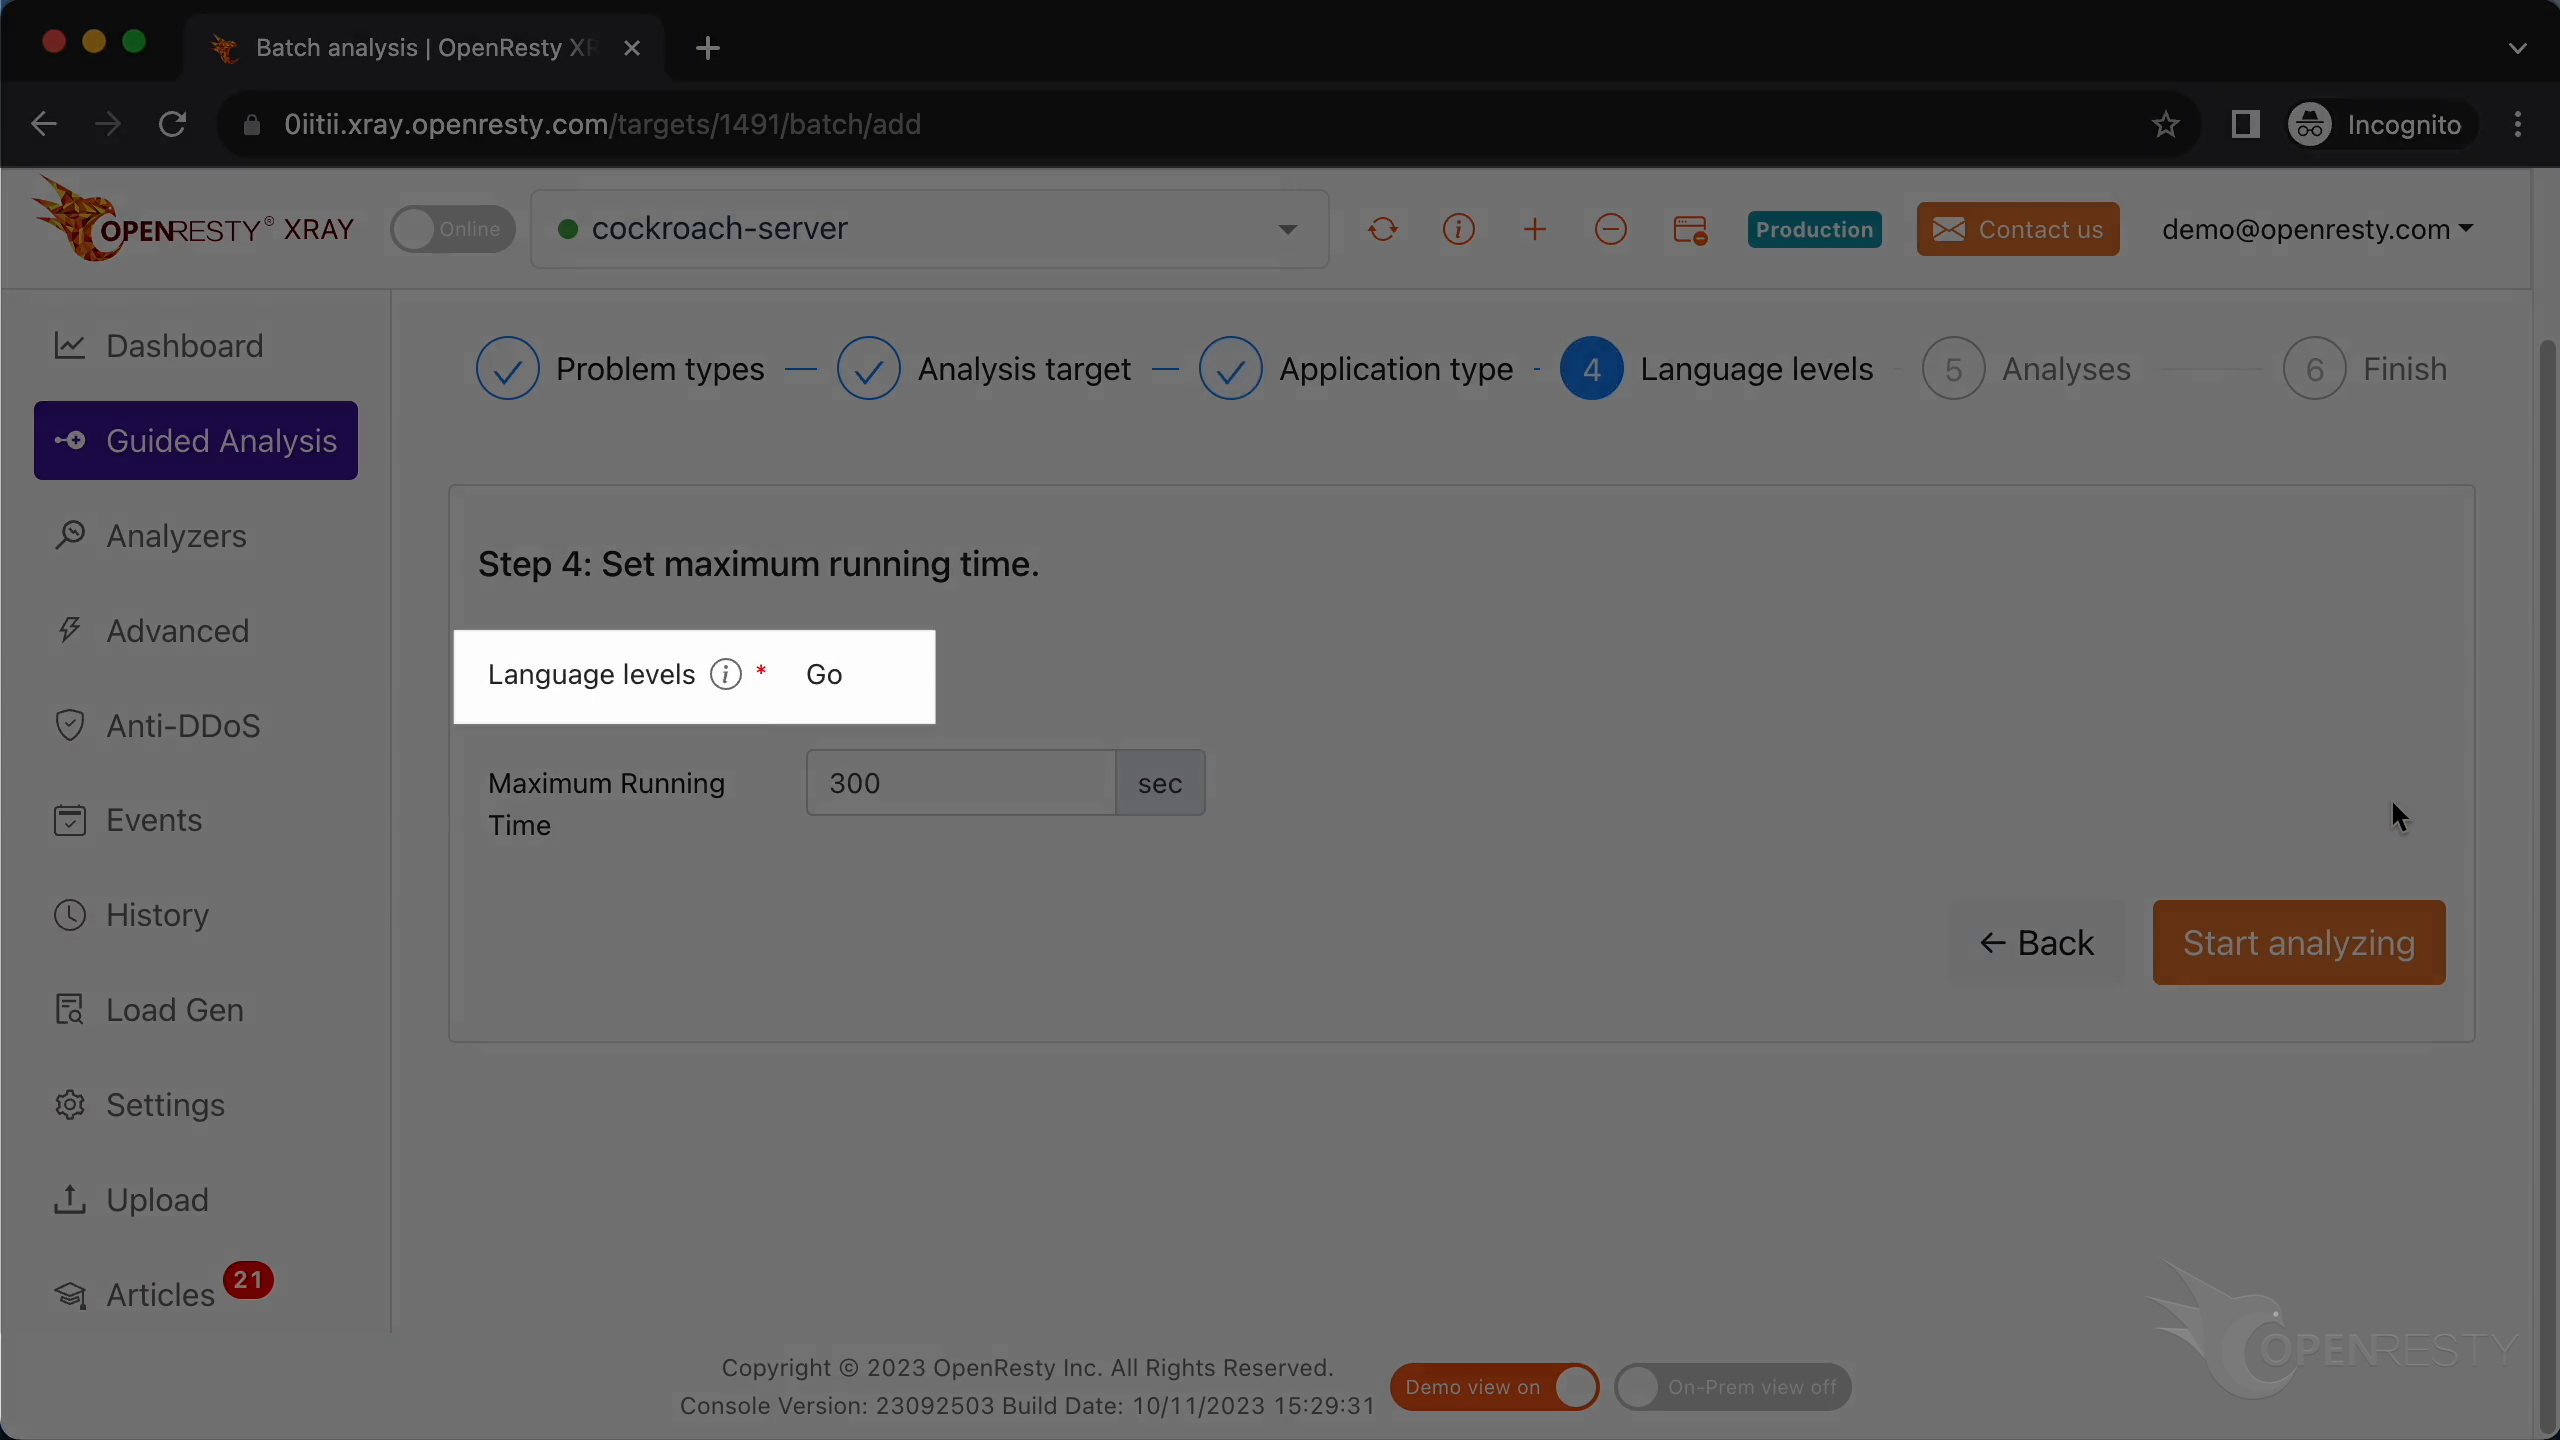
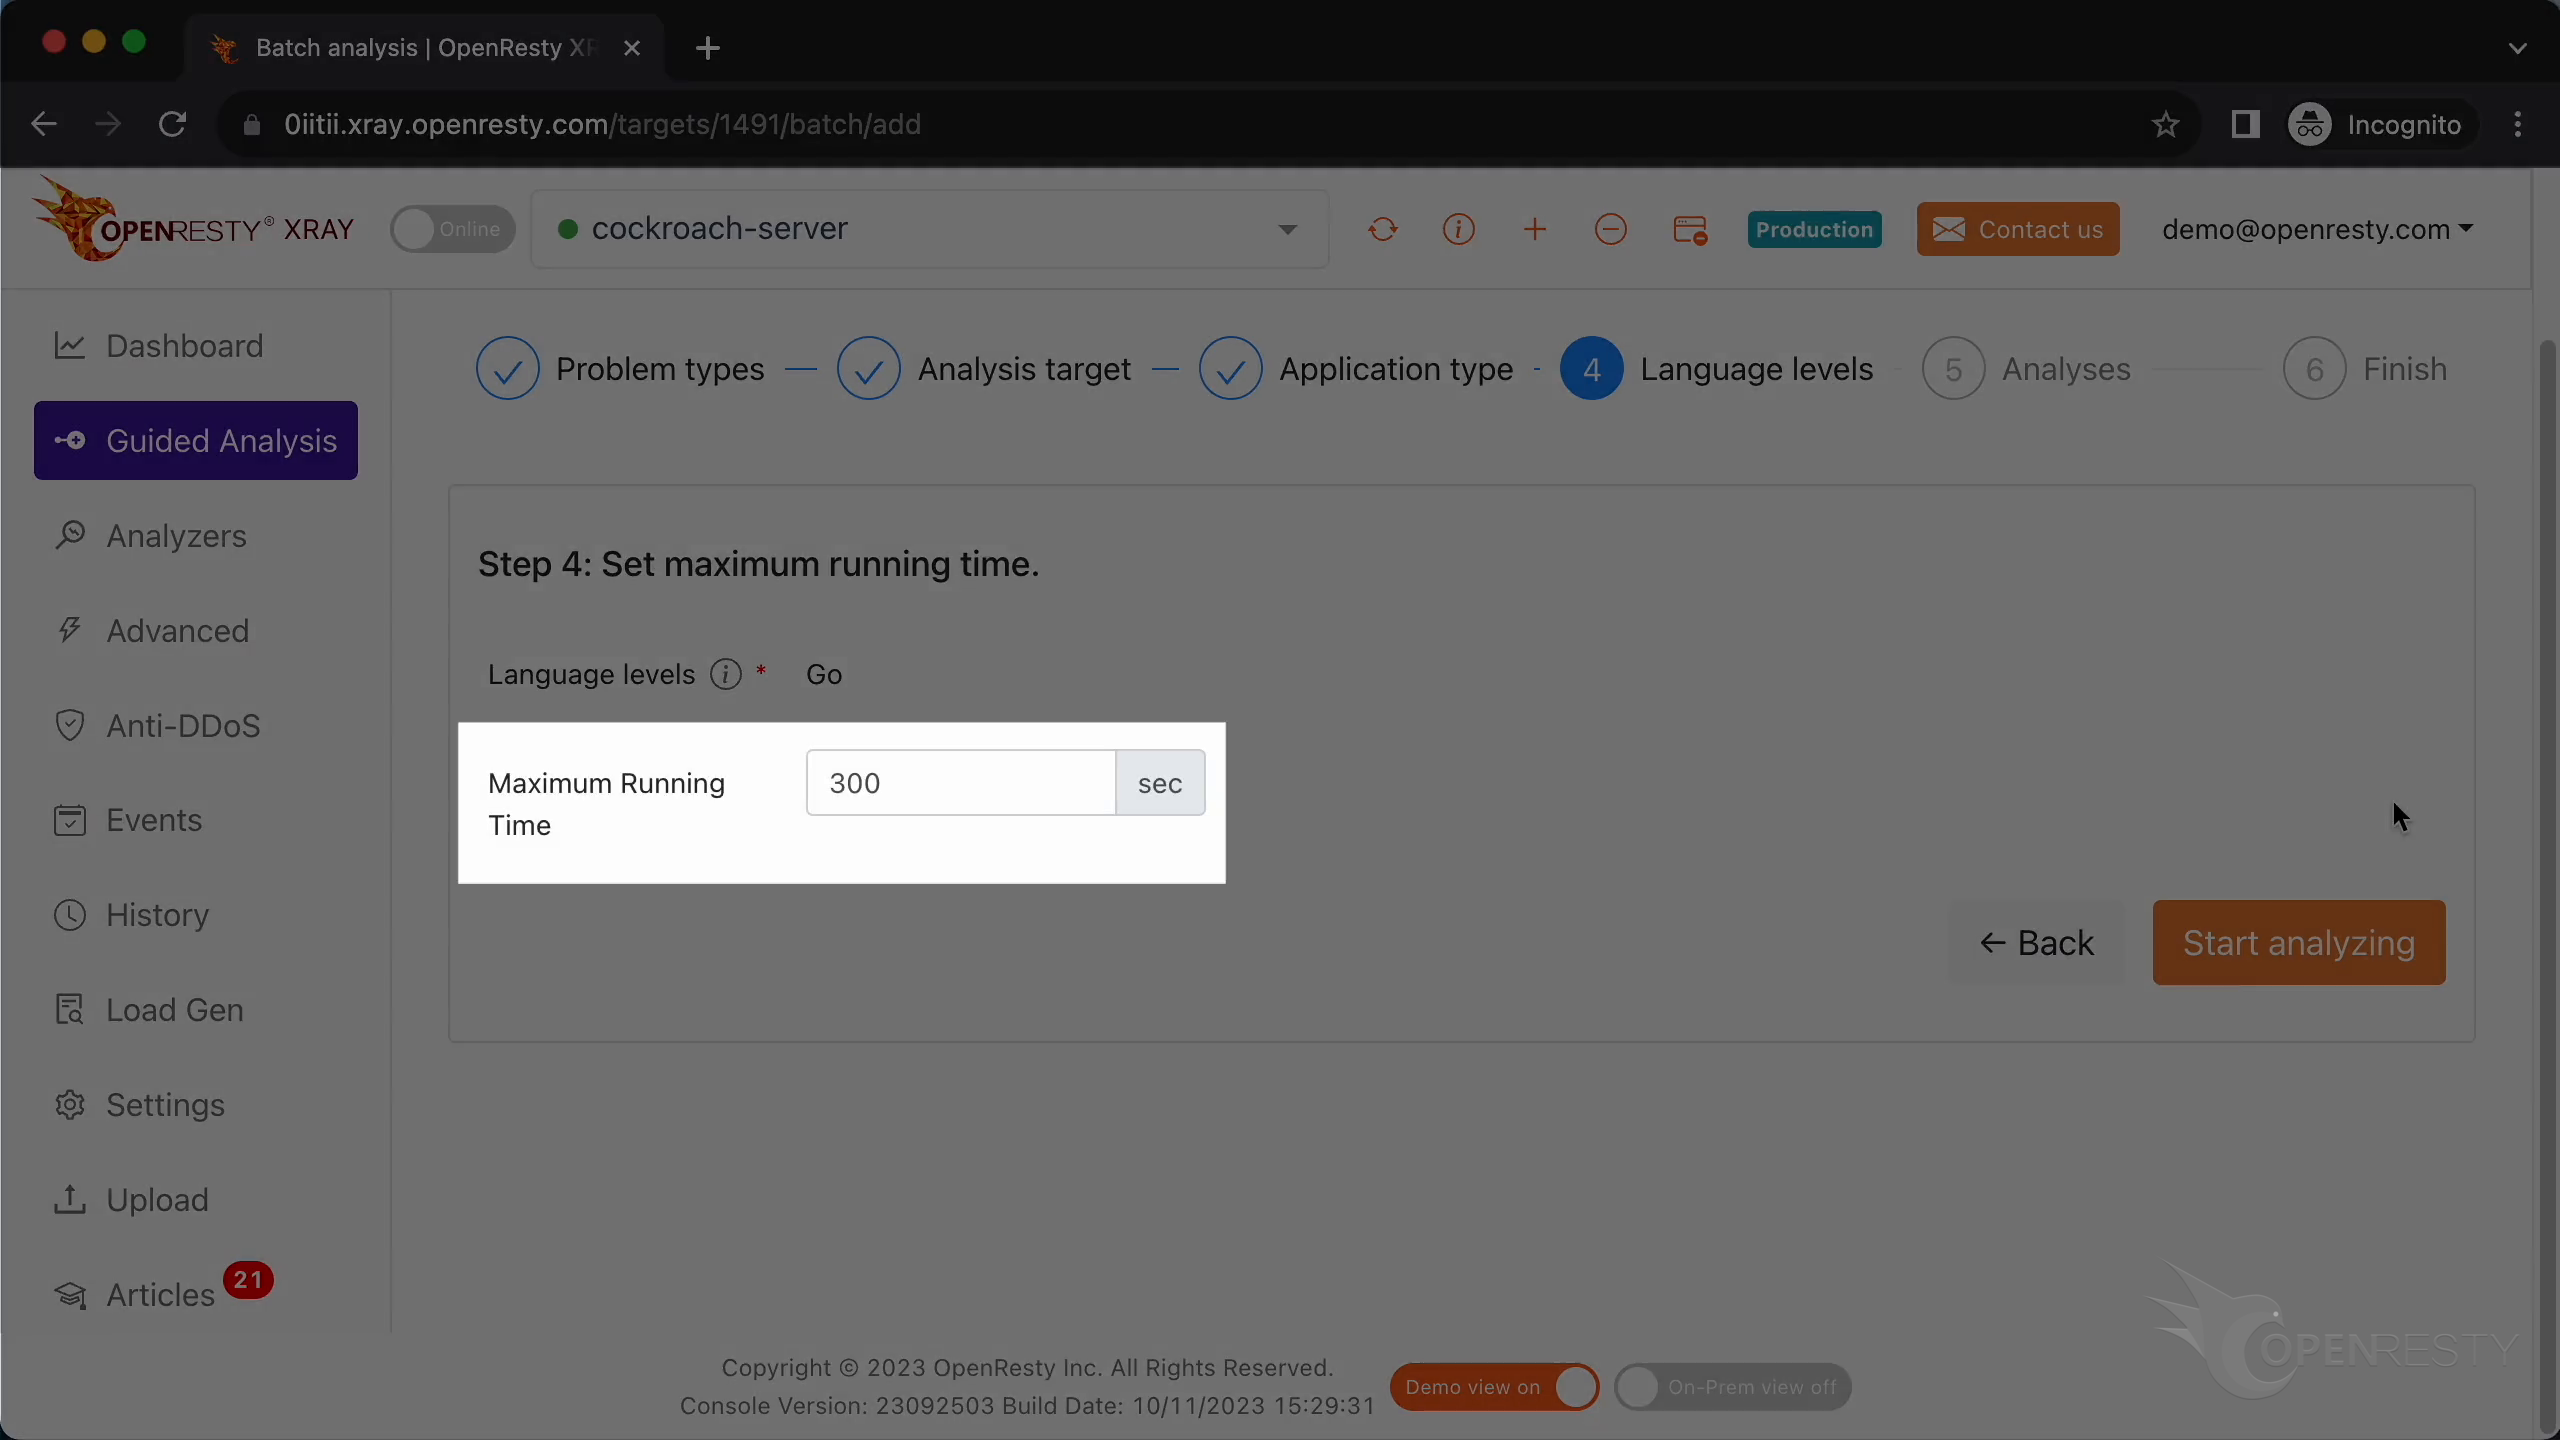
We can also set the maximum analyzing time. We’ll leave it as 300 seconds, which is the default value.
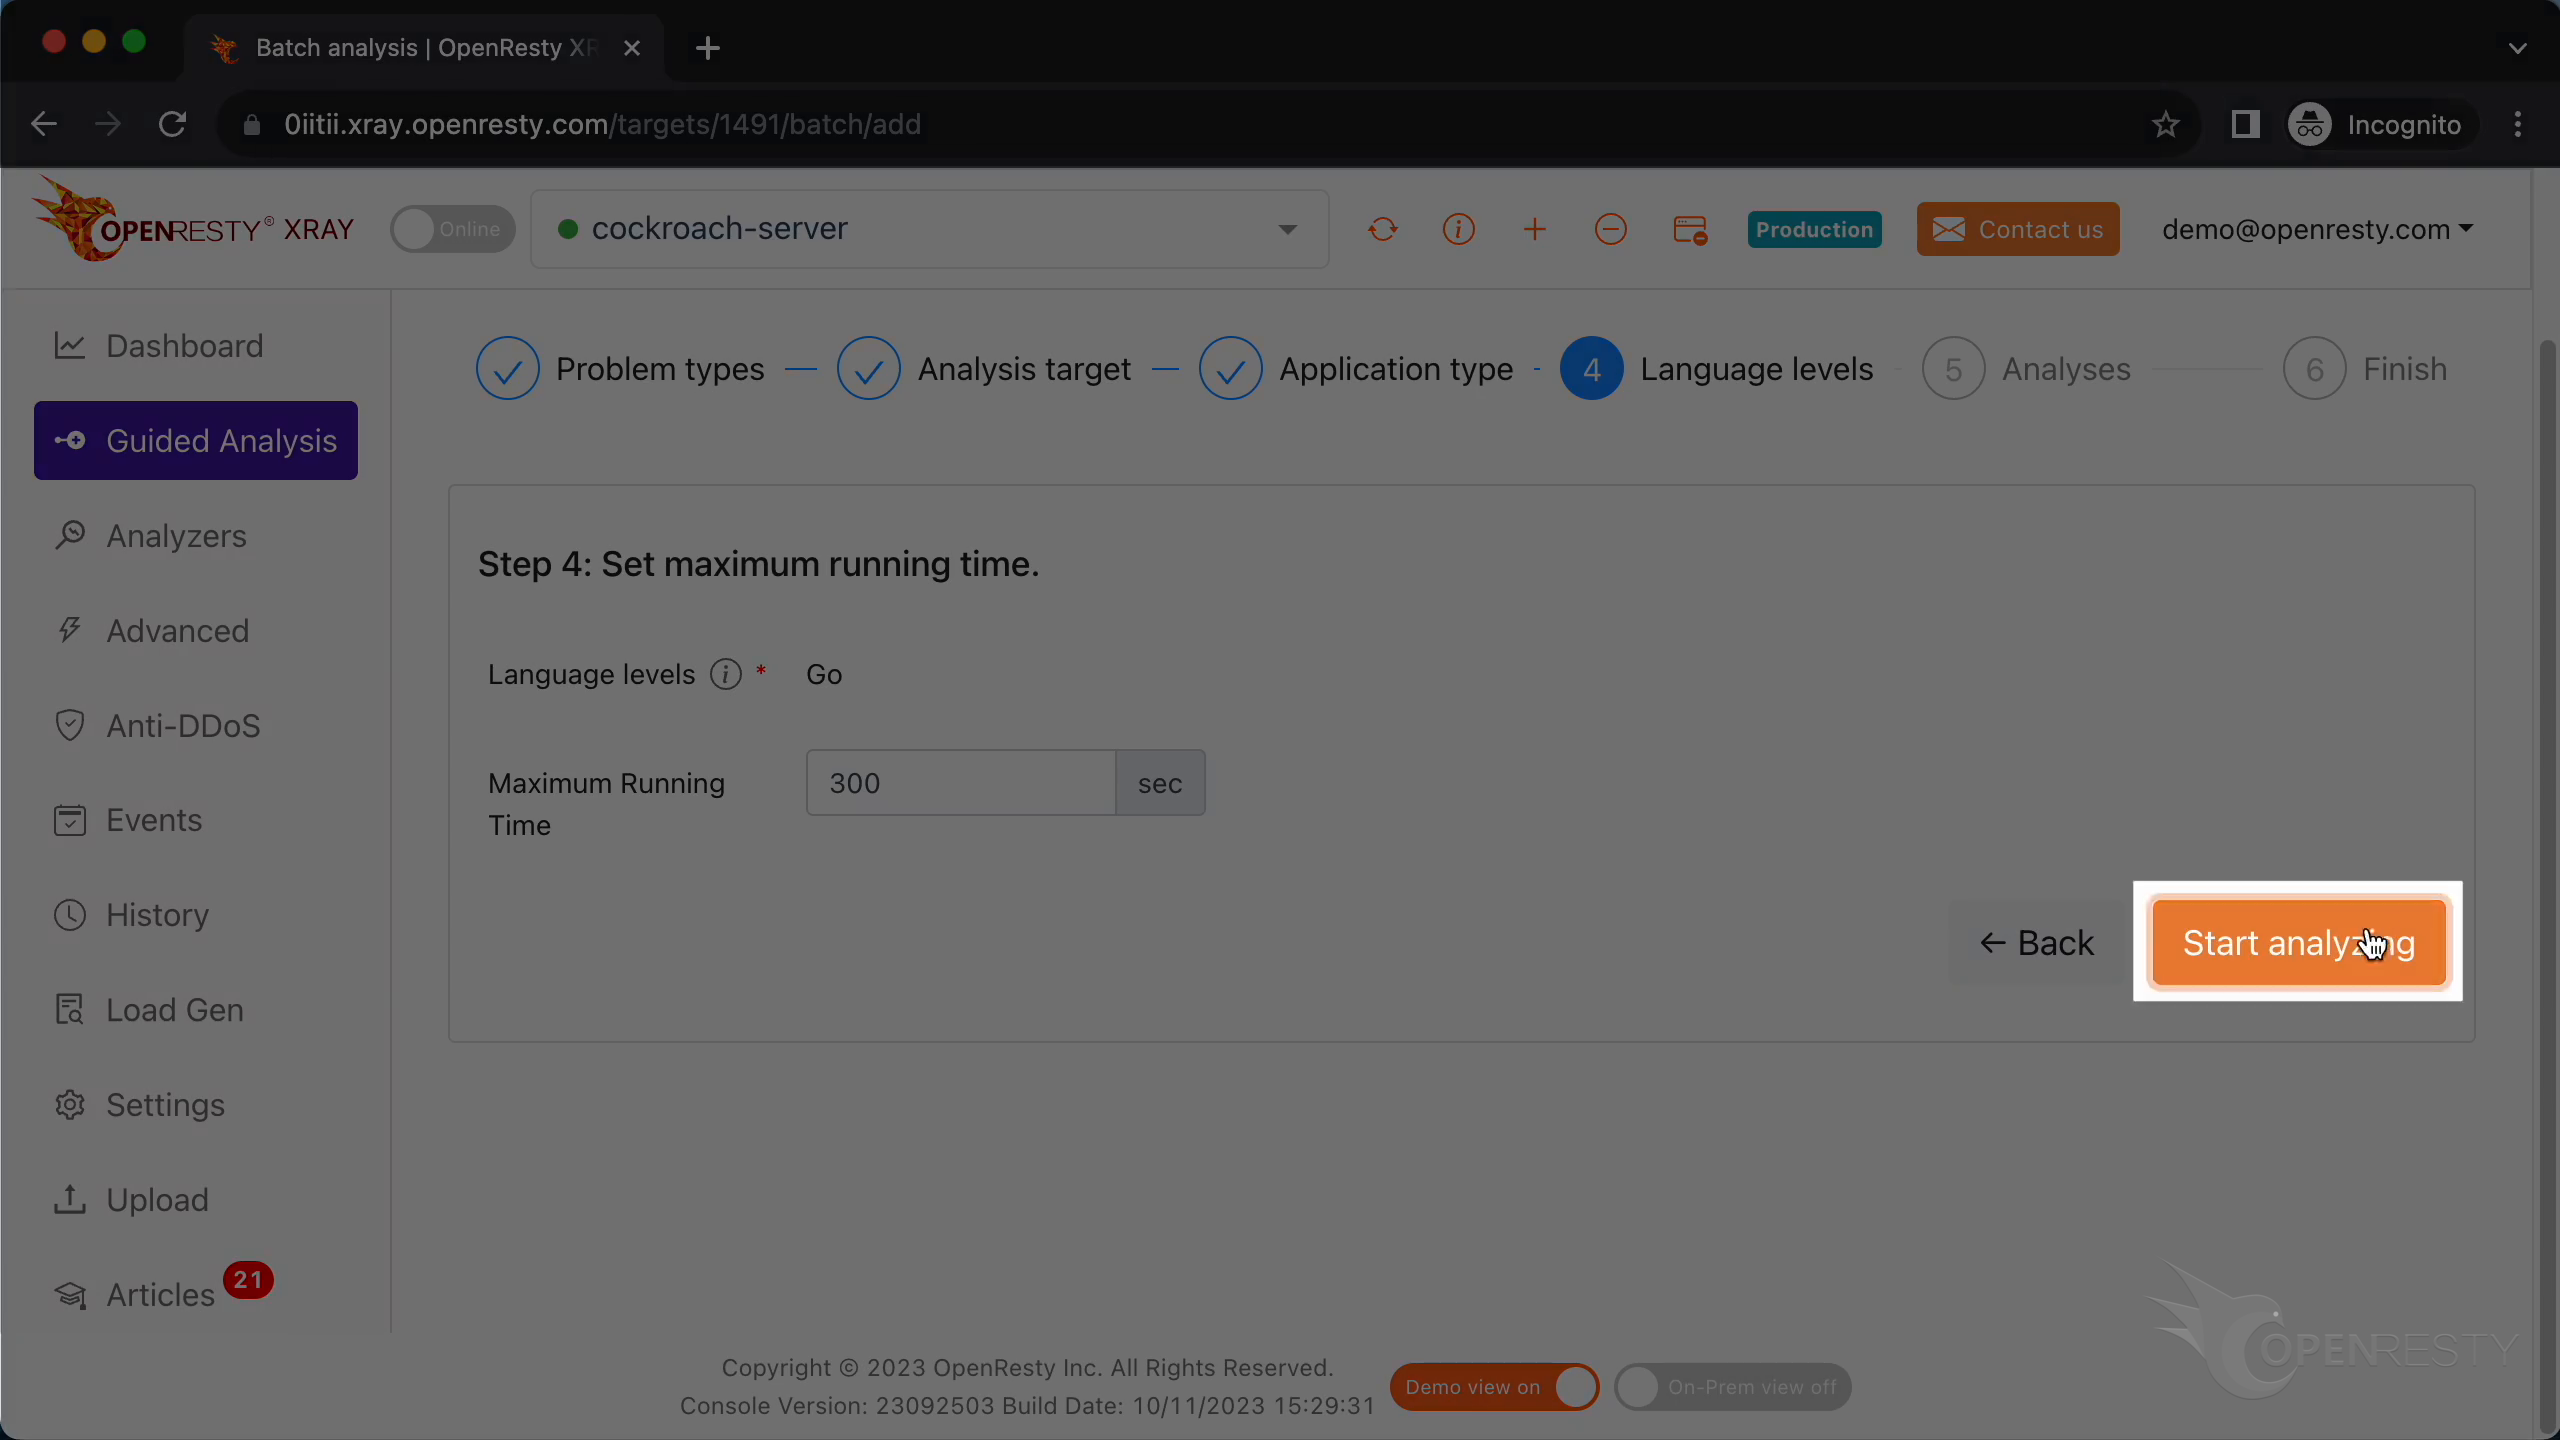
Let’s start analyzing.
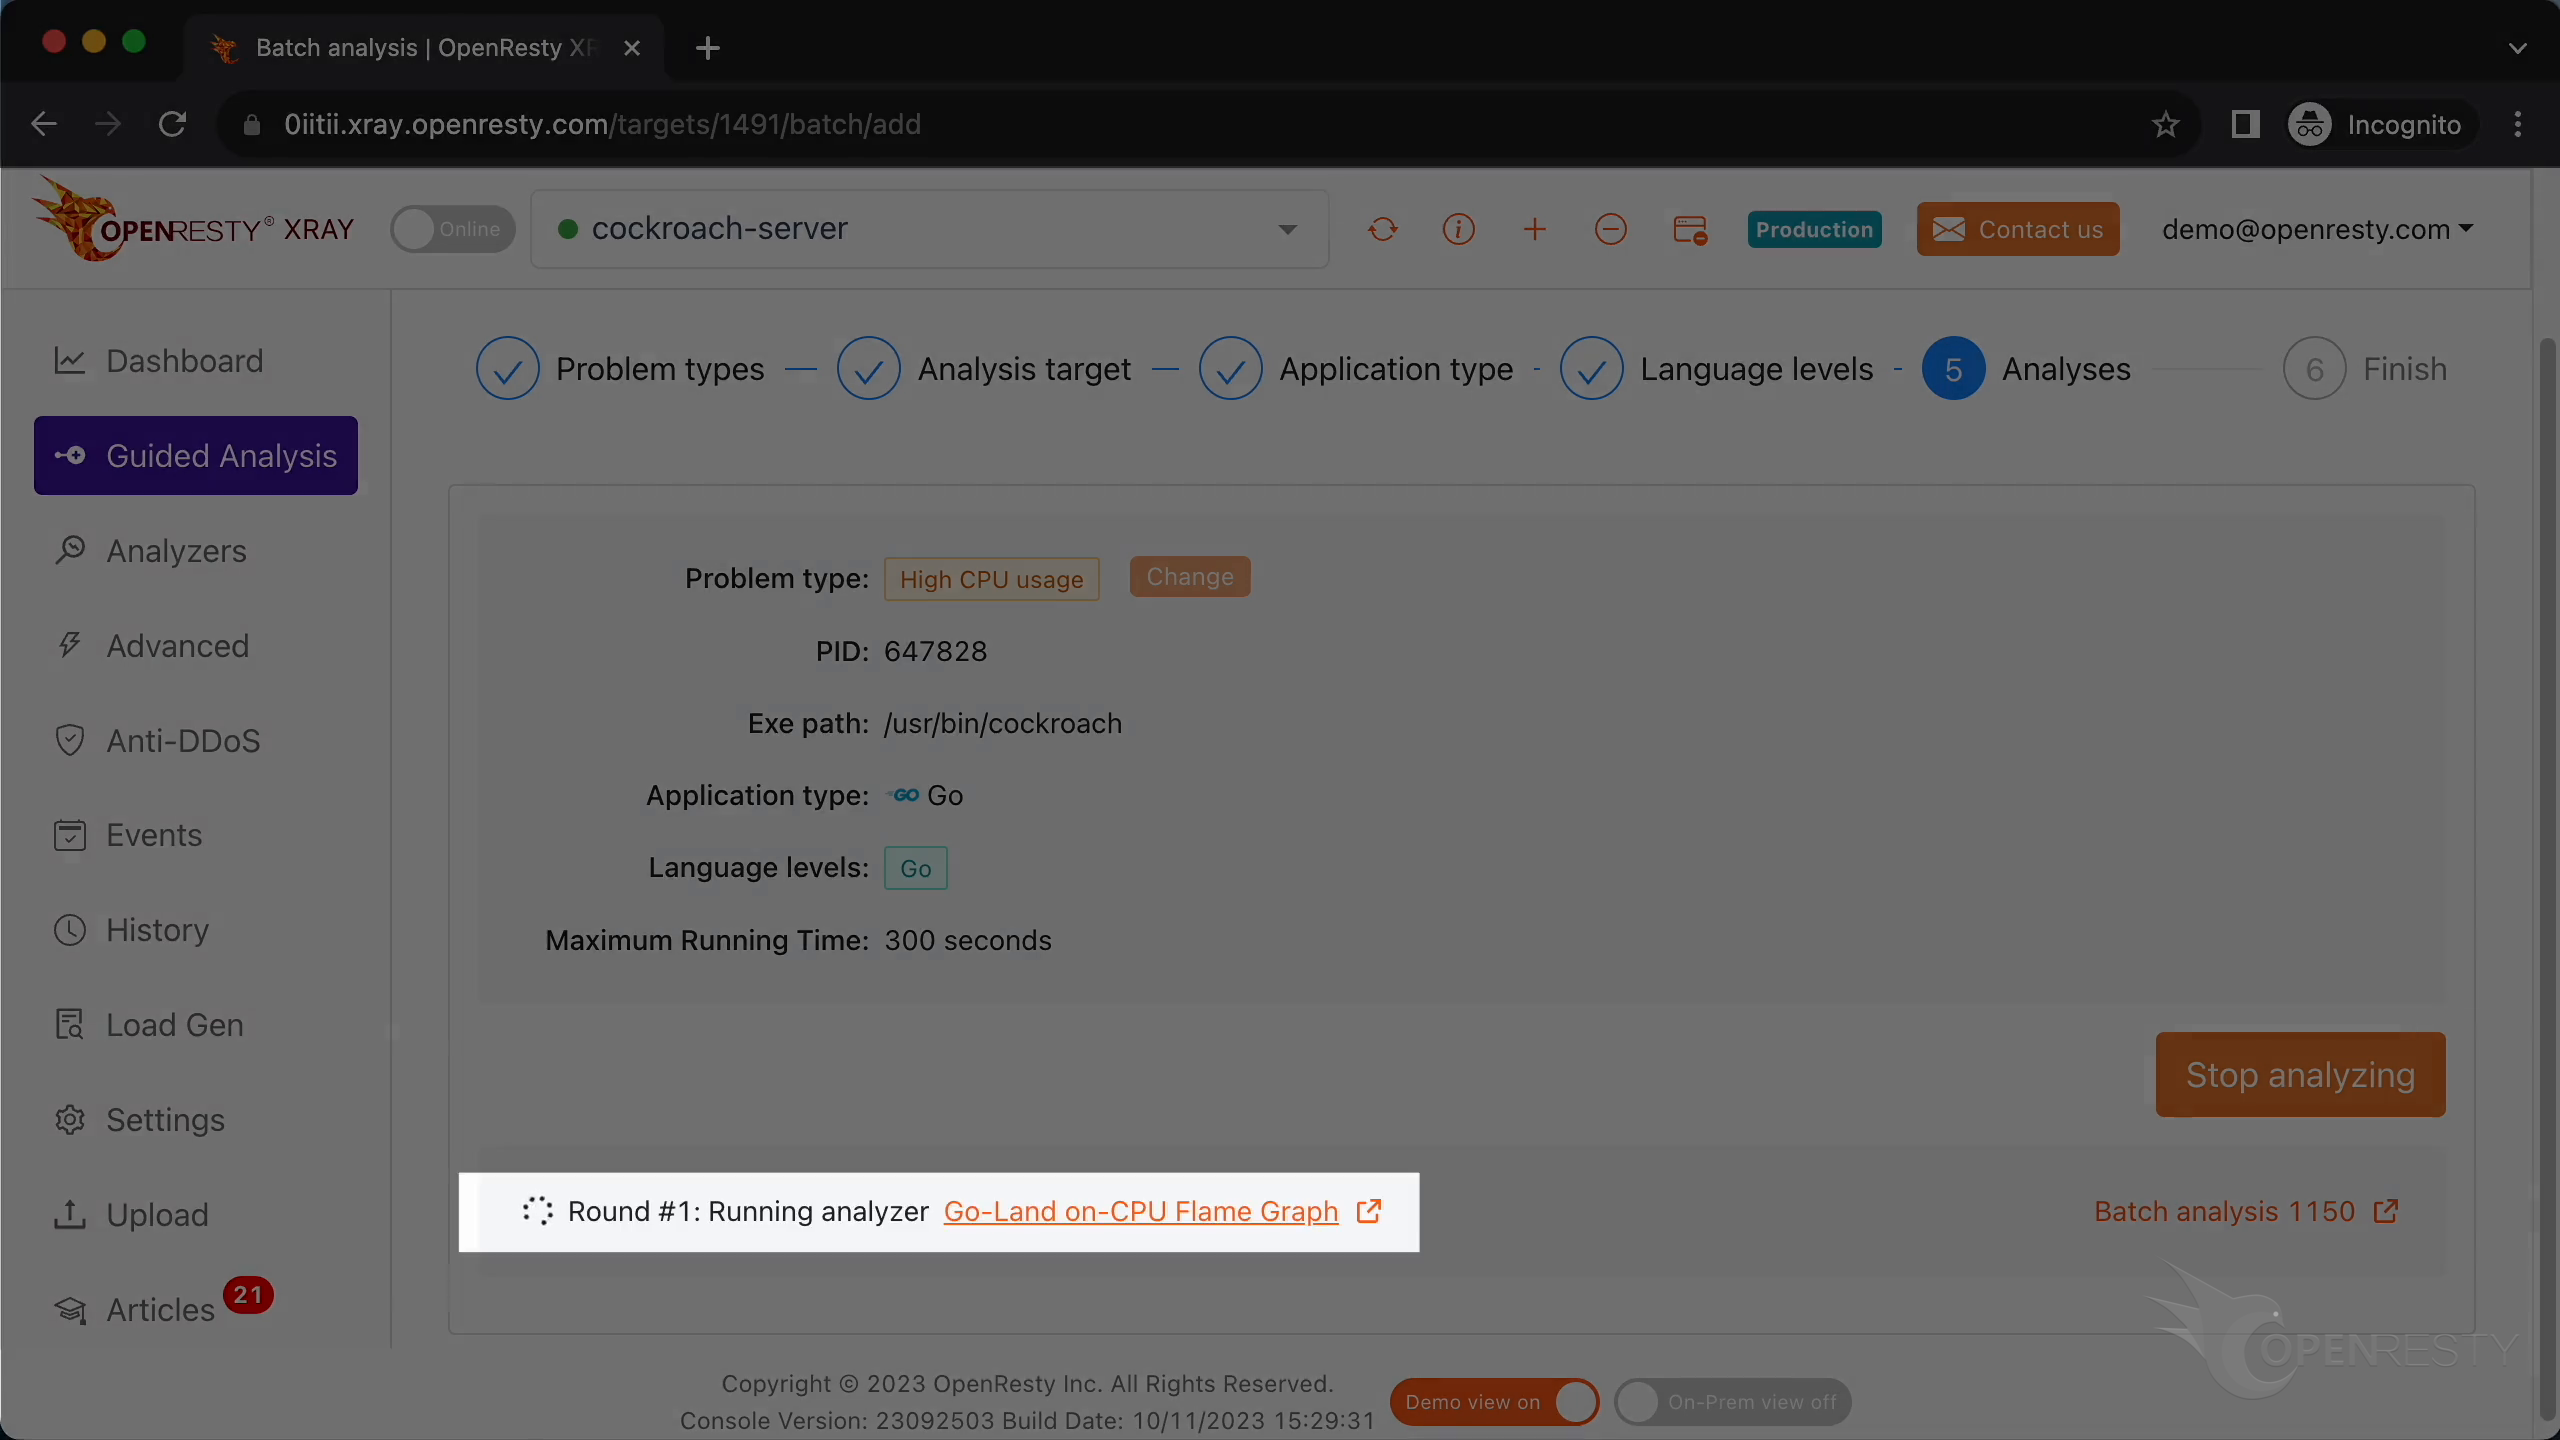
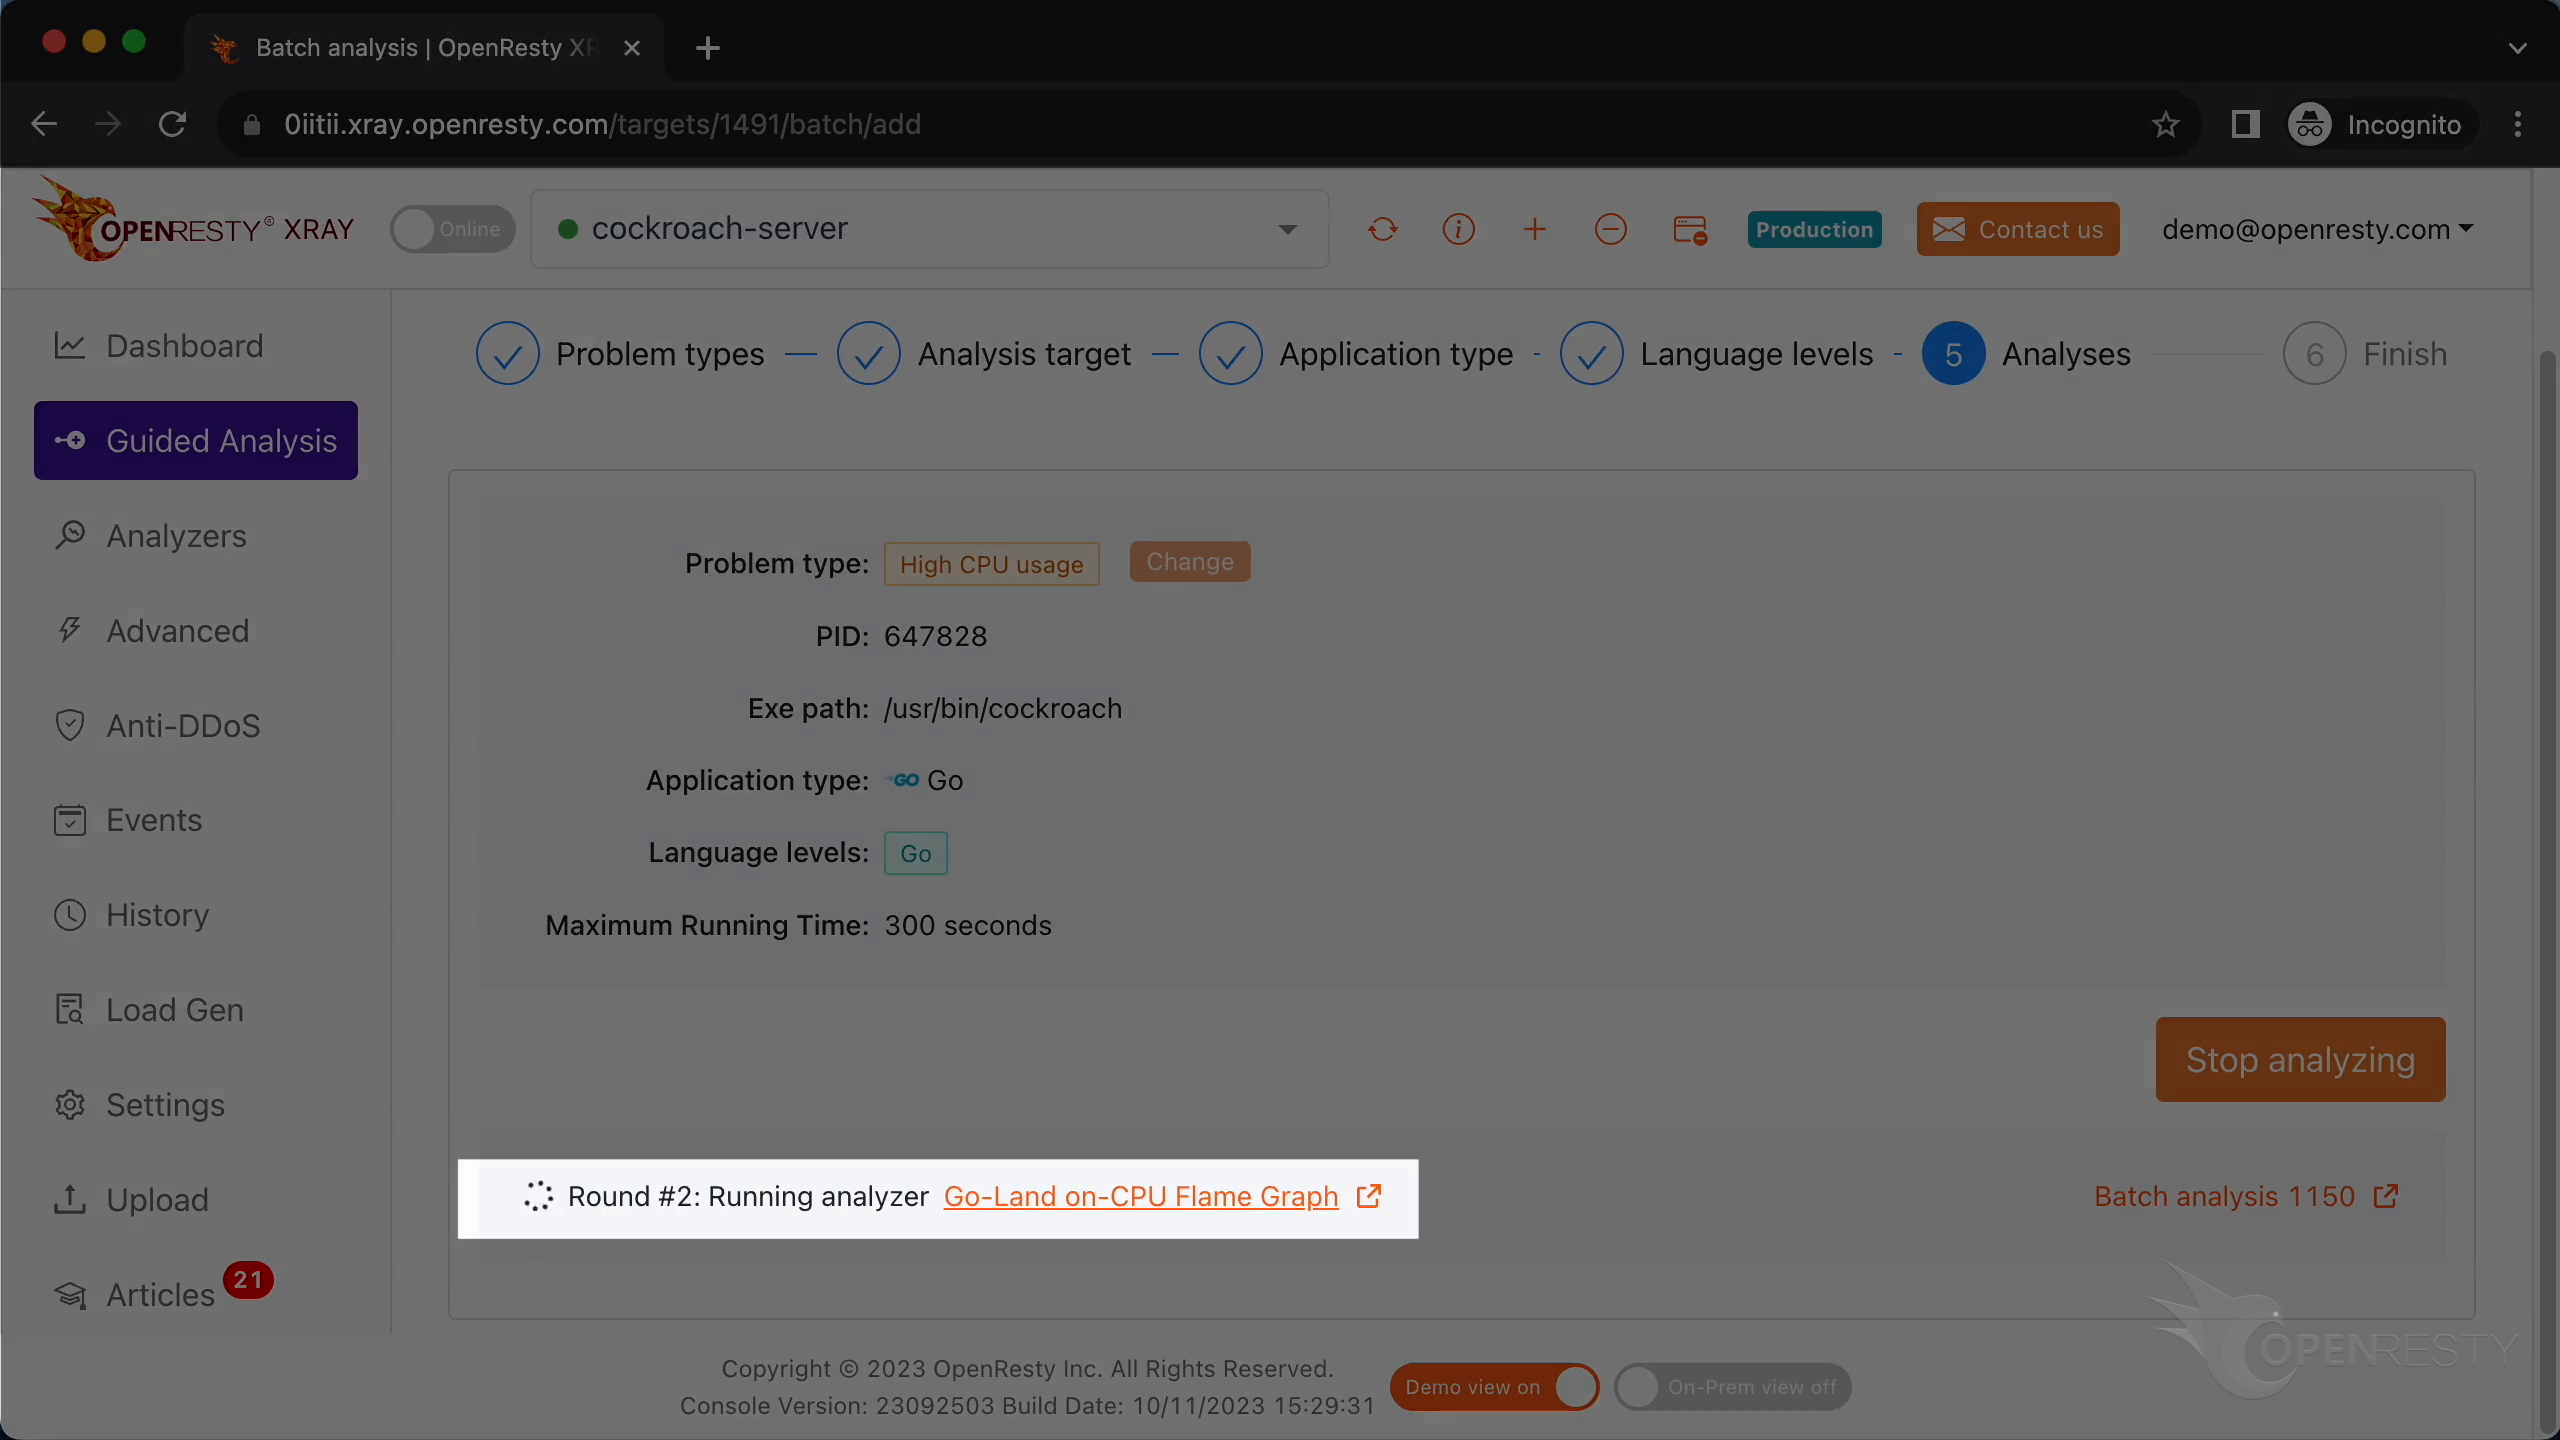
The system will keep performing different rounds of analysis. Now it’s executing the first round.
The first round is done and it’s already on the second one. That’s enough for this case.
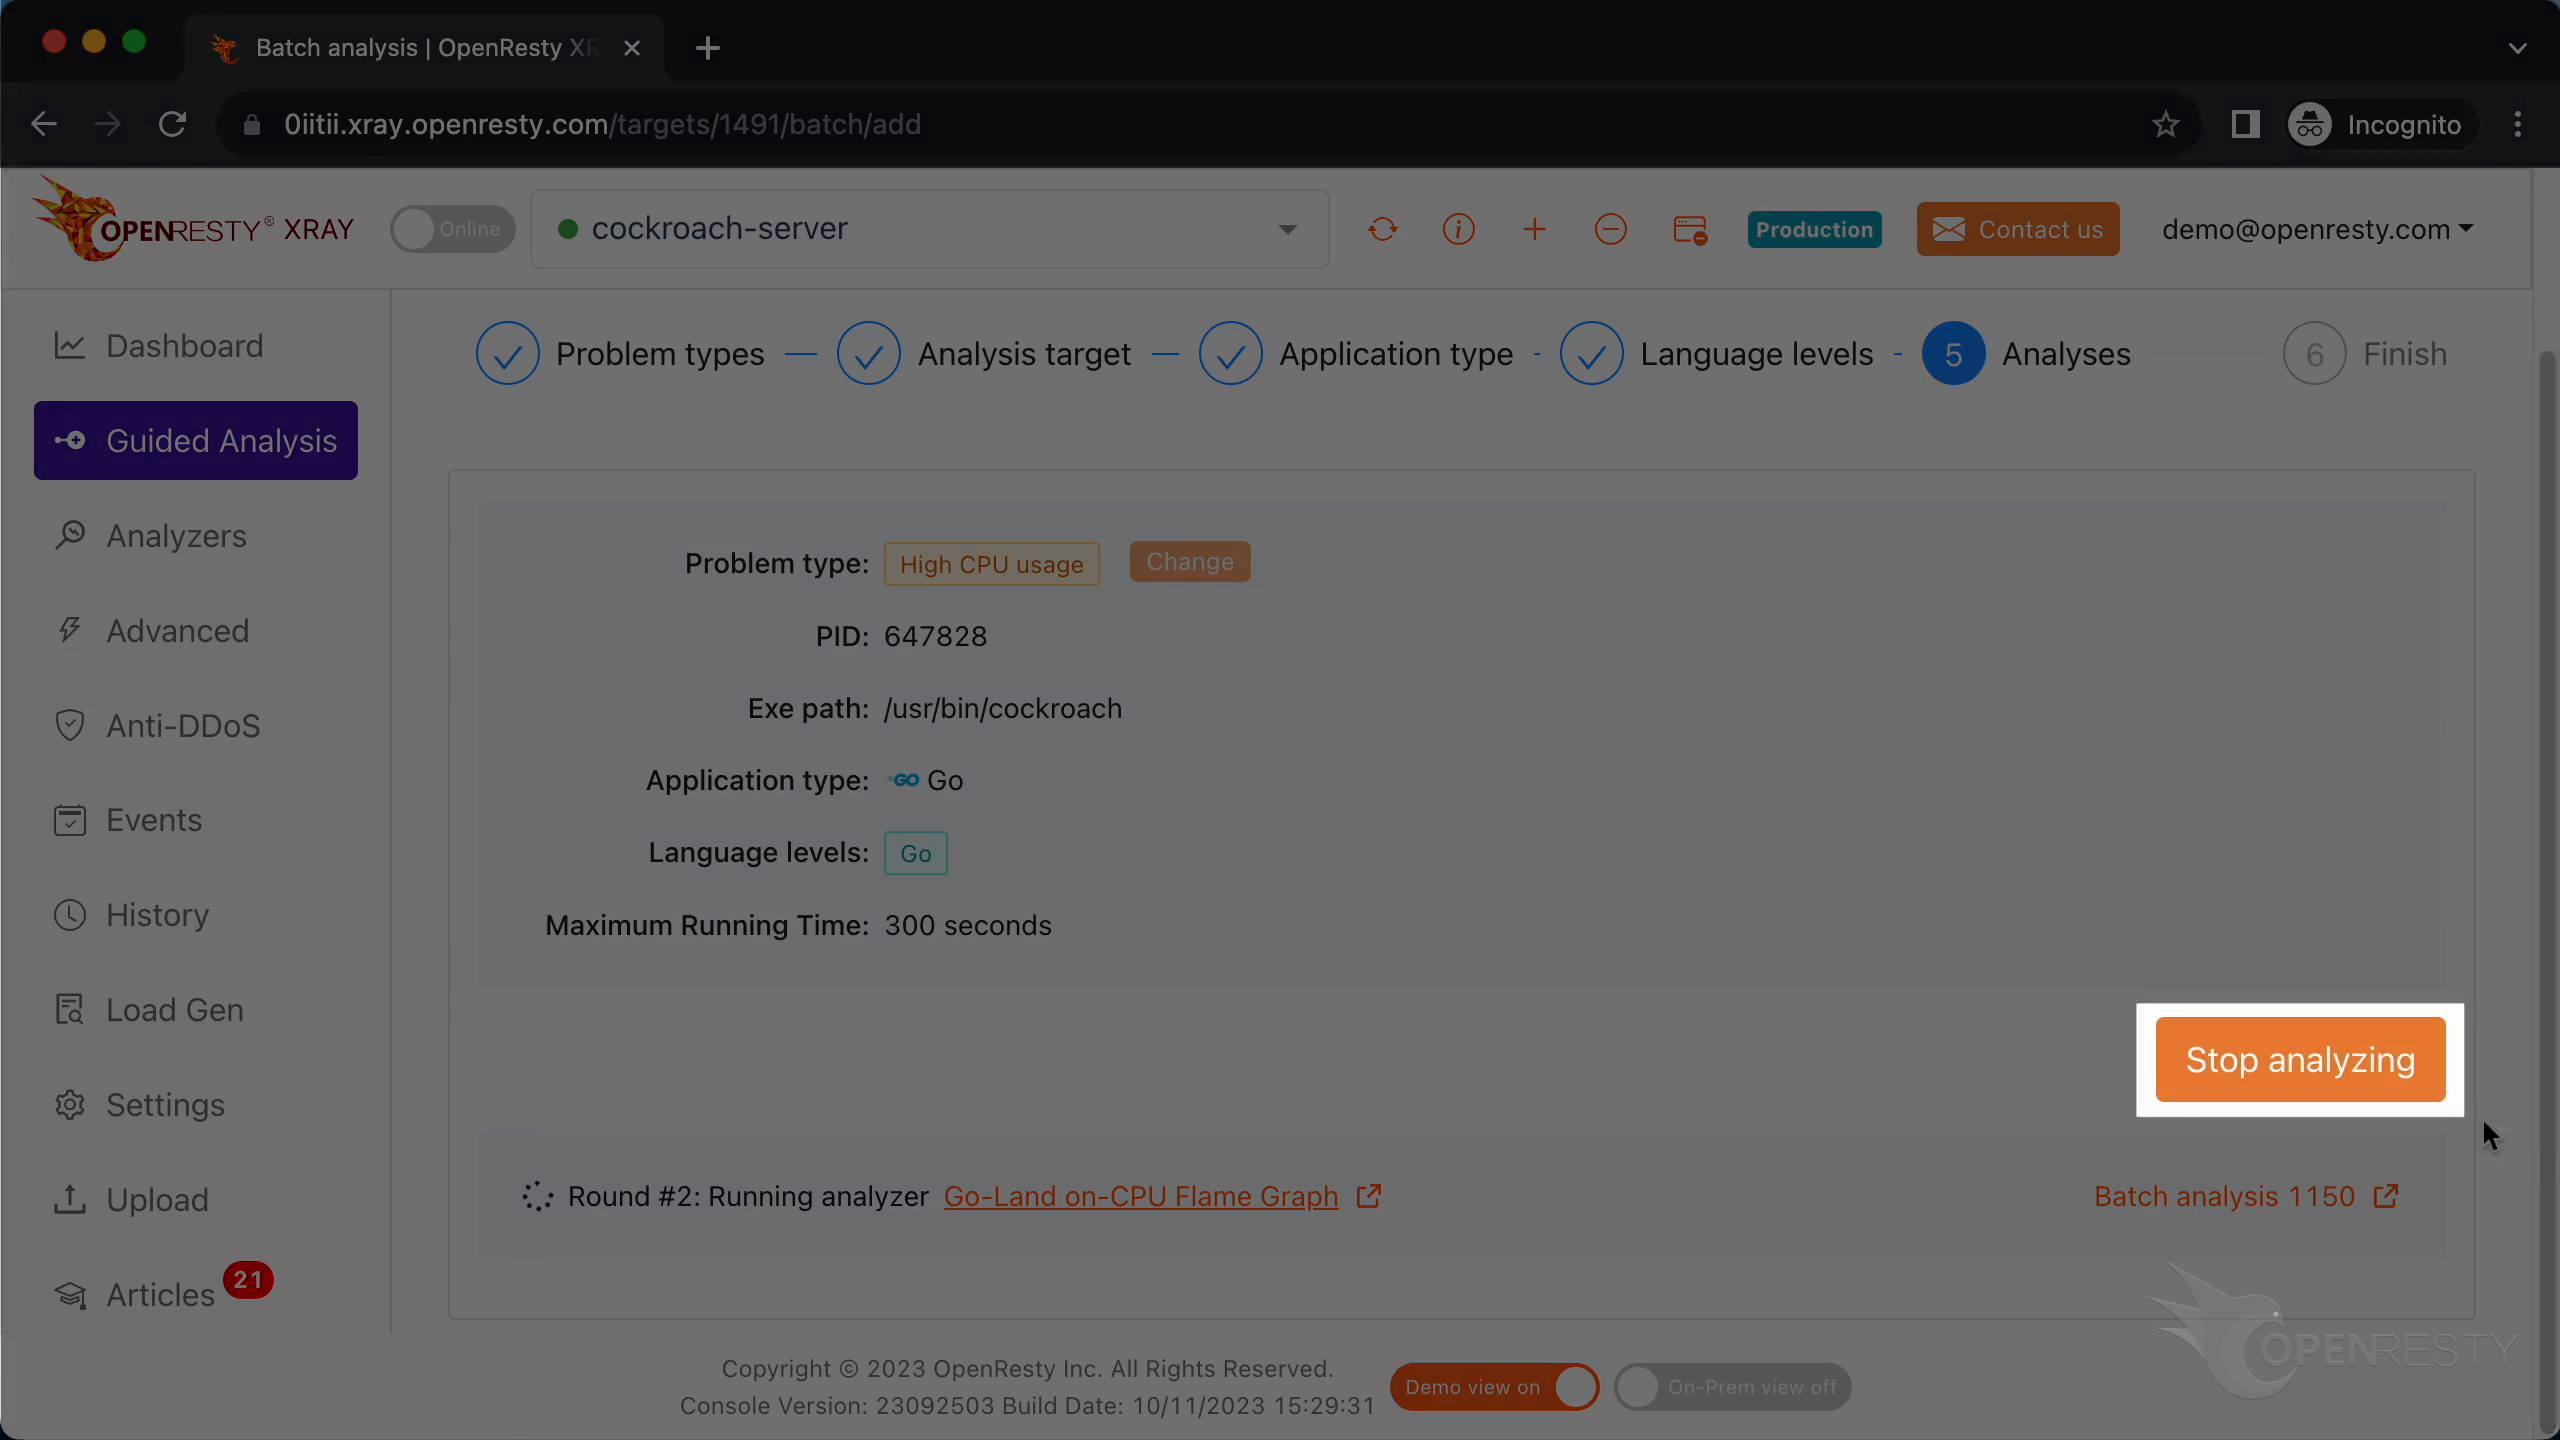
Let’s stop analyzing.
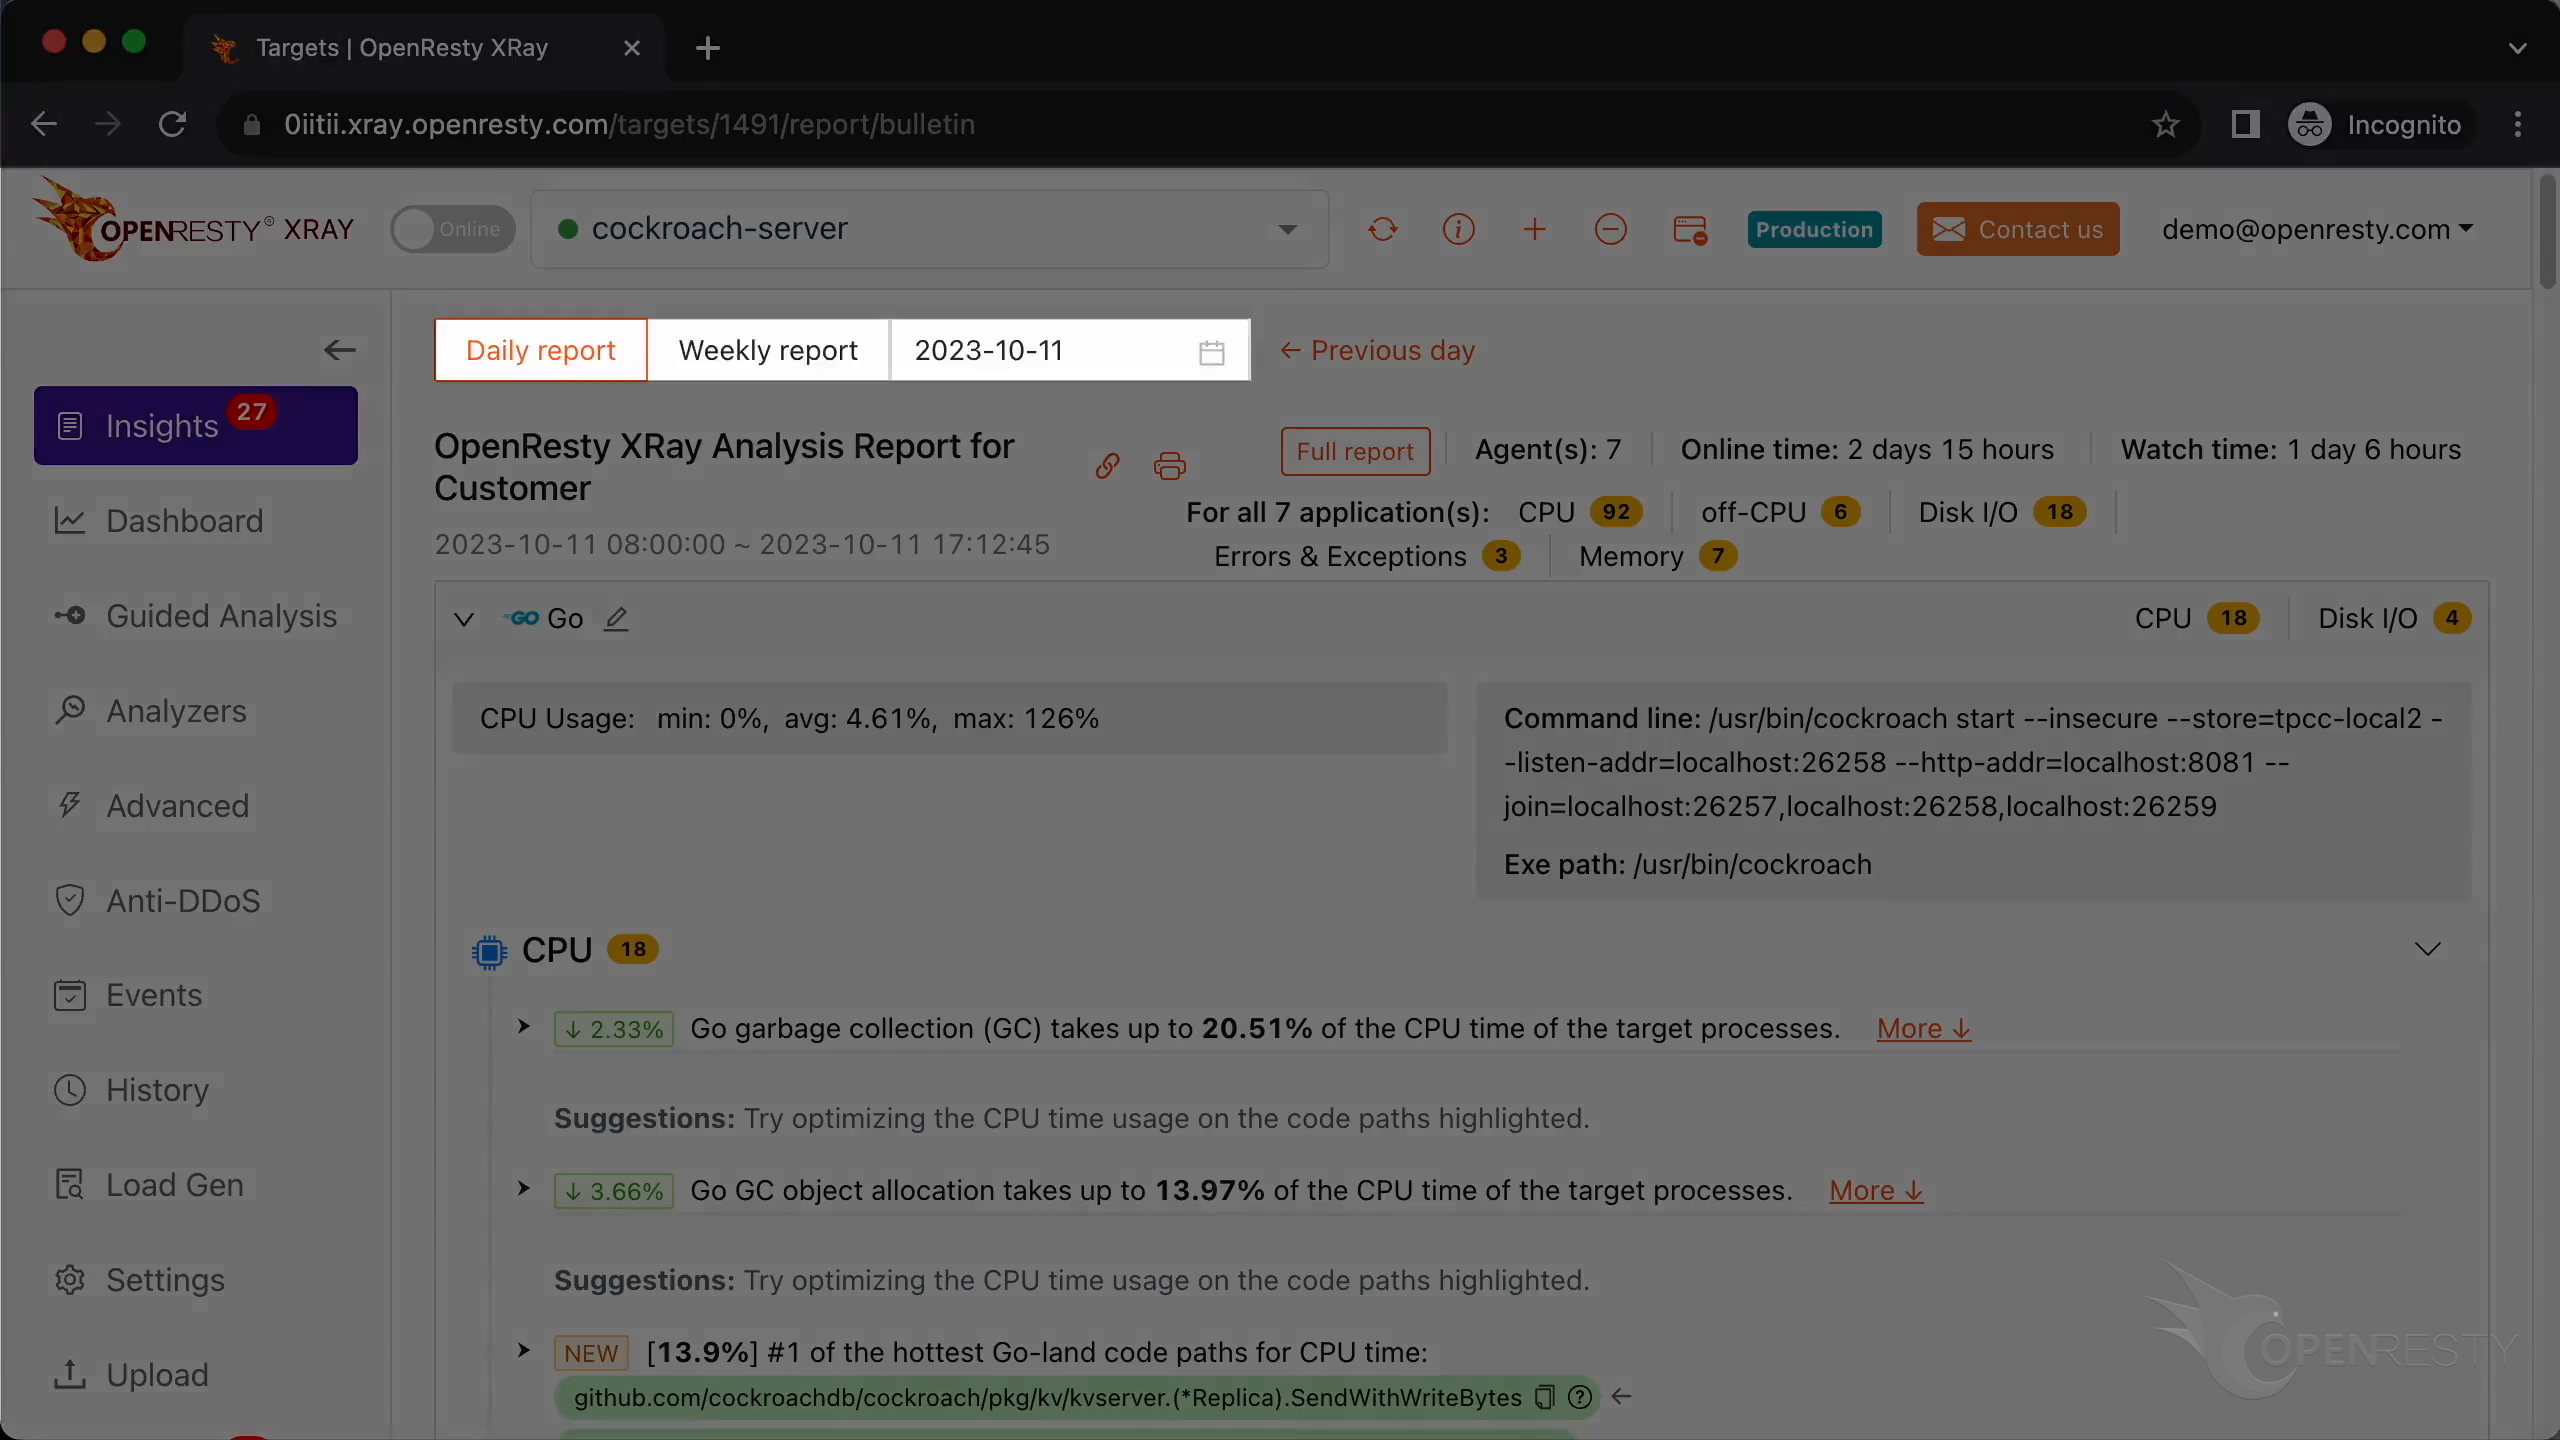
It automatically generated an analysis report.
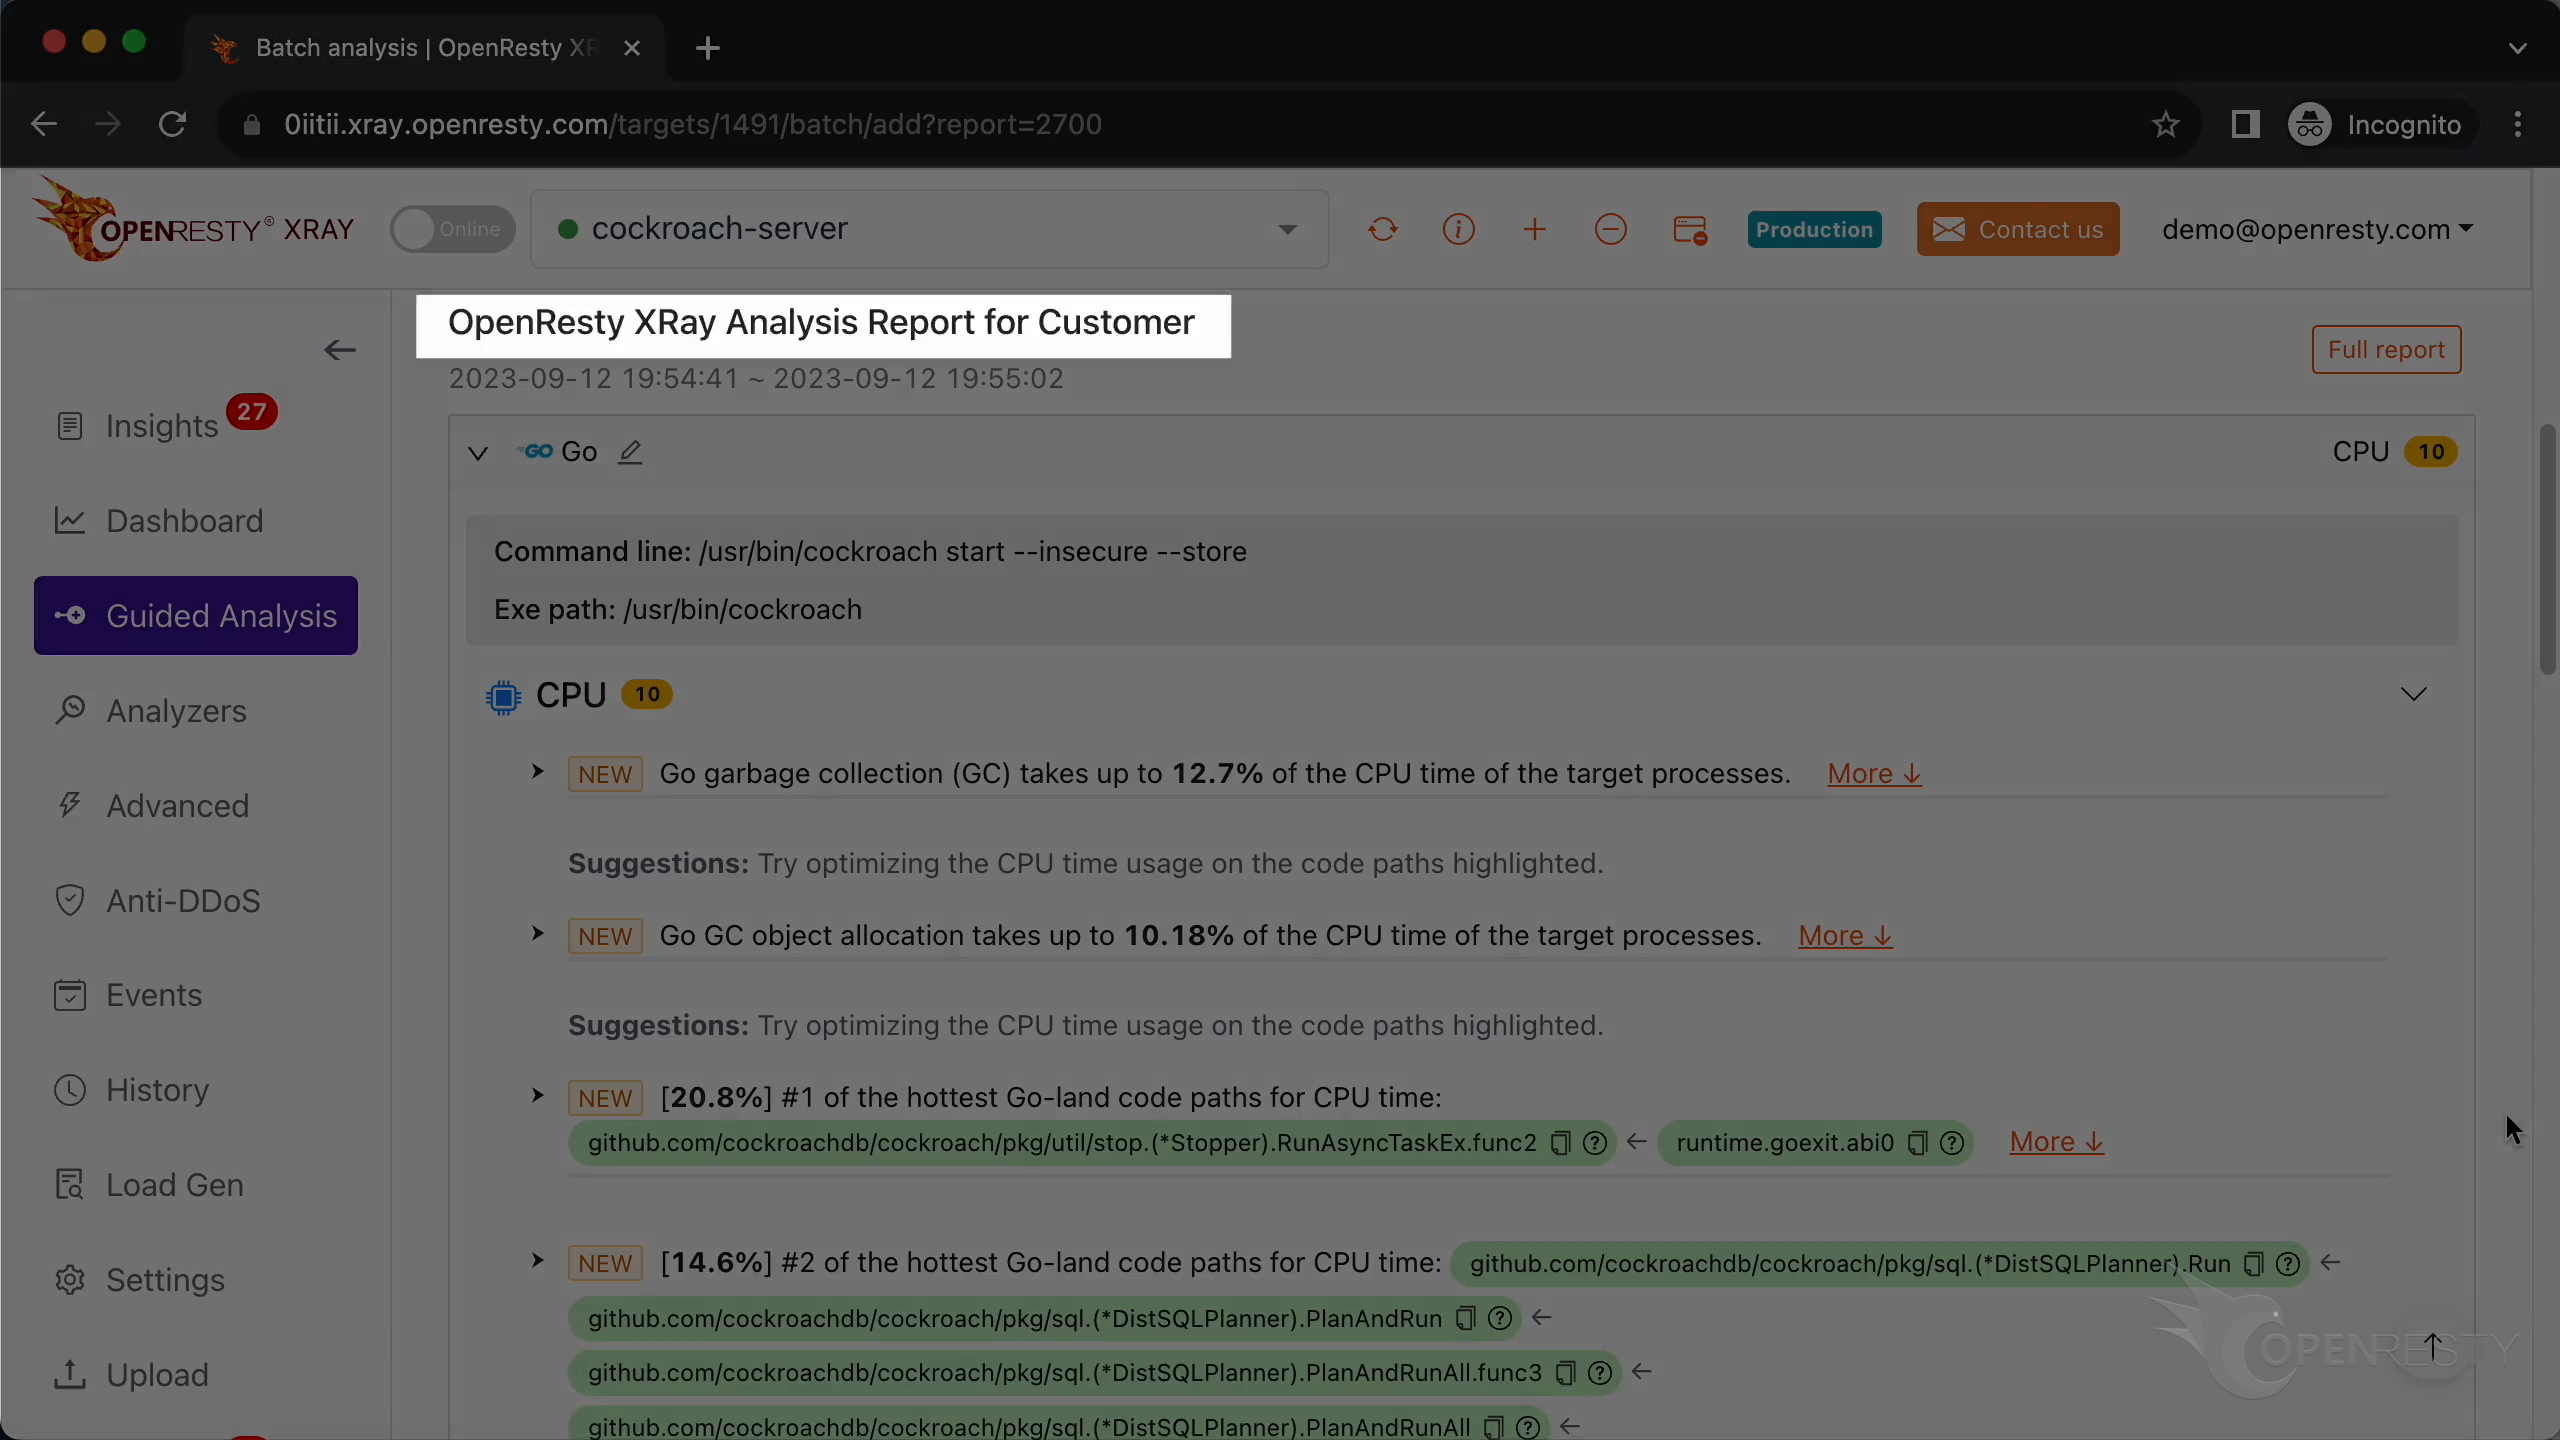
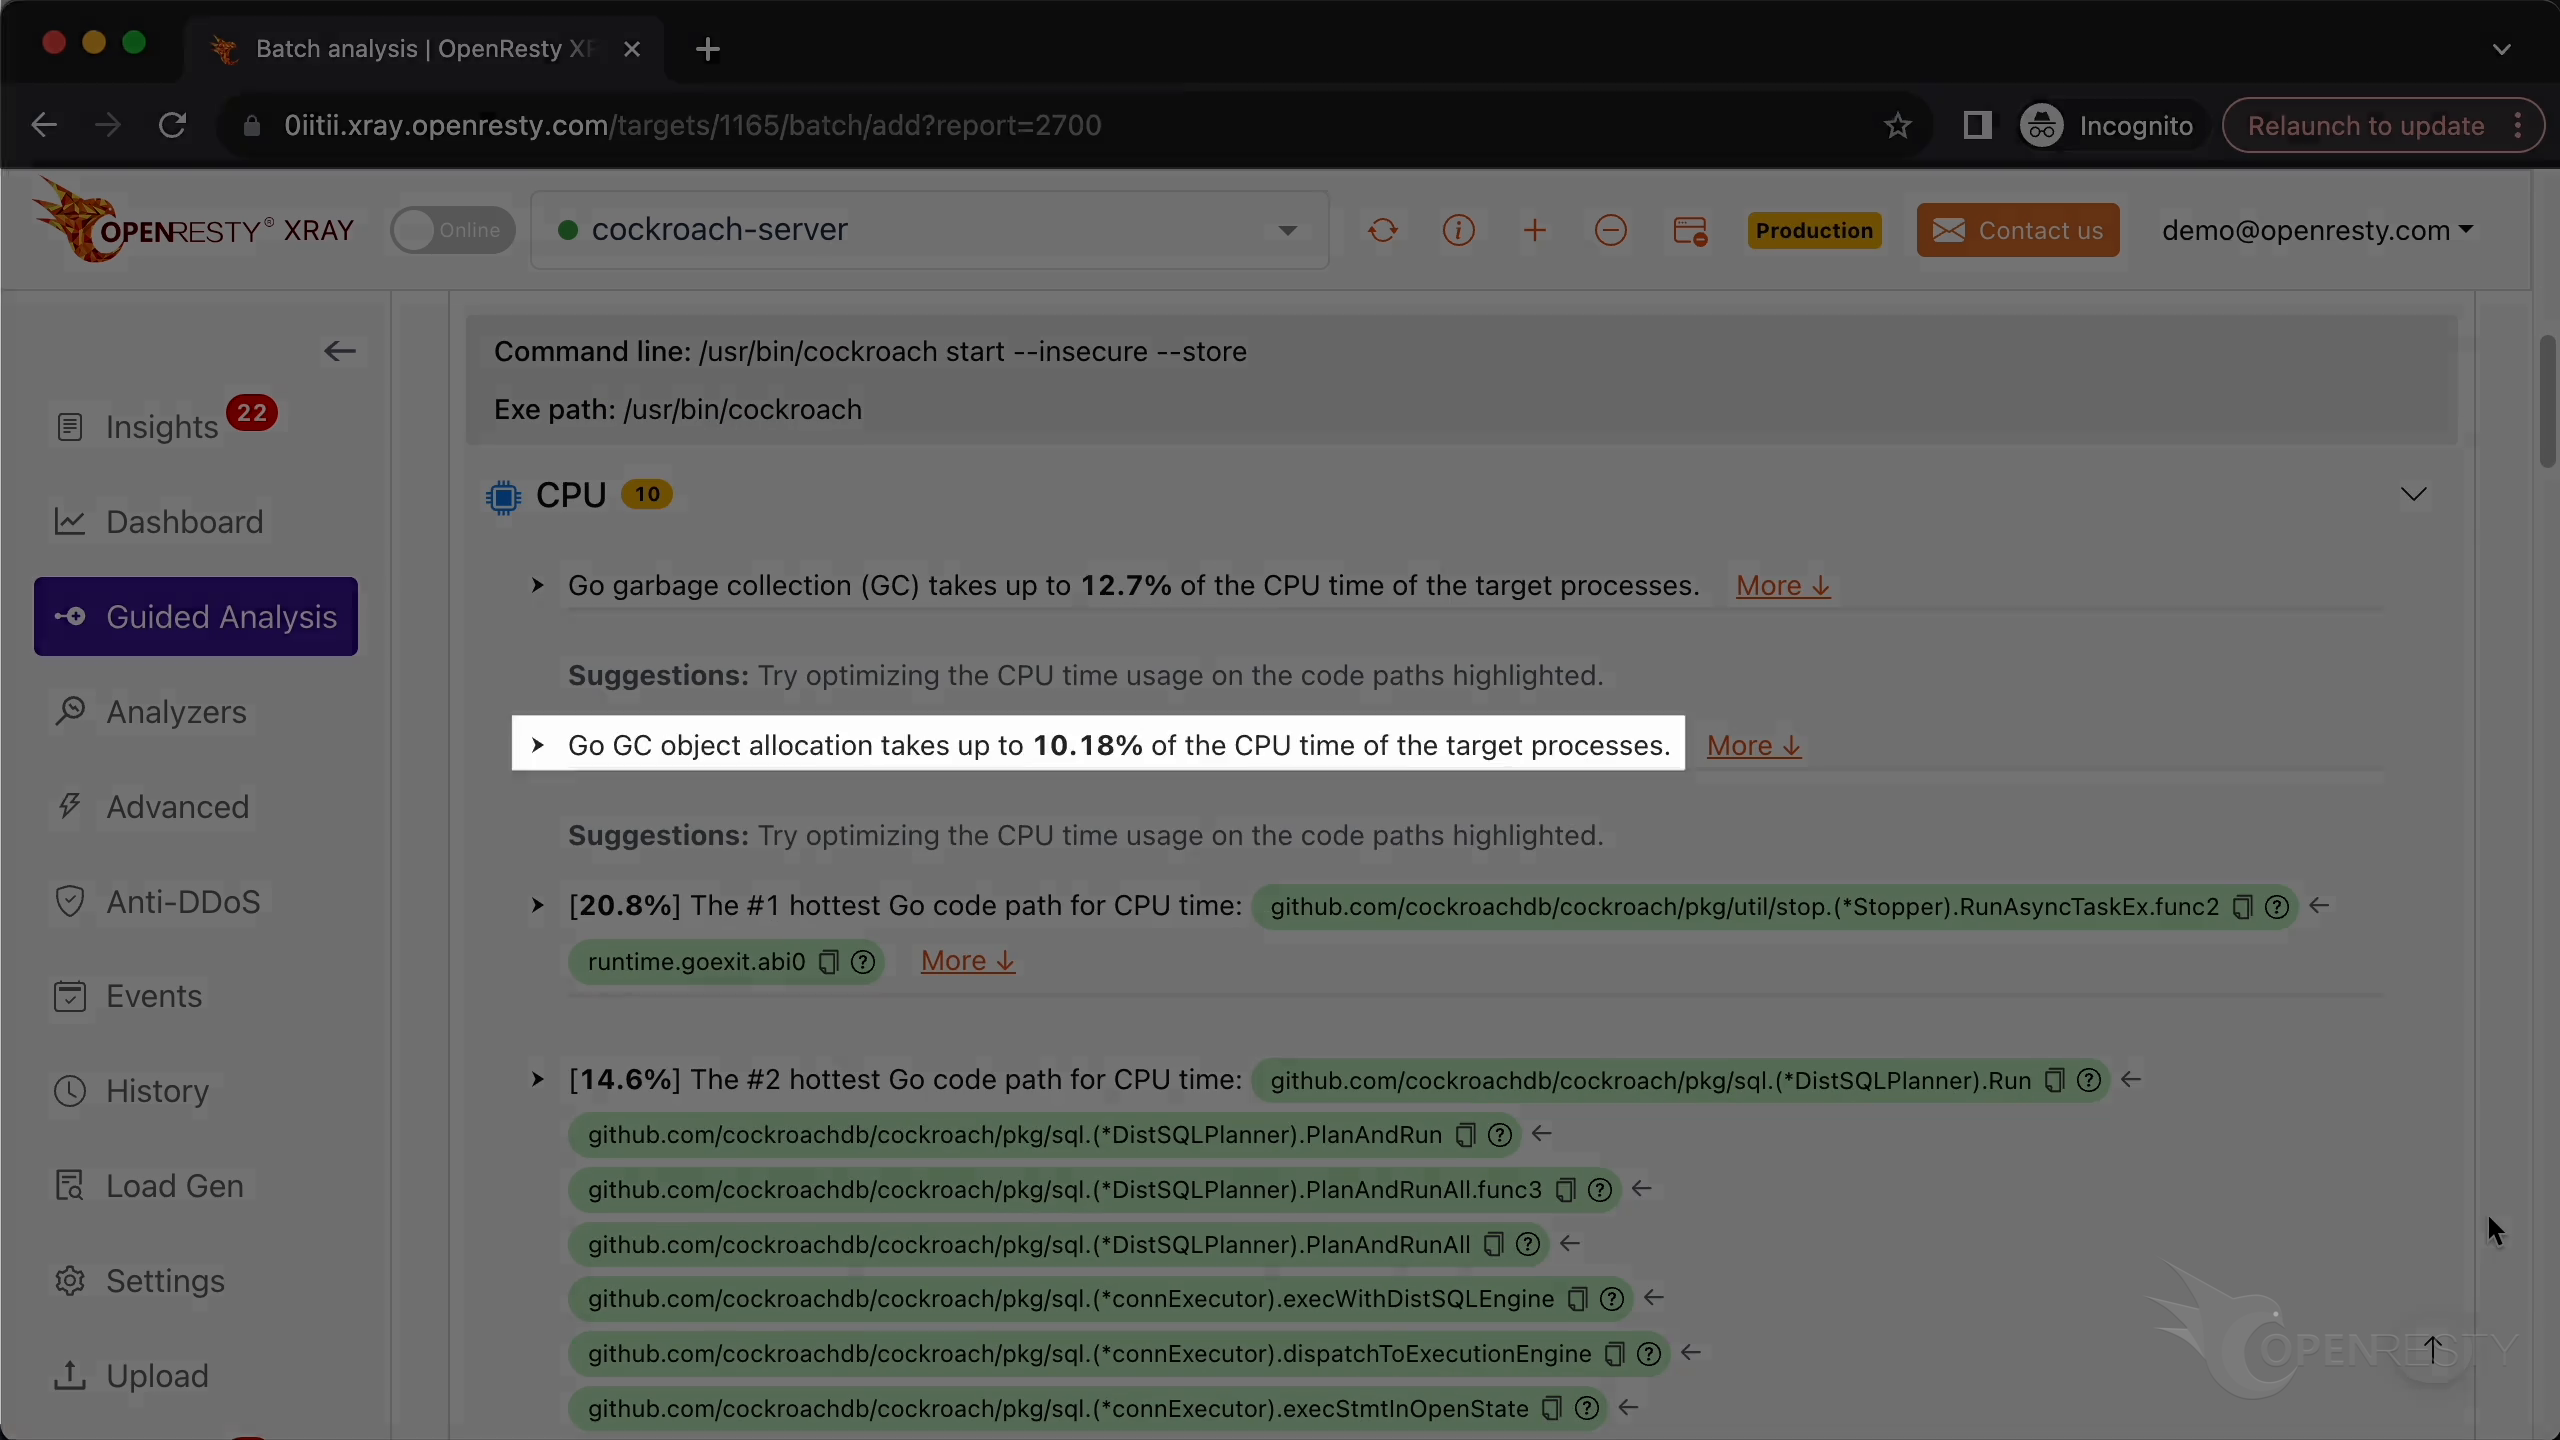
This is the type of problem we diagnose. It’s CPU.
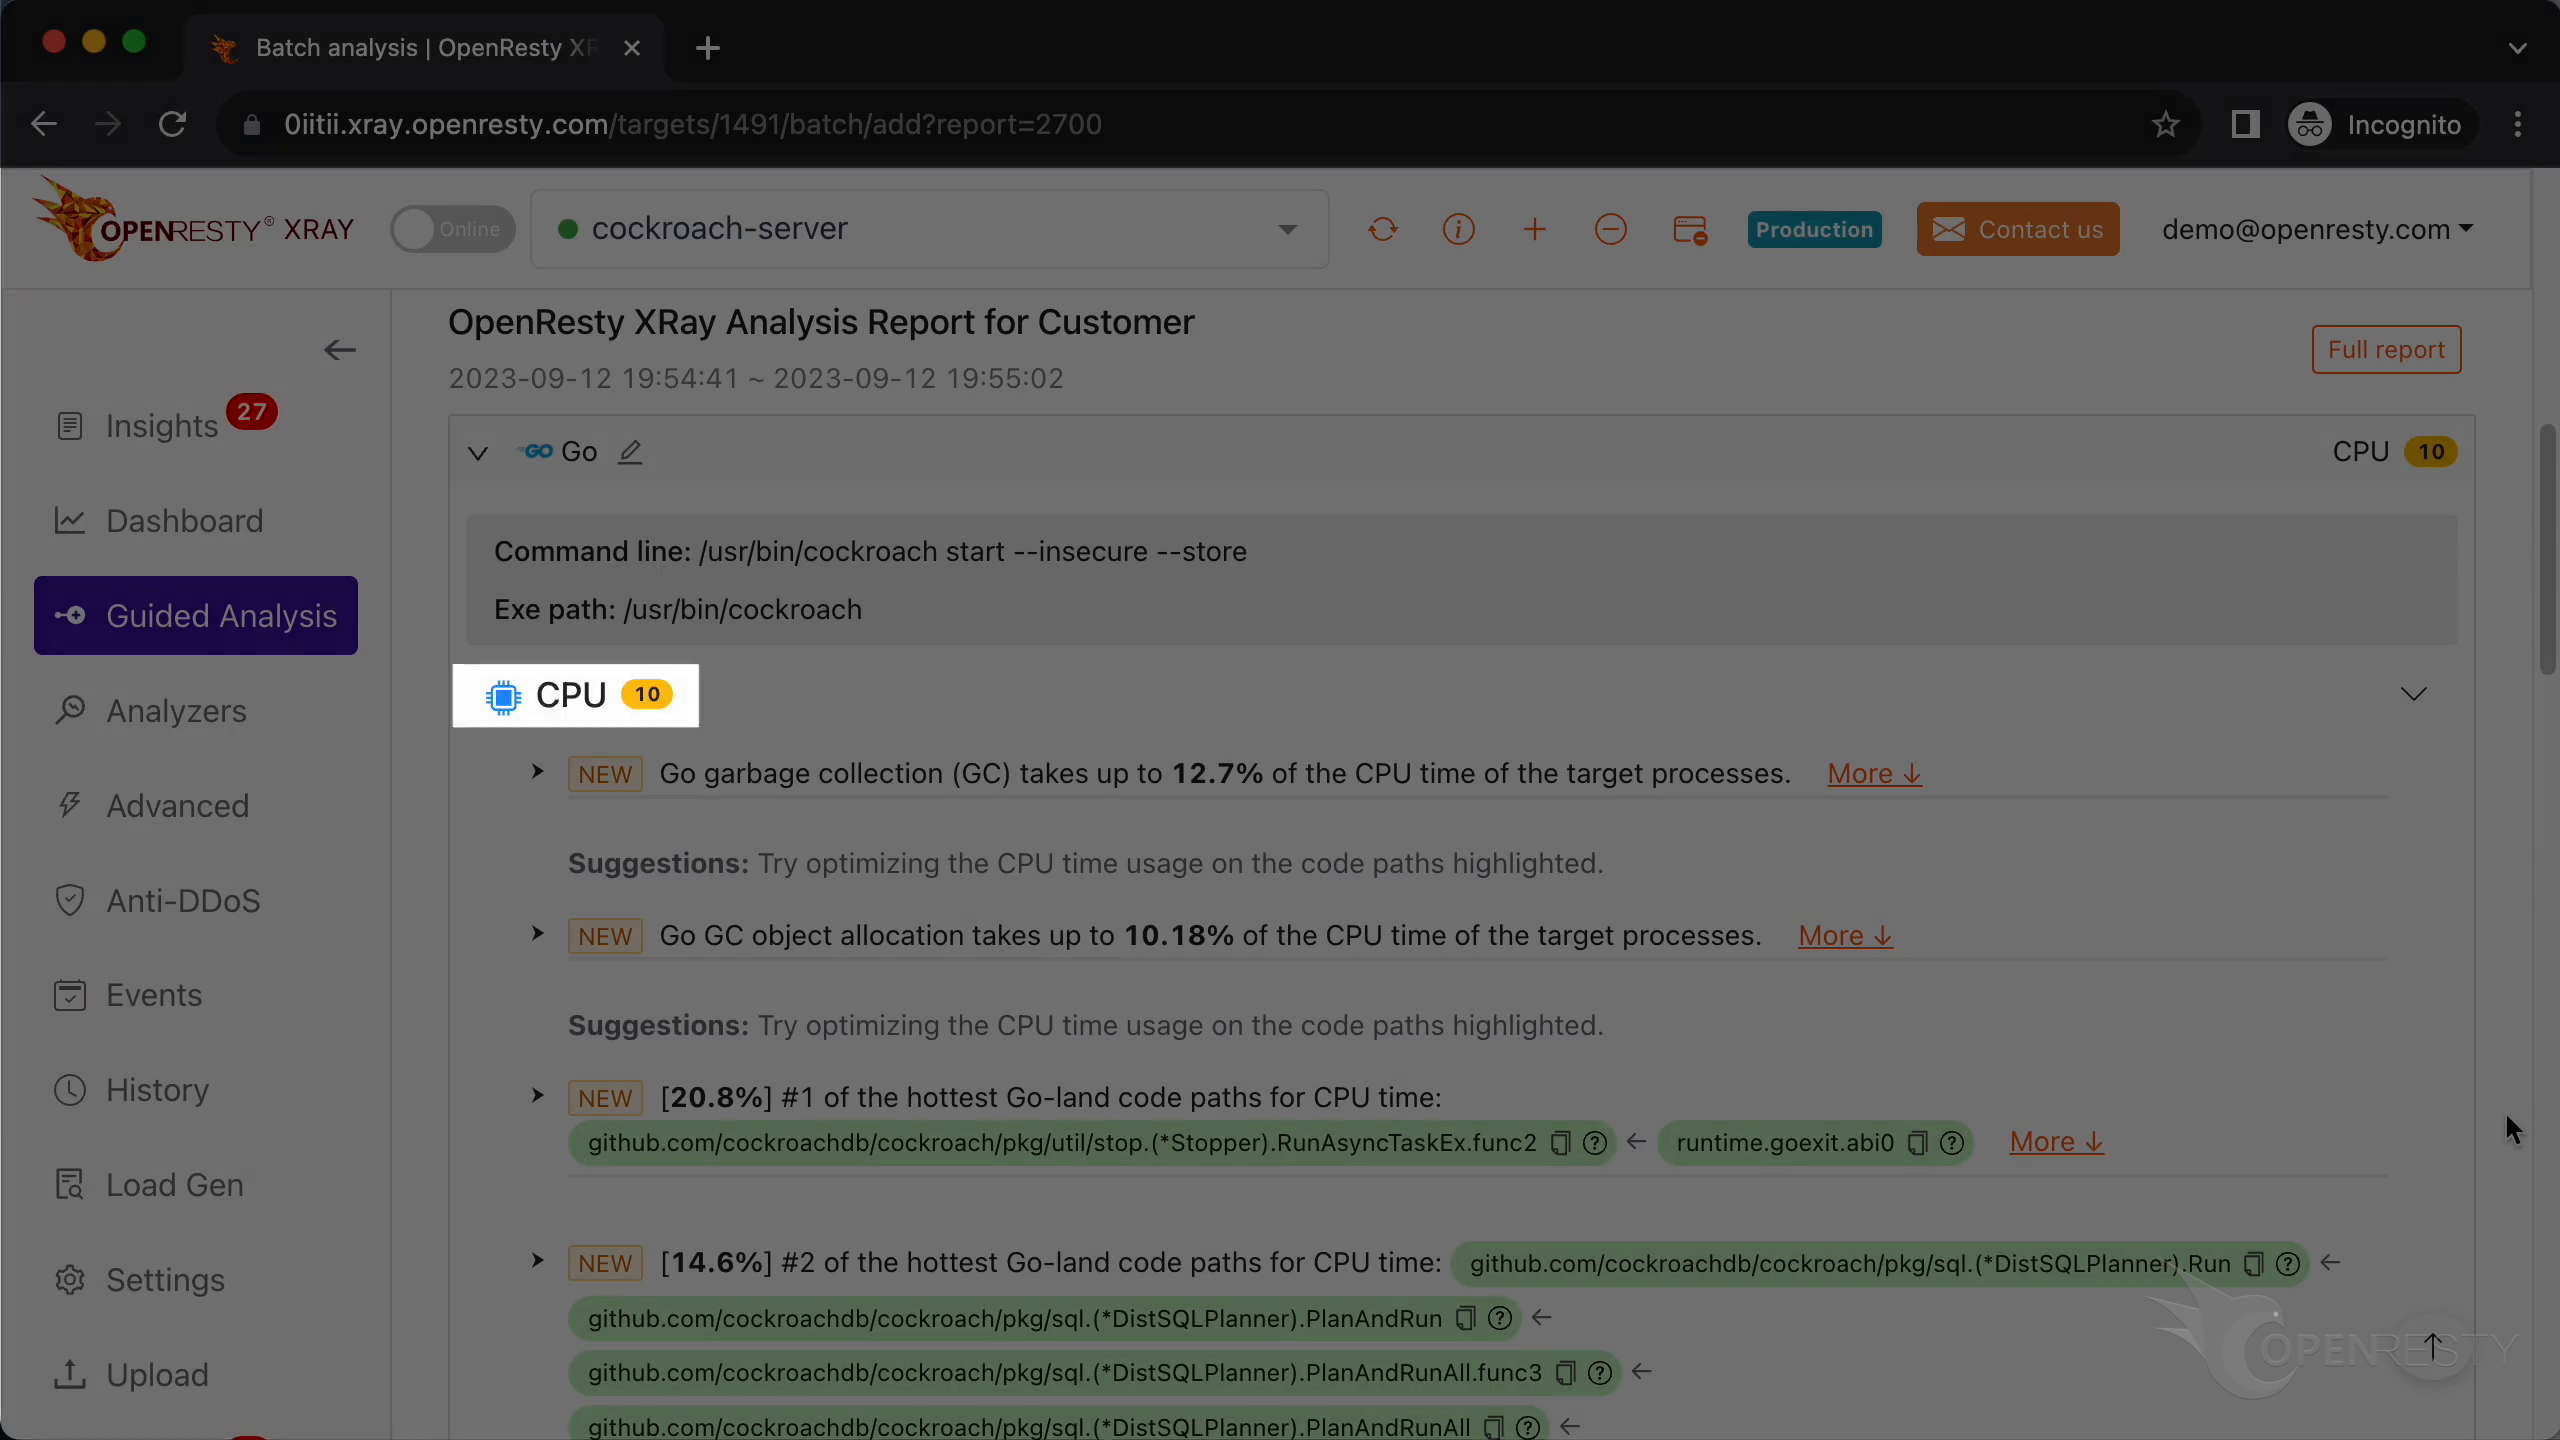
The Go runtime’s garbage collection takes about 13% of CPU time.
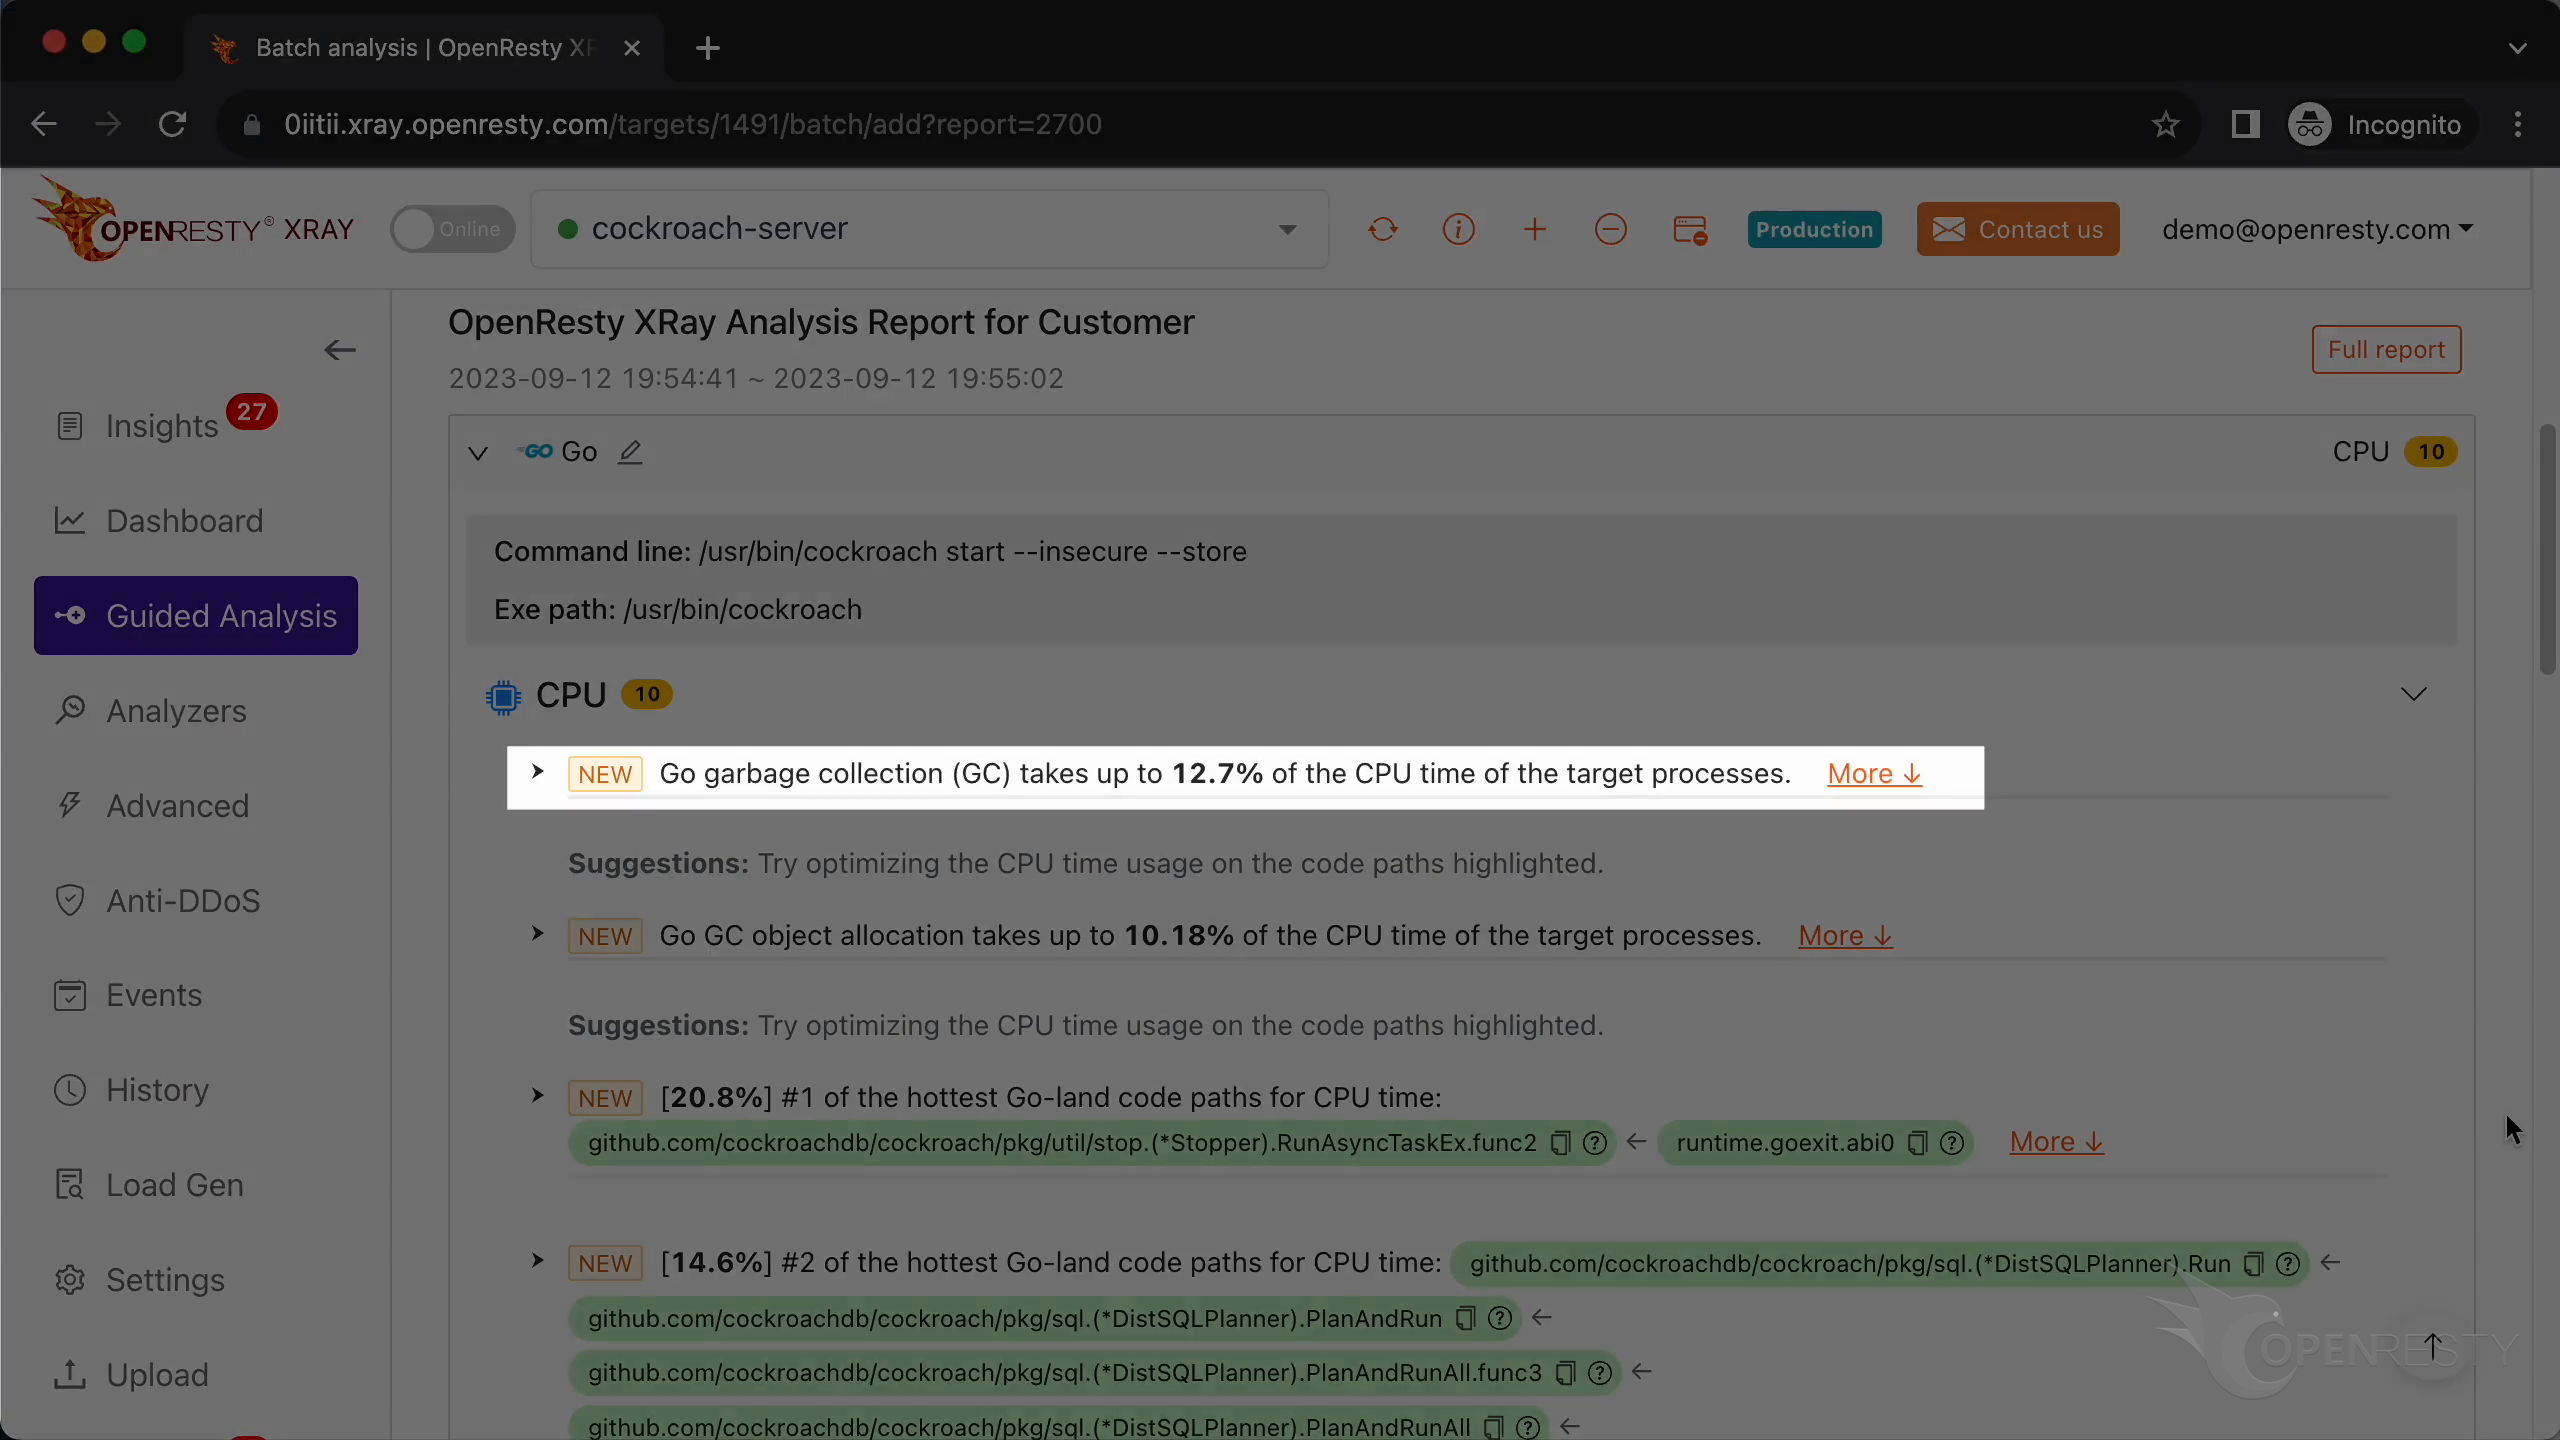
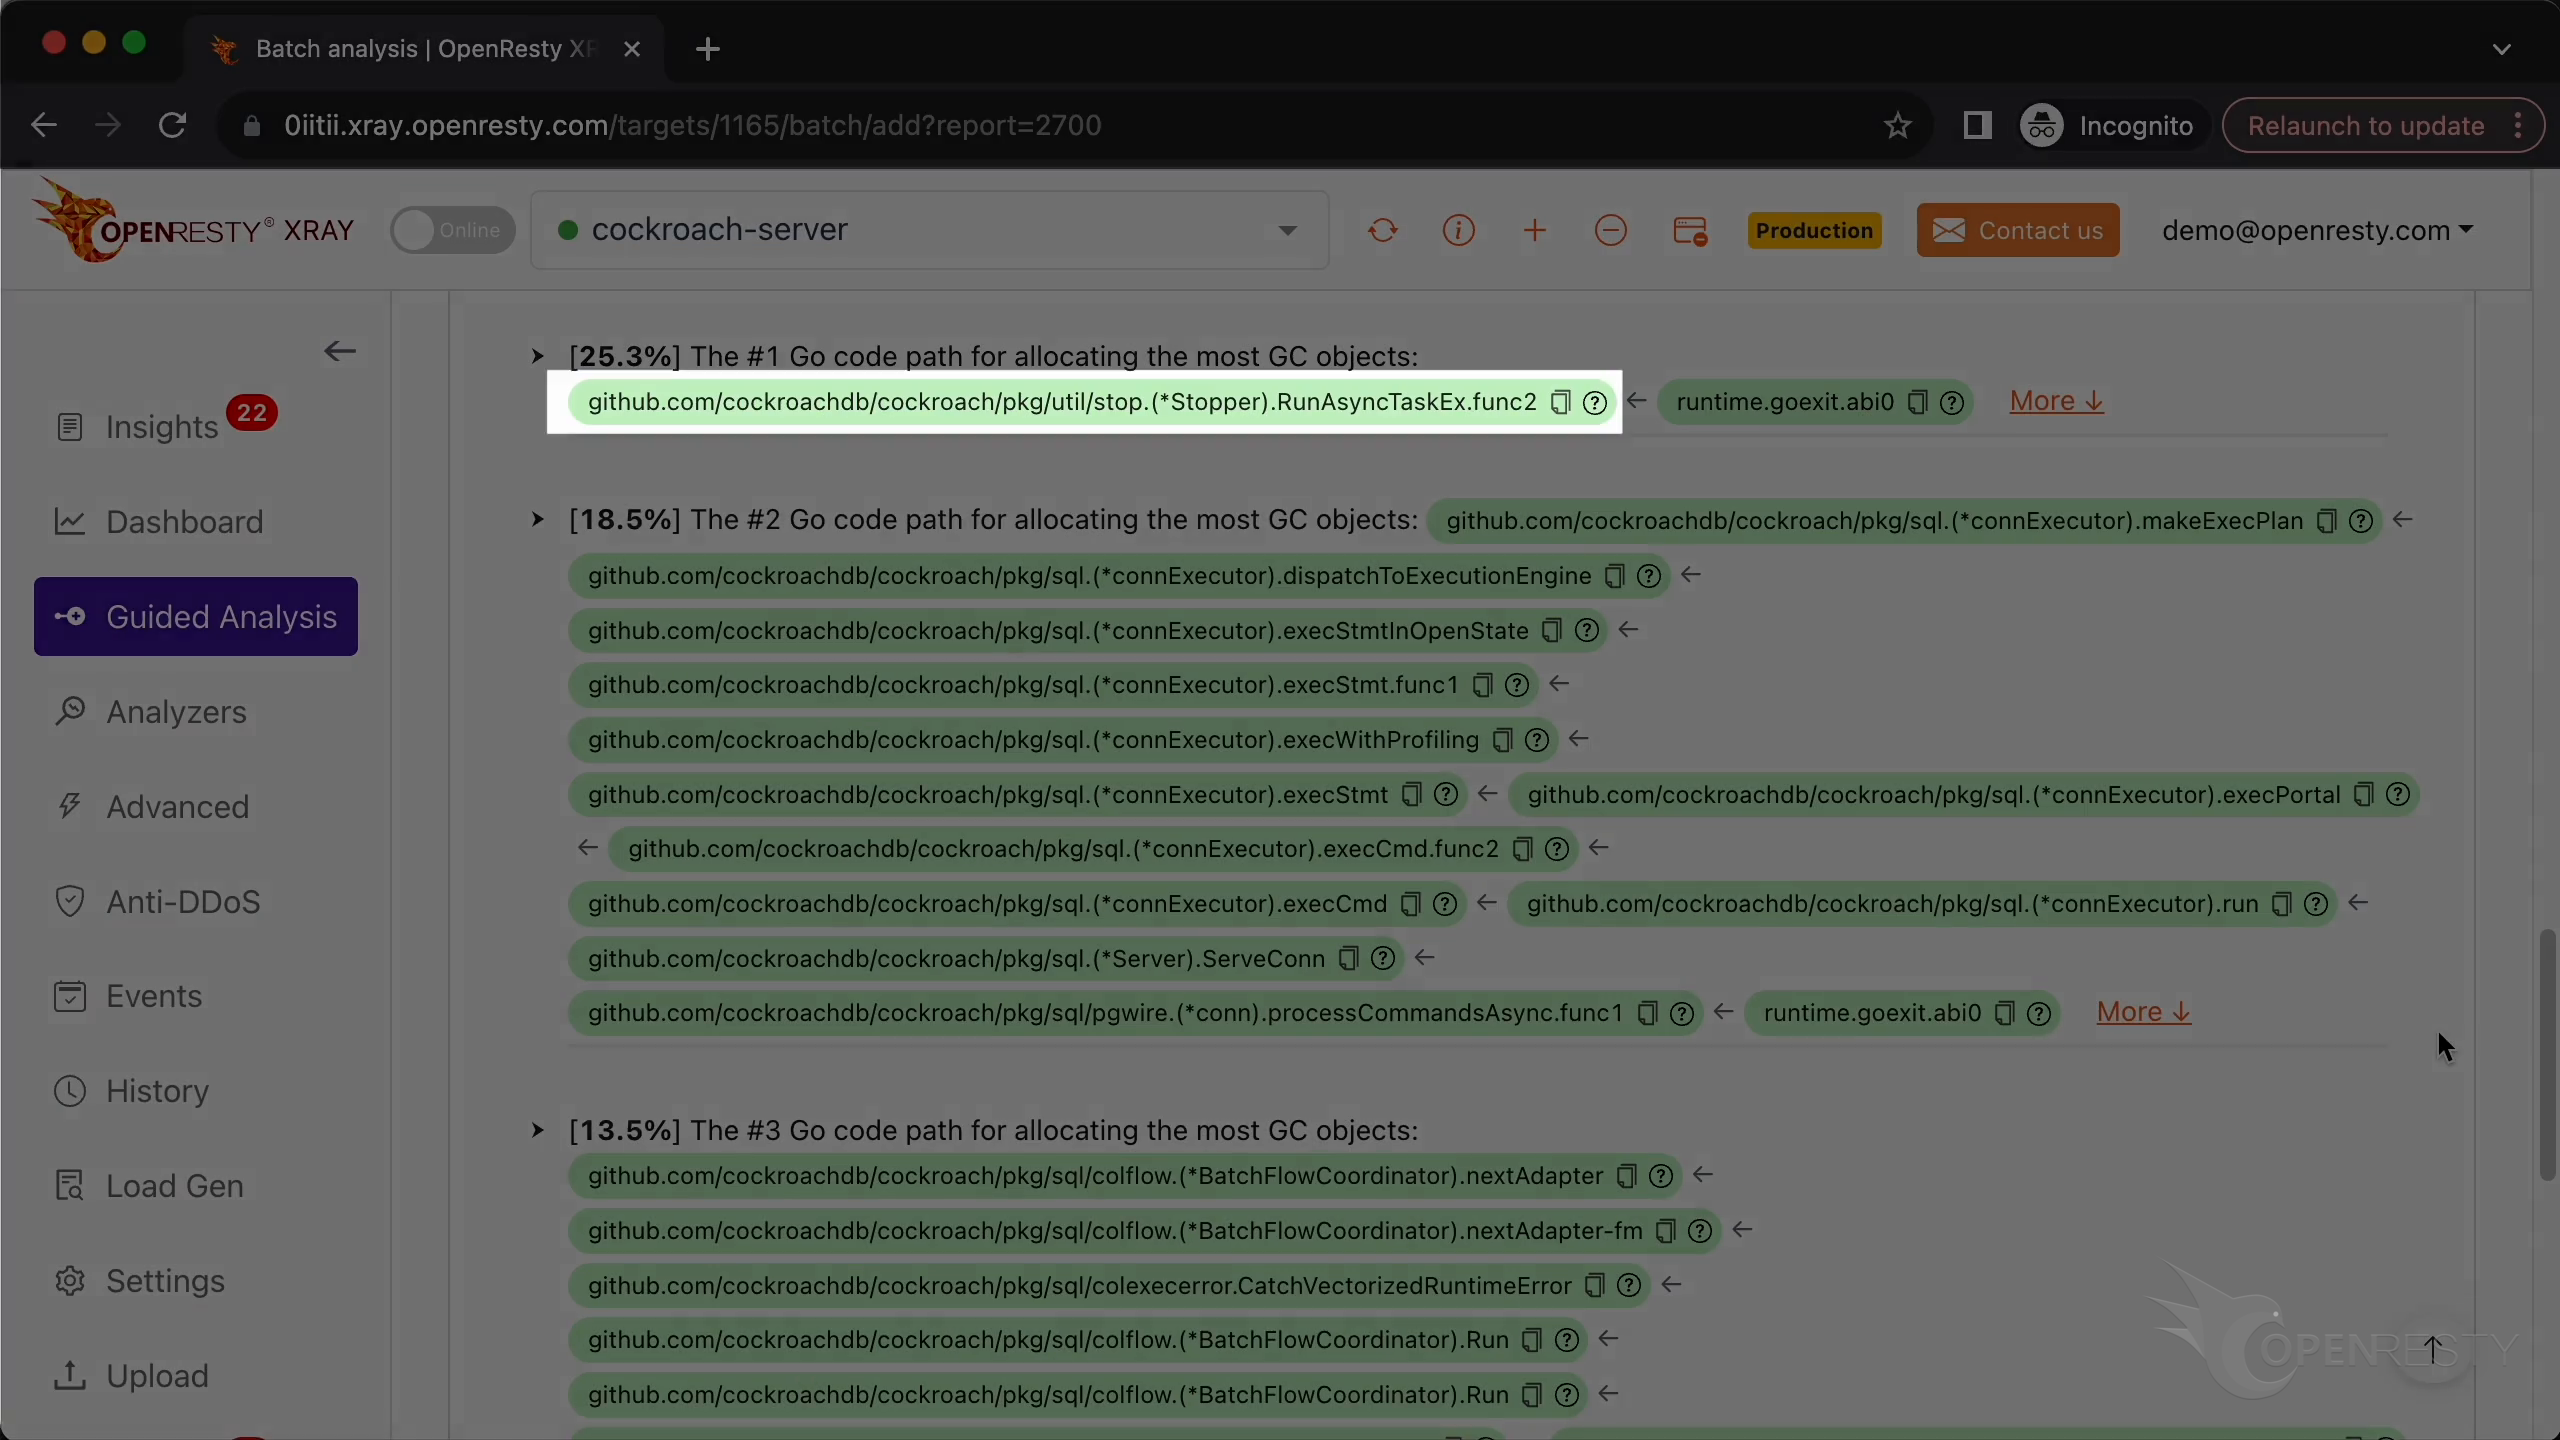
This Go code path created about 25% of the total number of new GC objects created.
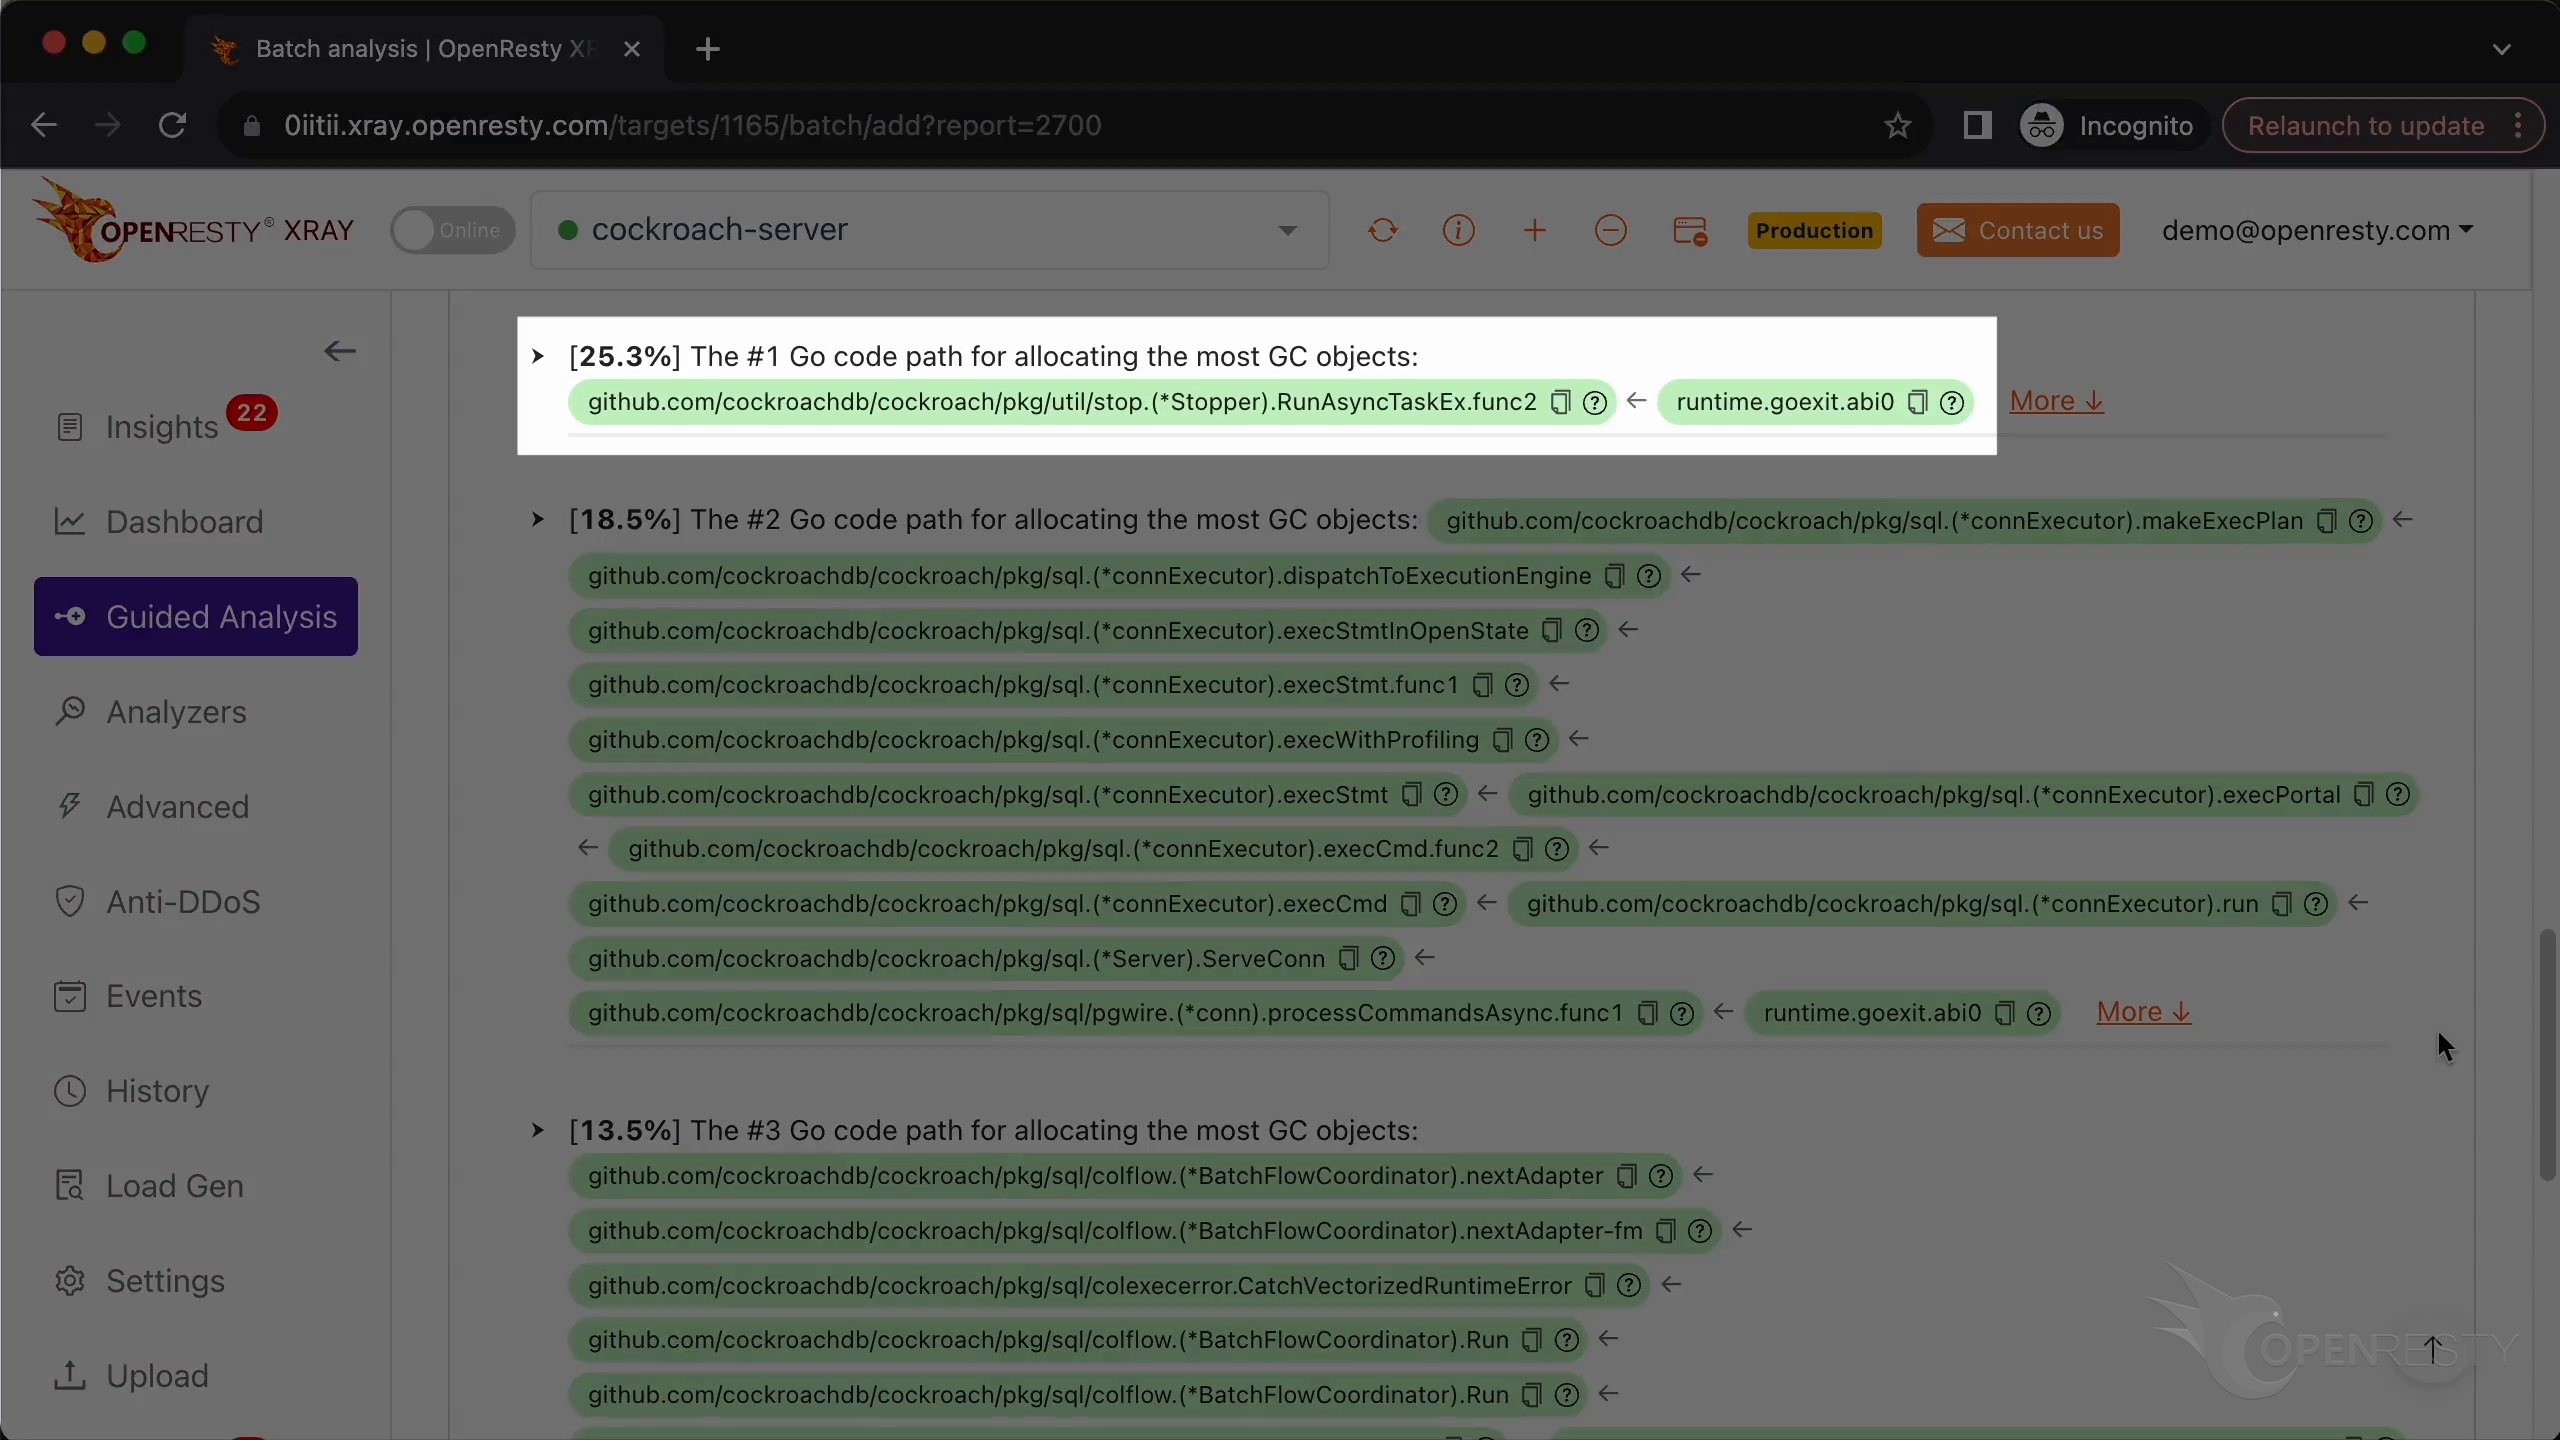
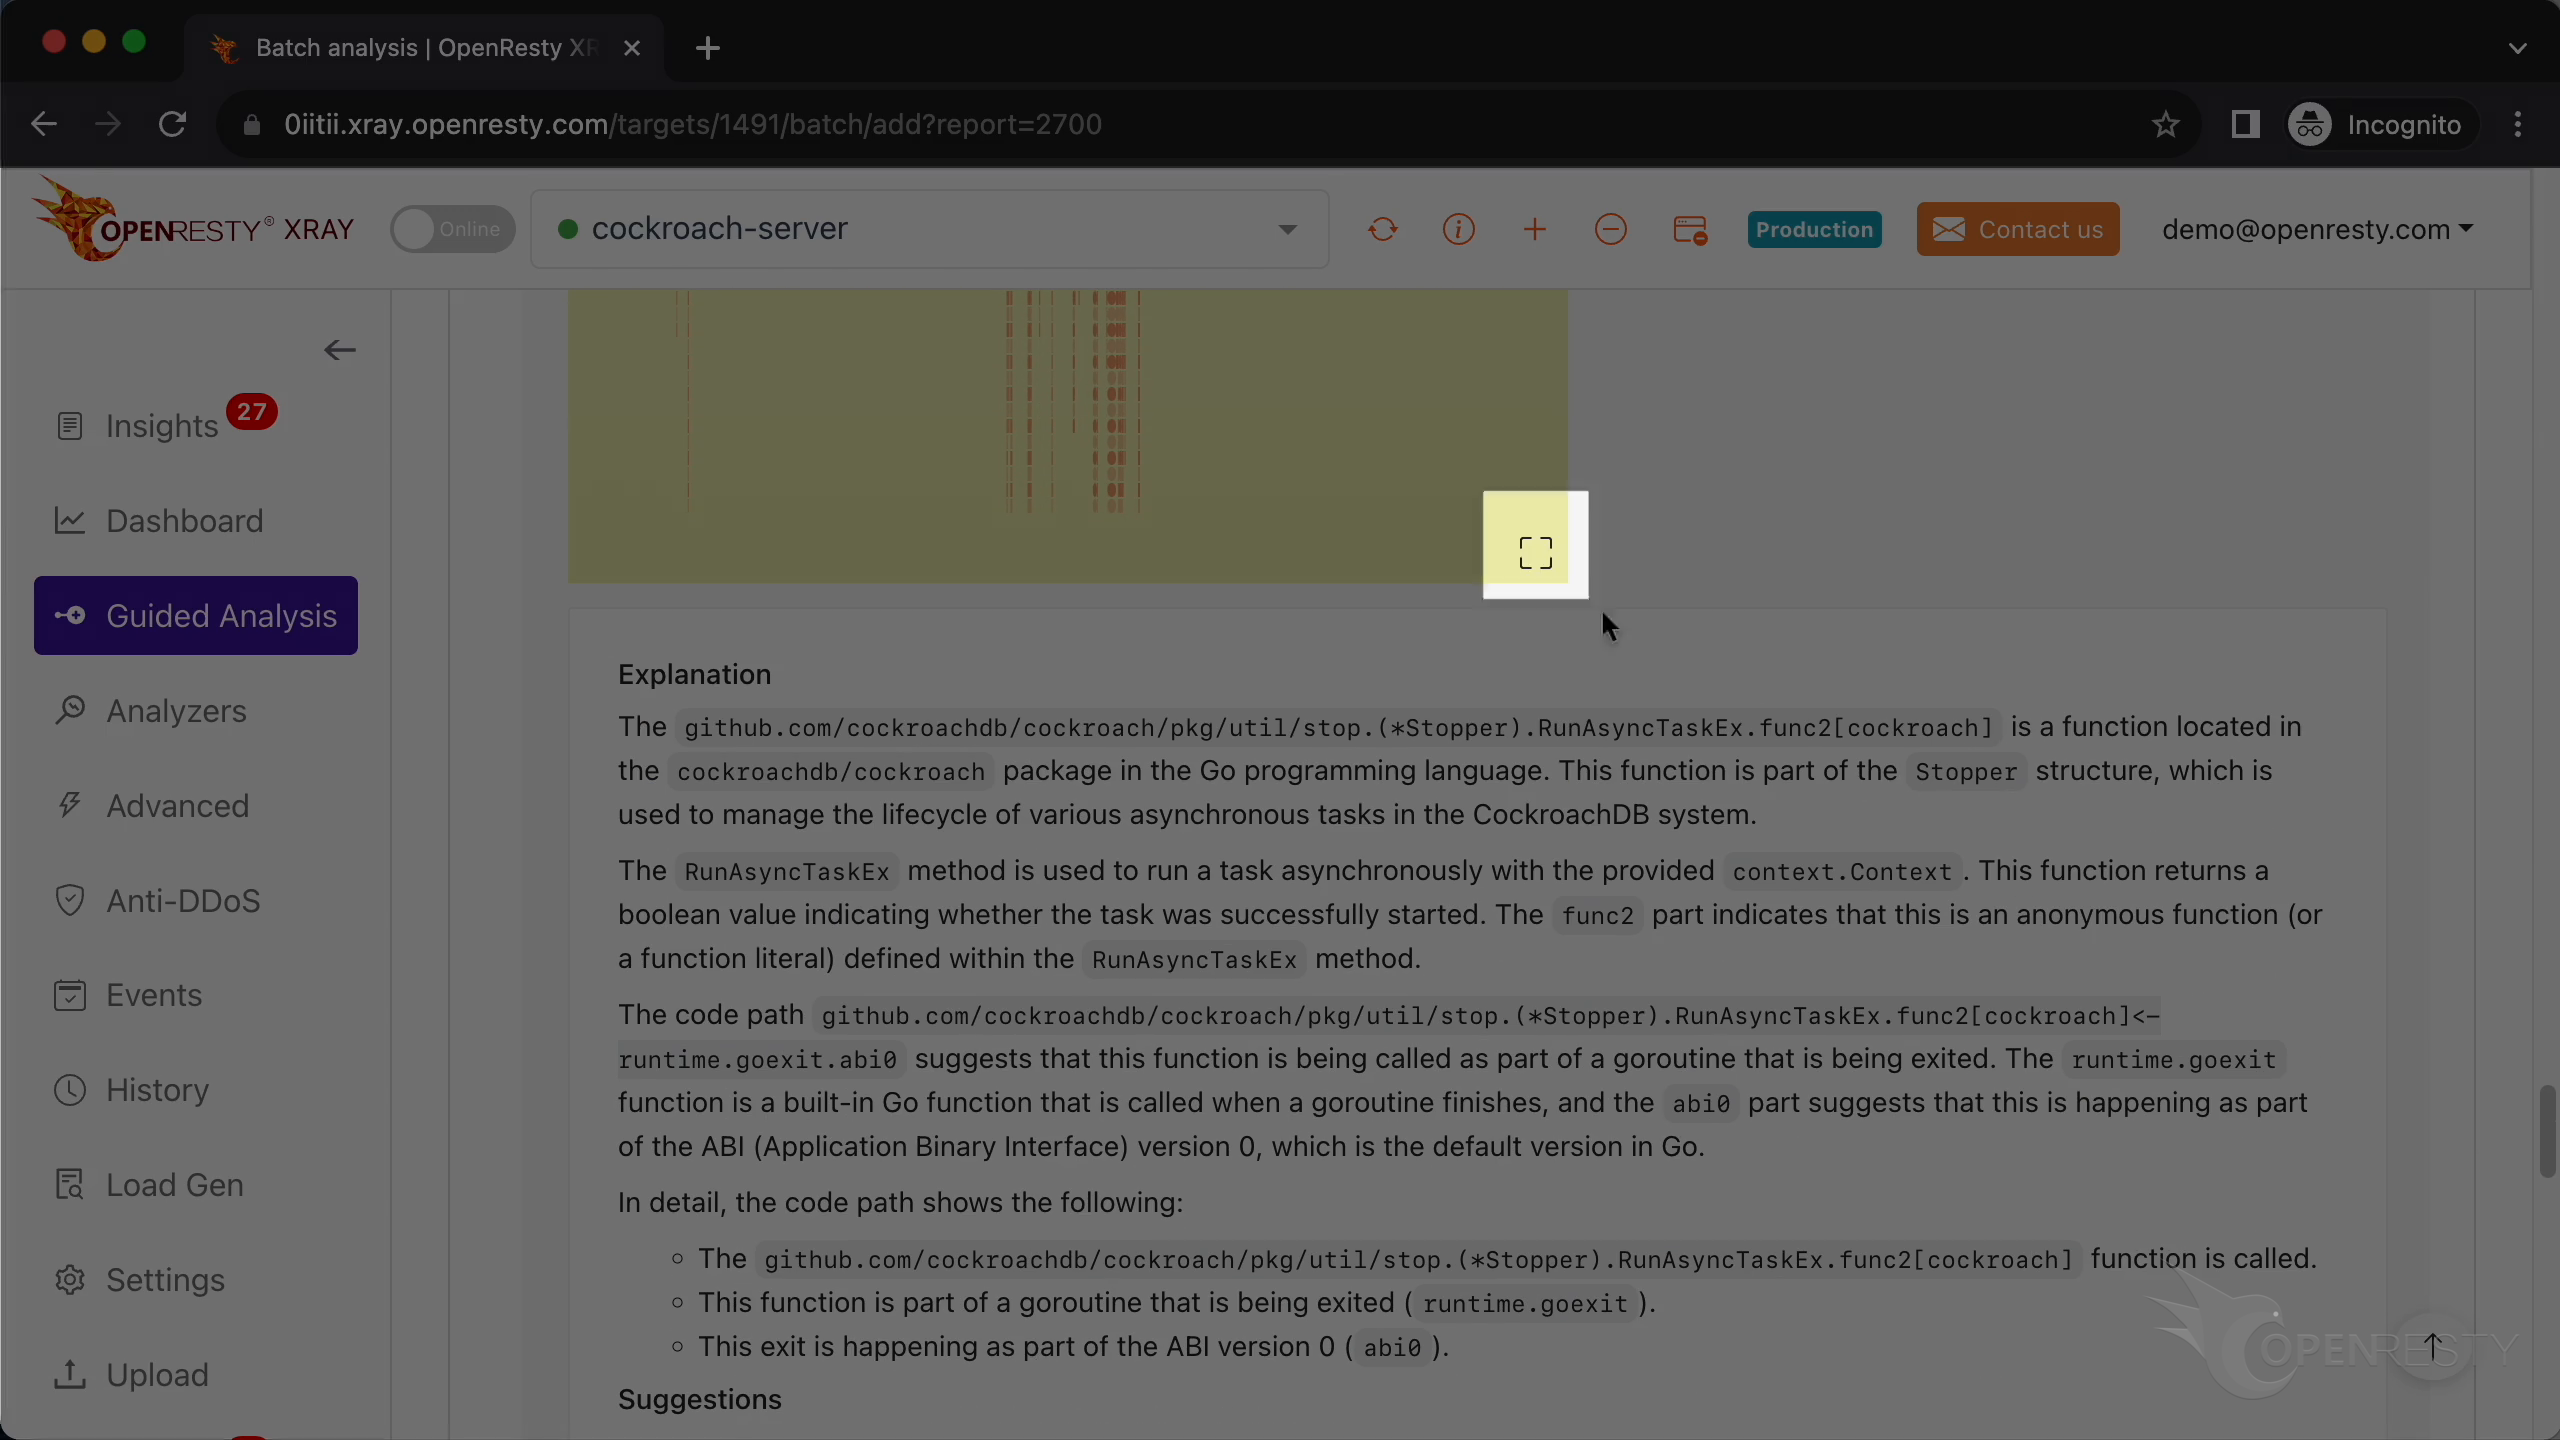
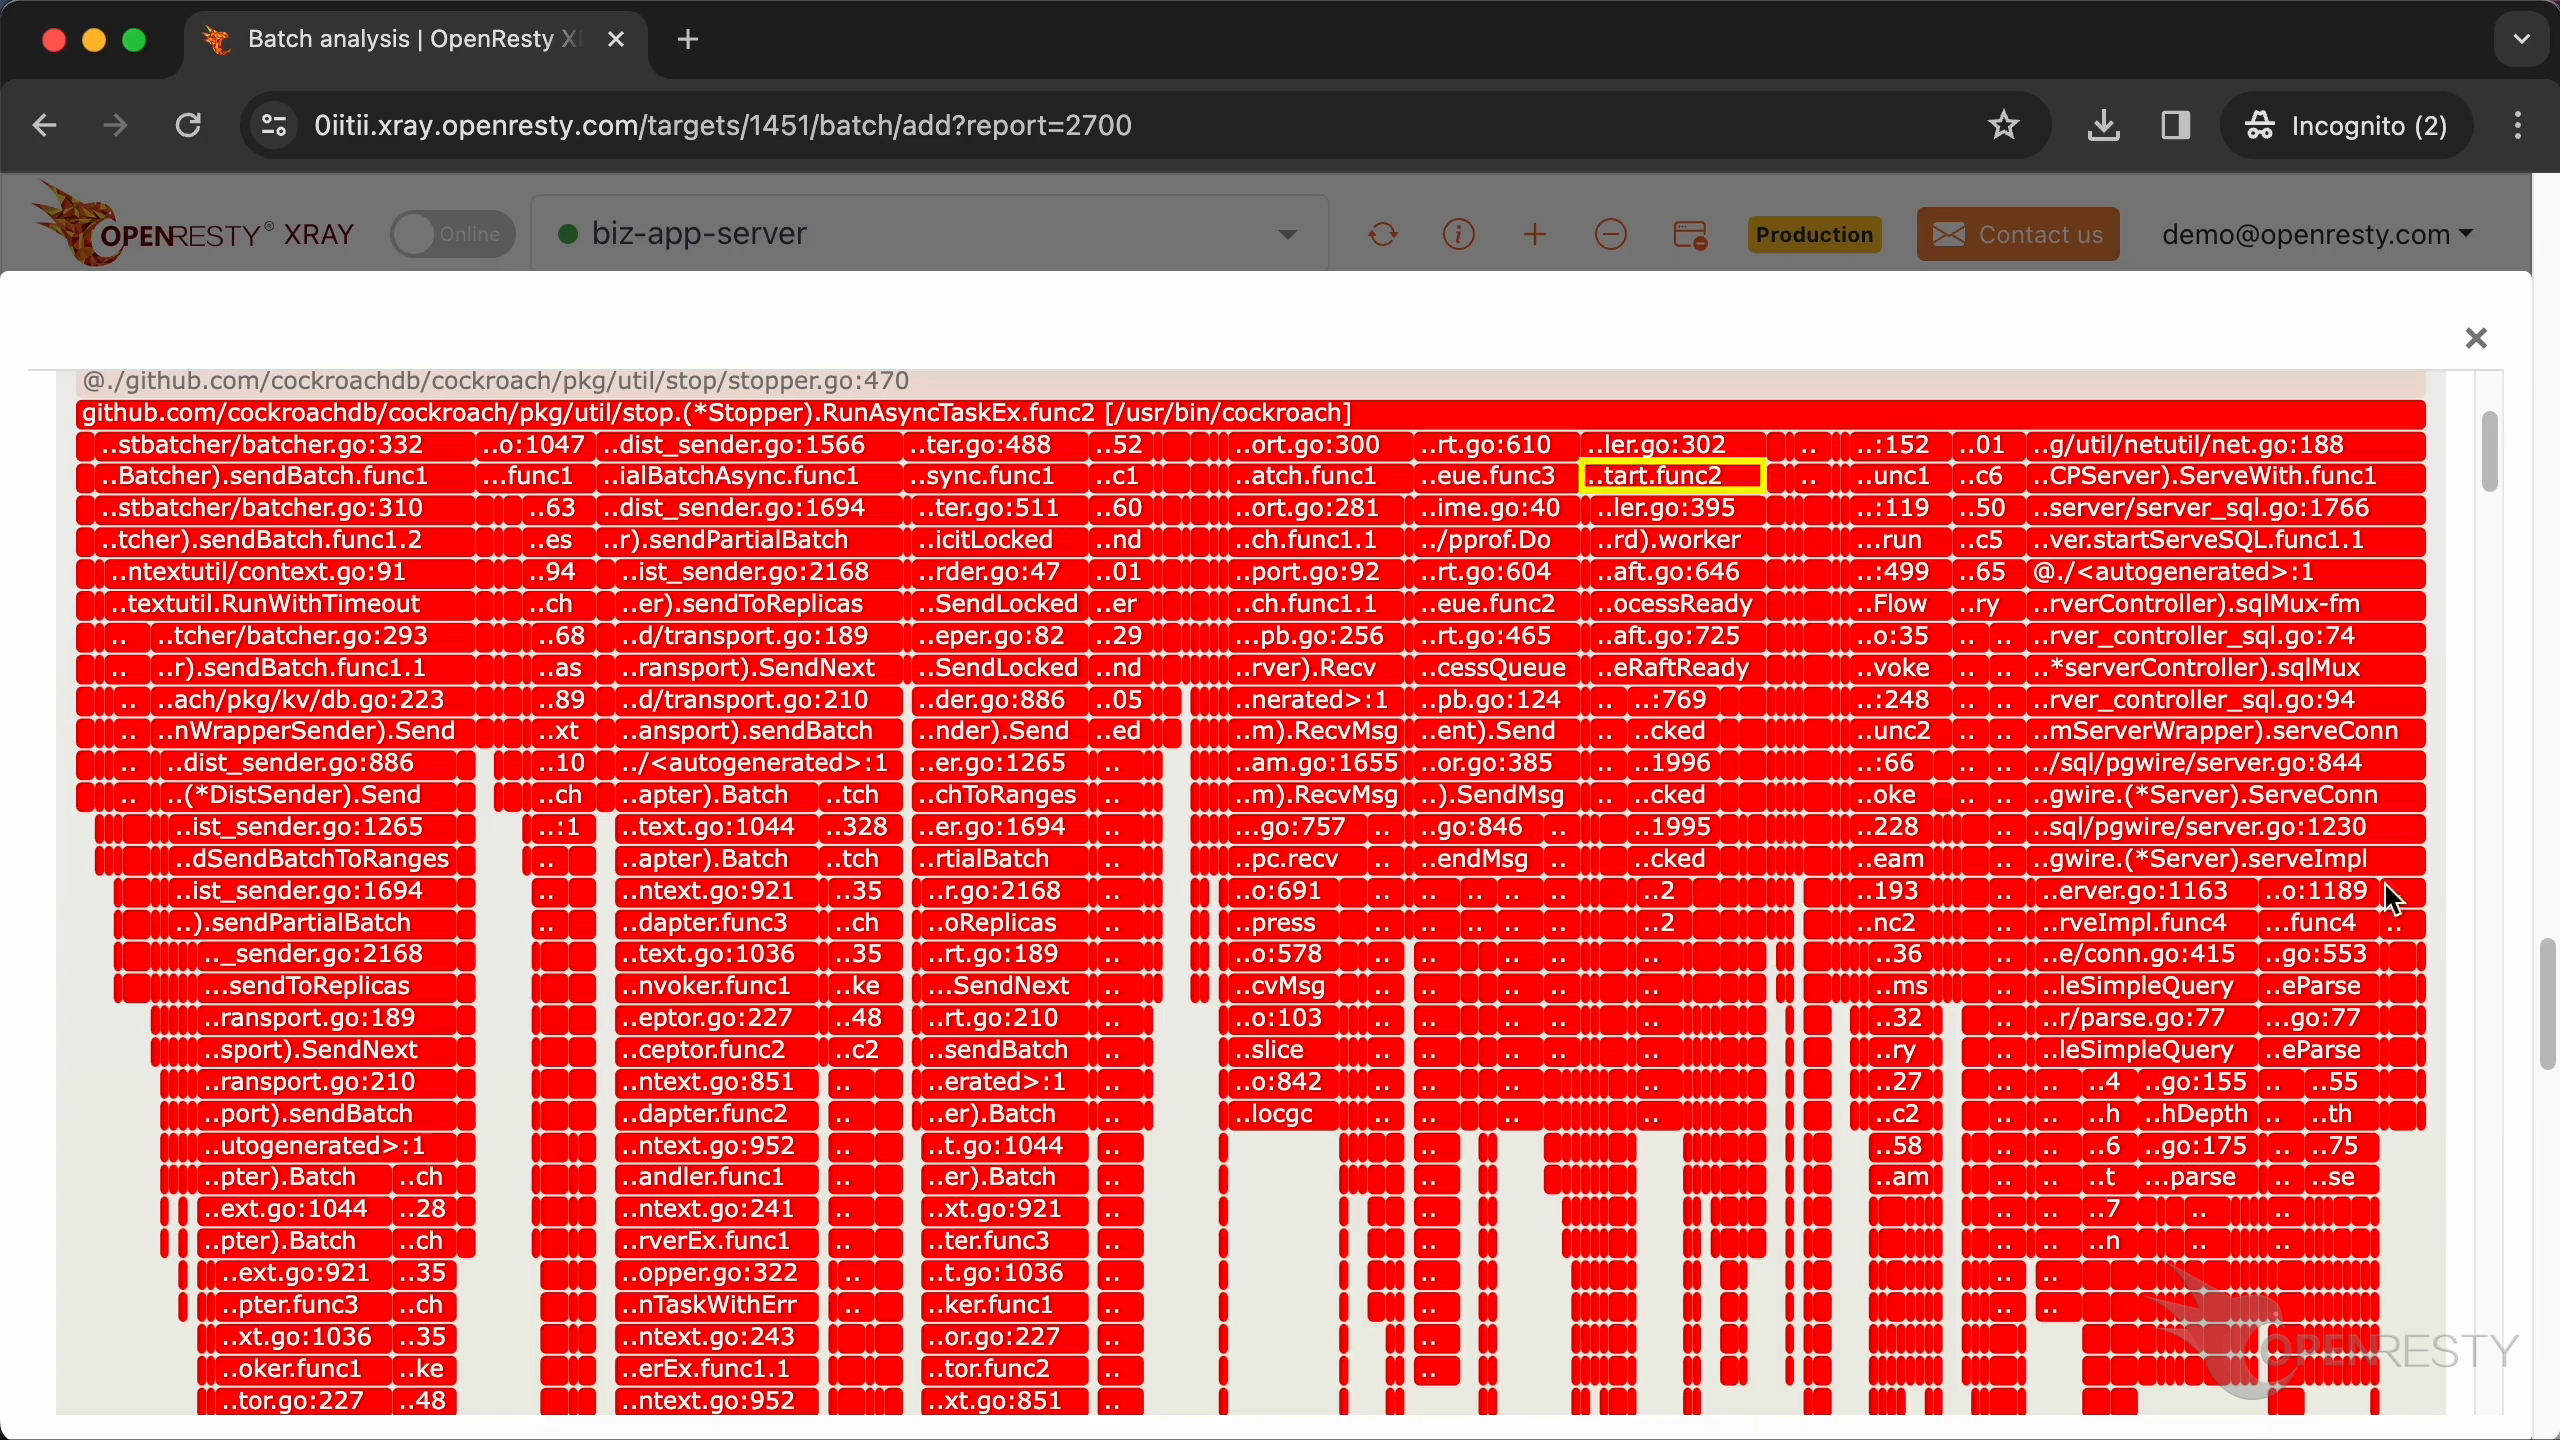
Currently executing is an anonymous function created in the function RunAsyncTaskEx. It’s used to manage the lifecycle of various asynchronous tasks in the CockroachDB system.
Click to see more details.
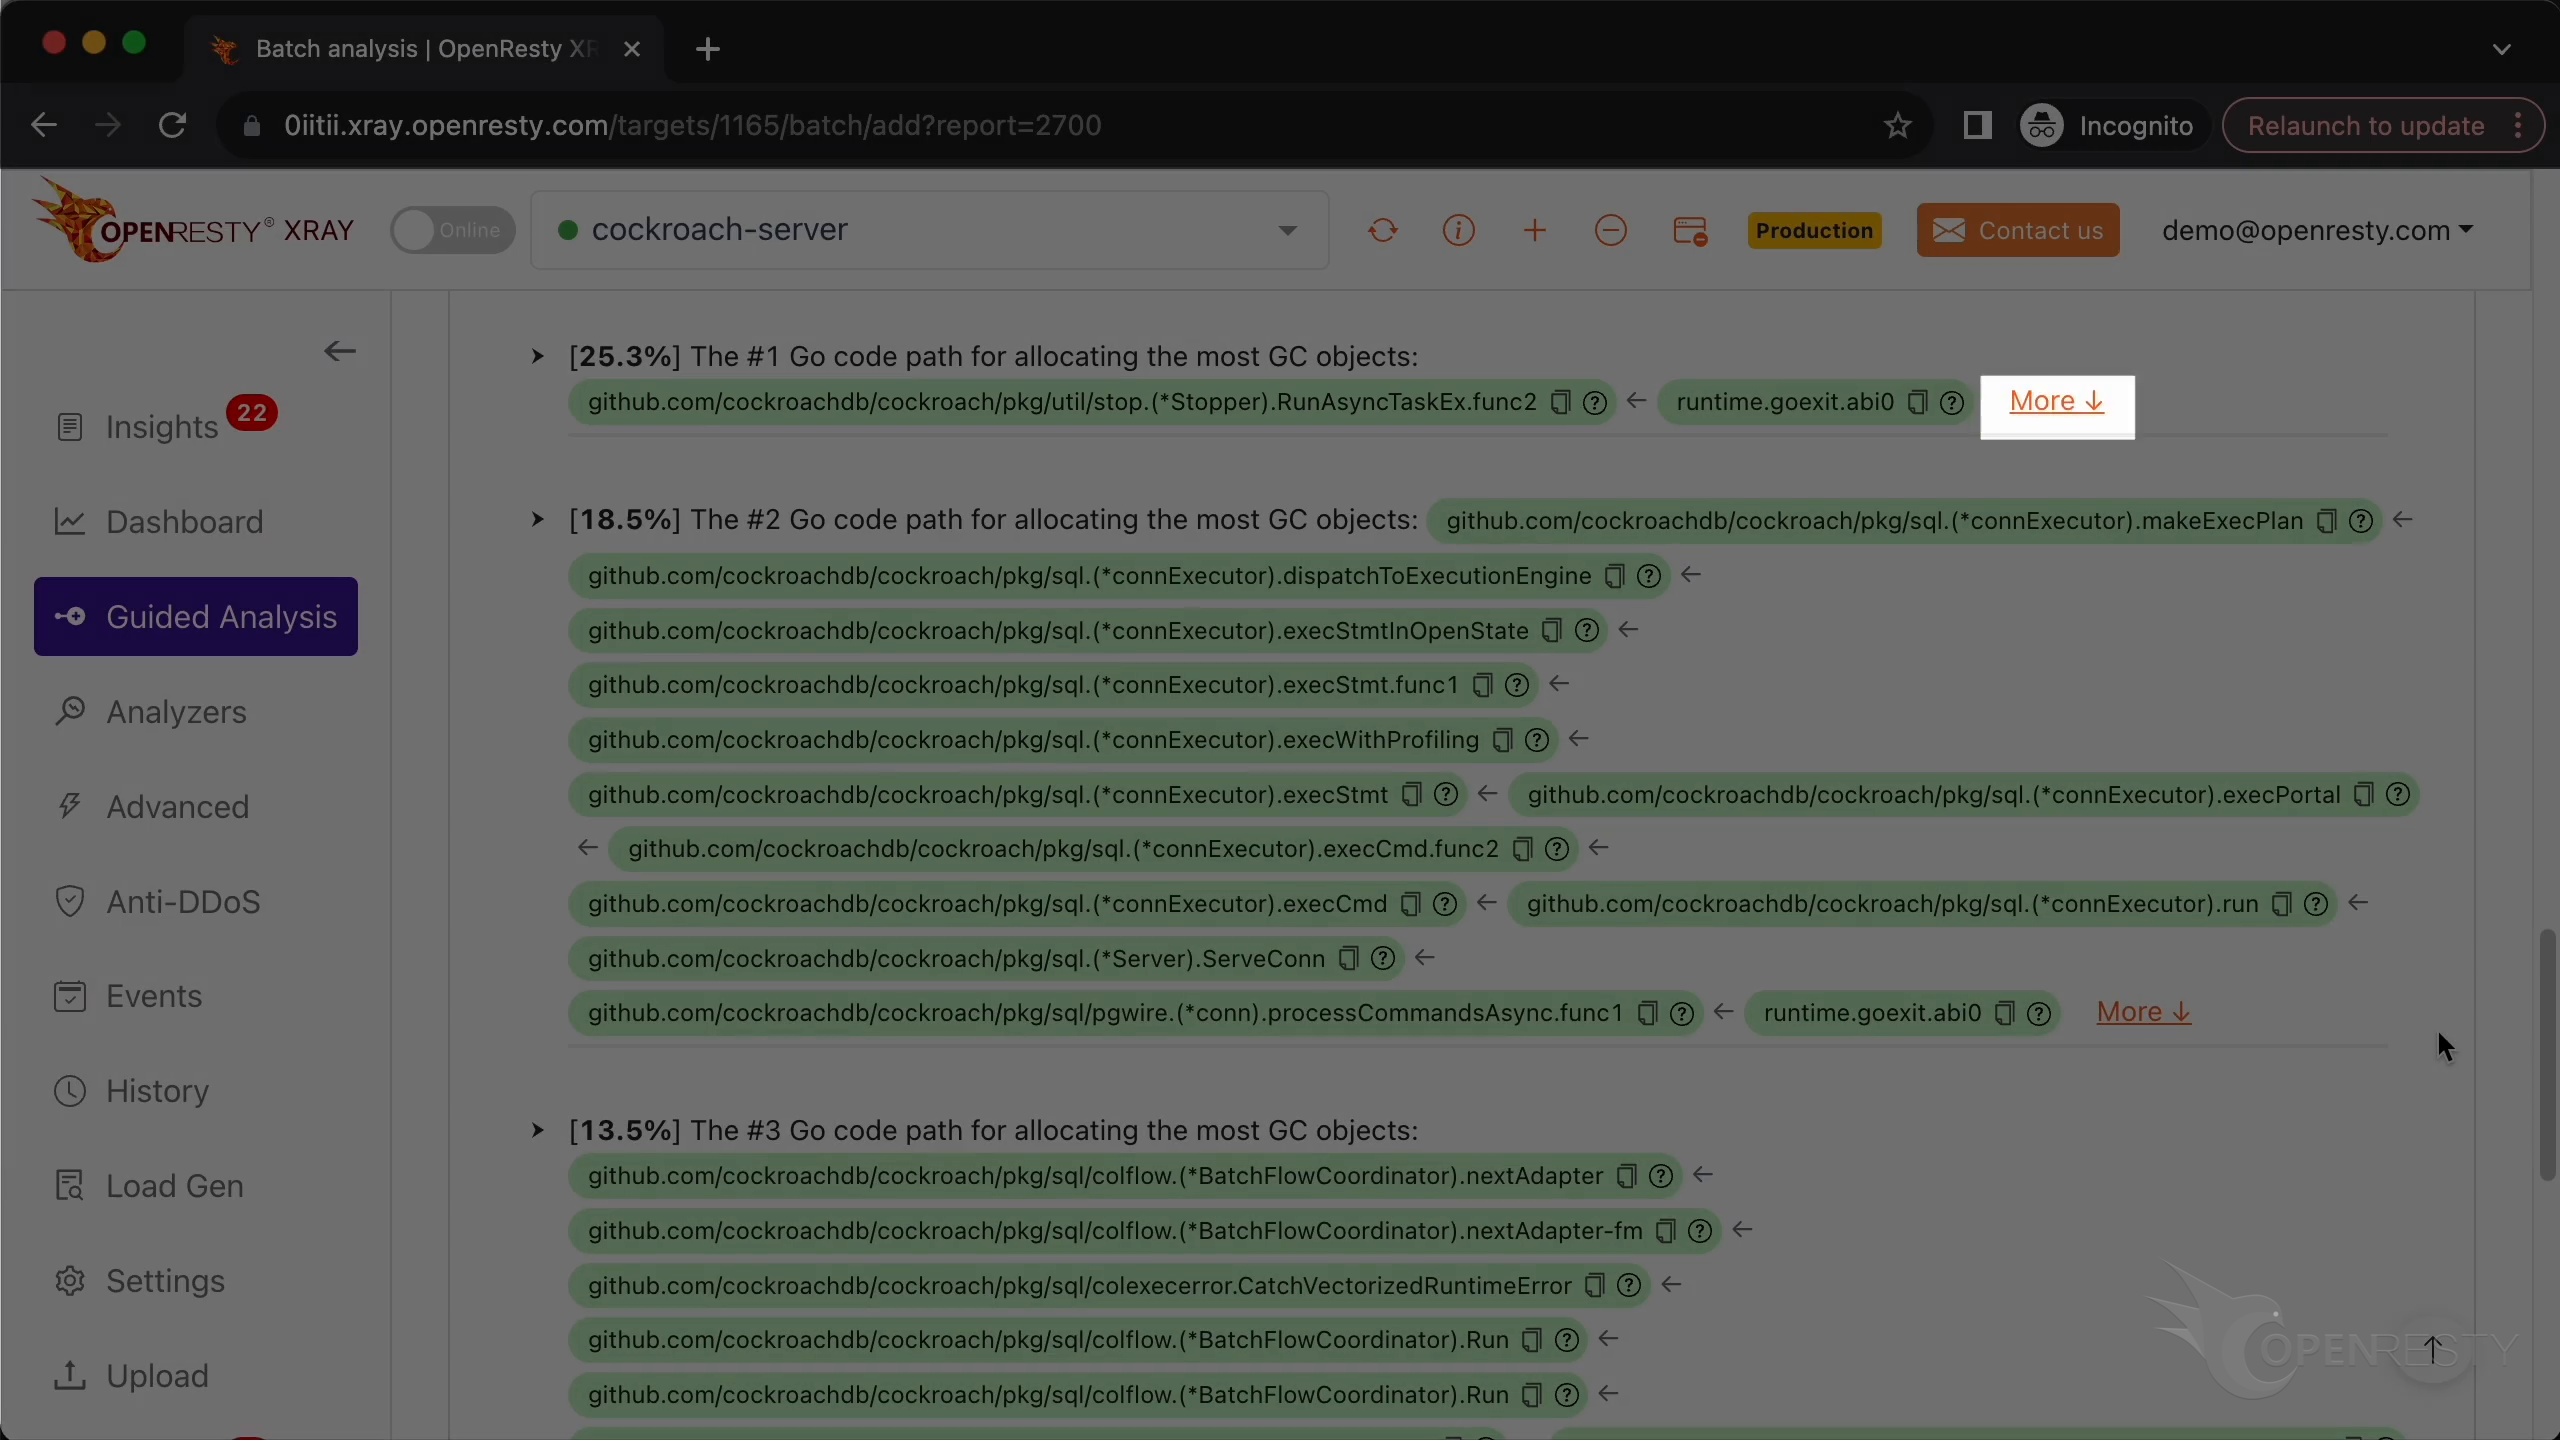
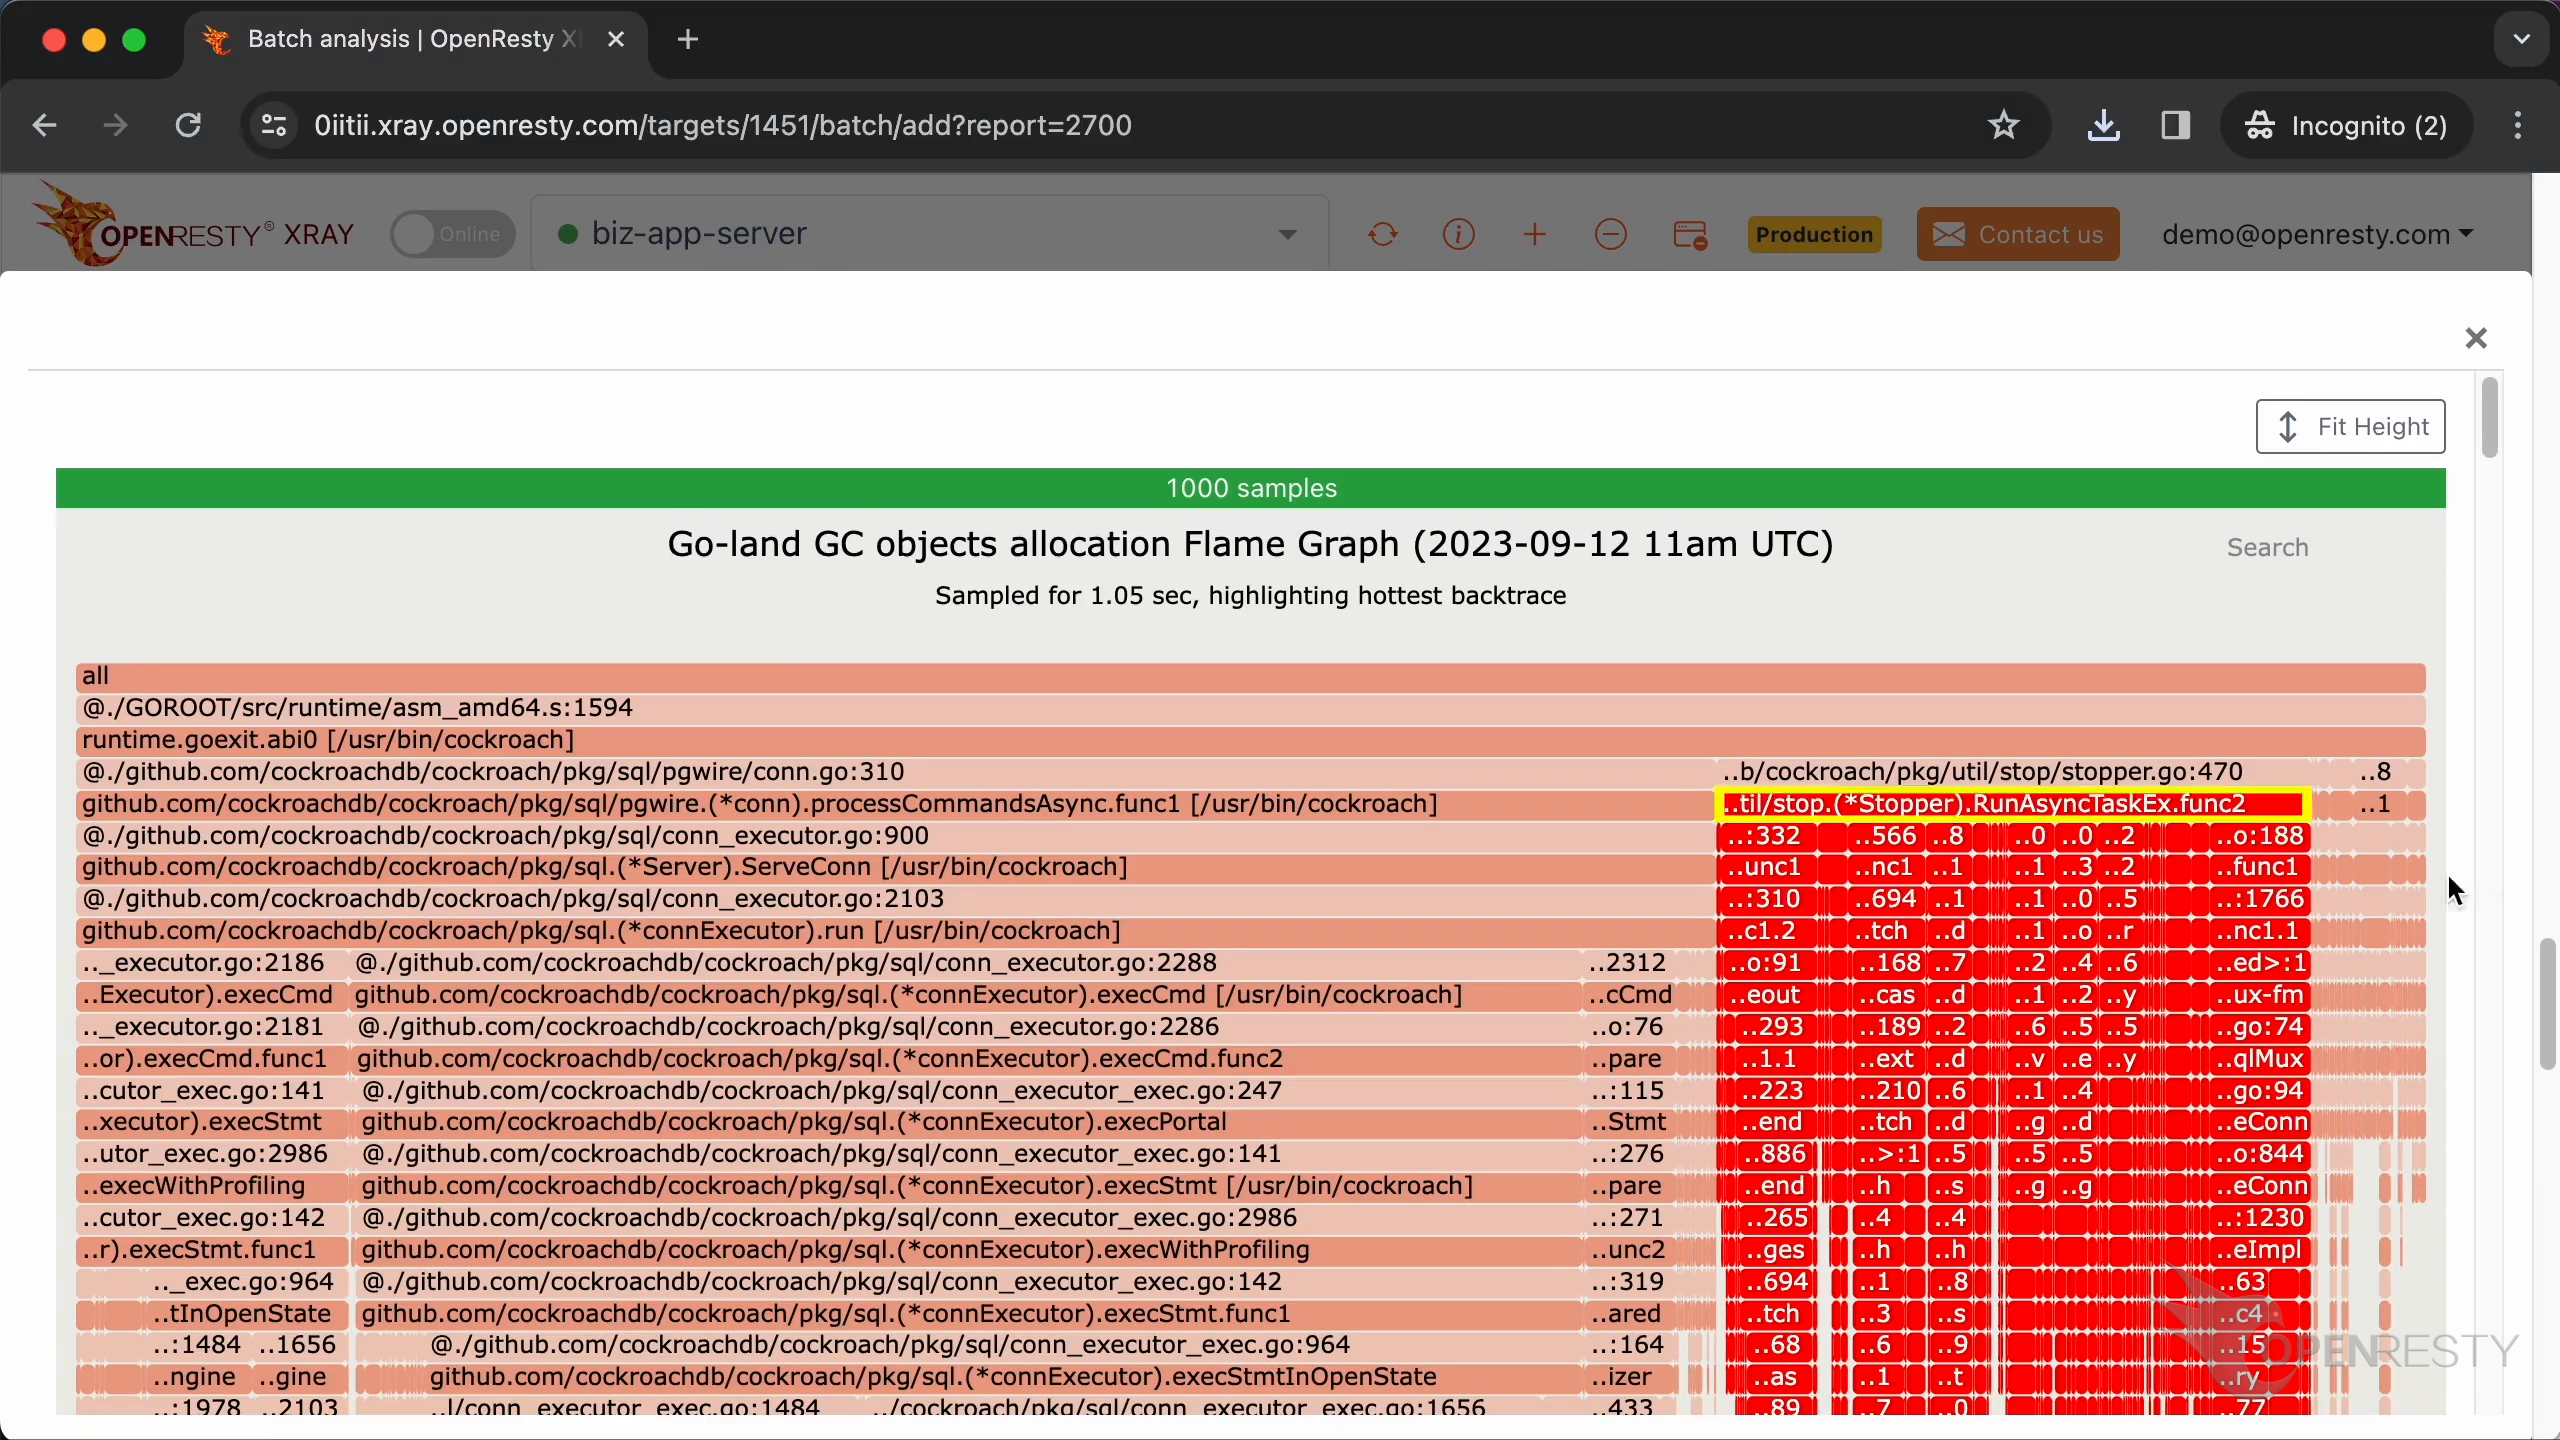
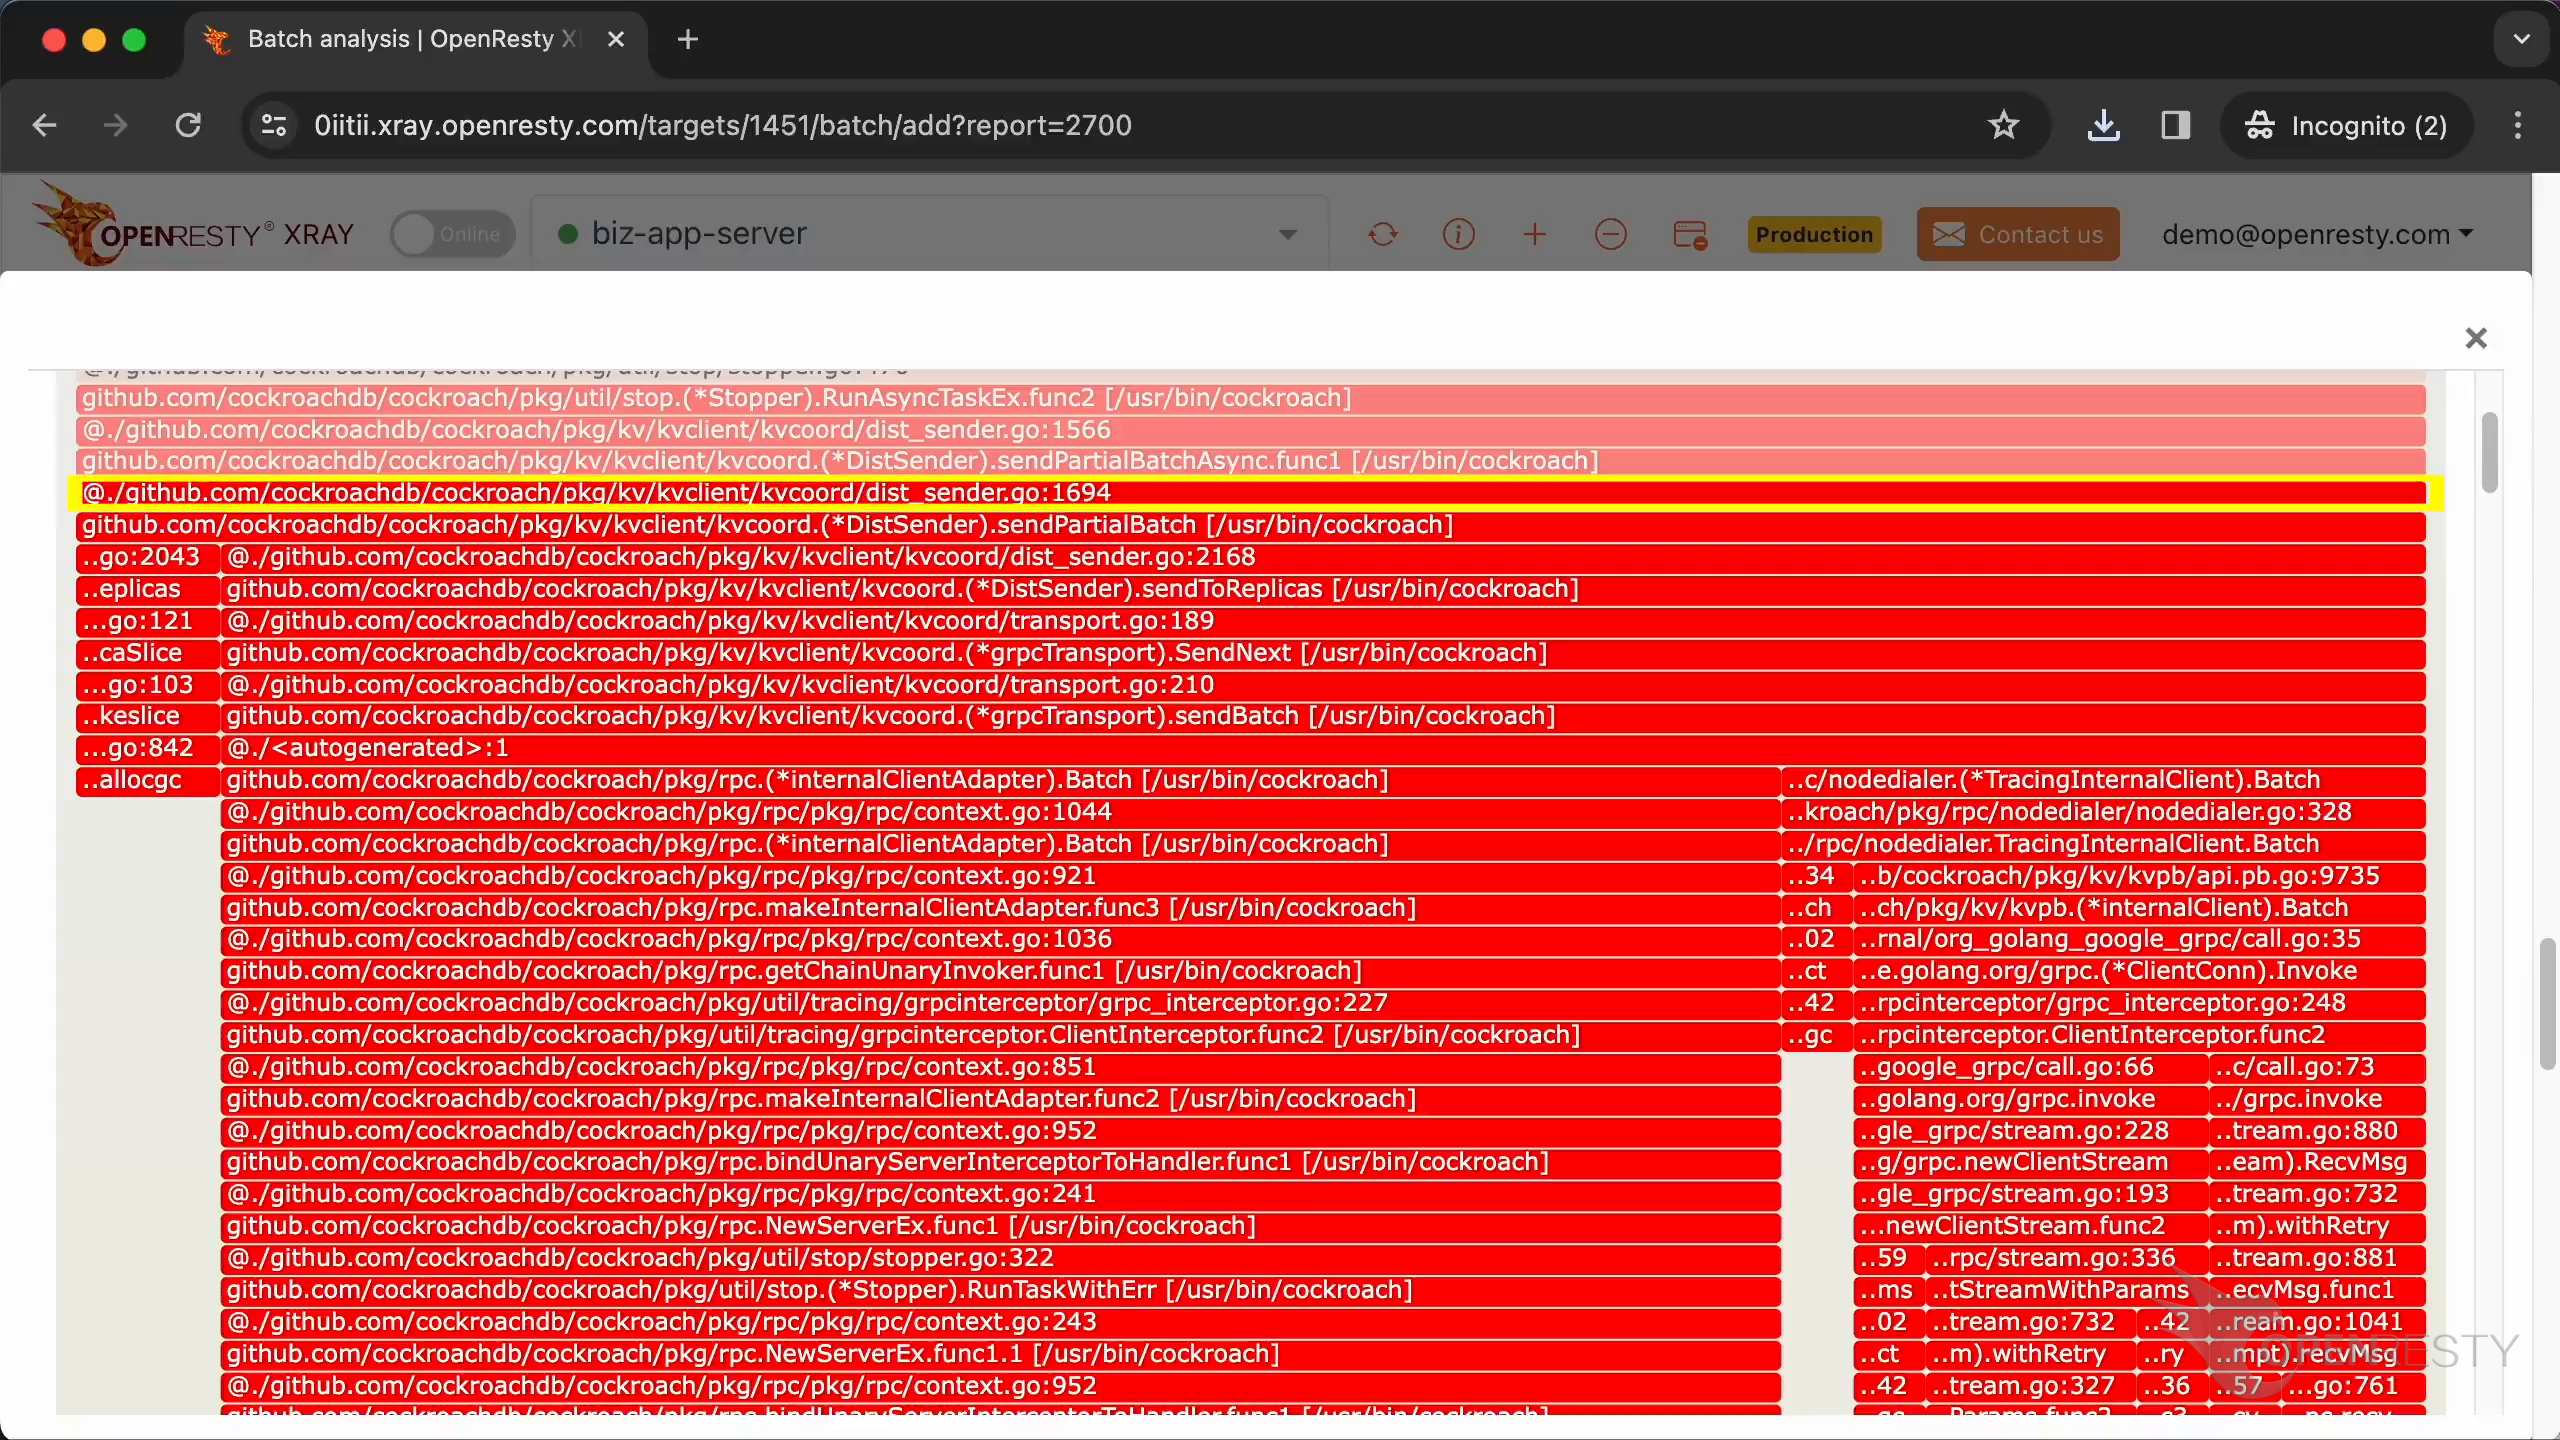
This hot code path is automatically inferred from this Go-land GC objects allocation flame graph.
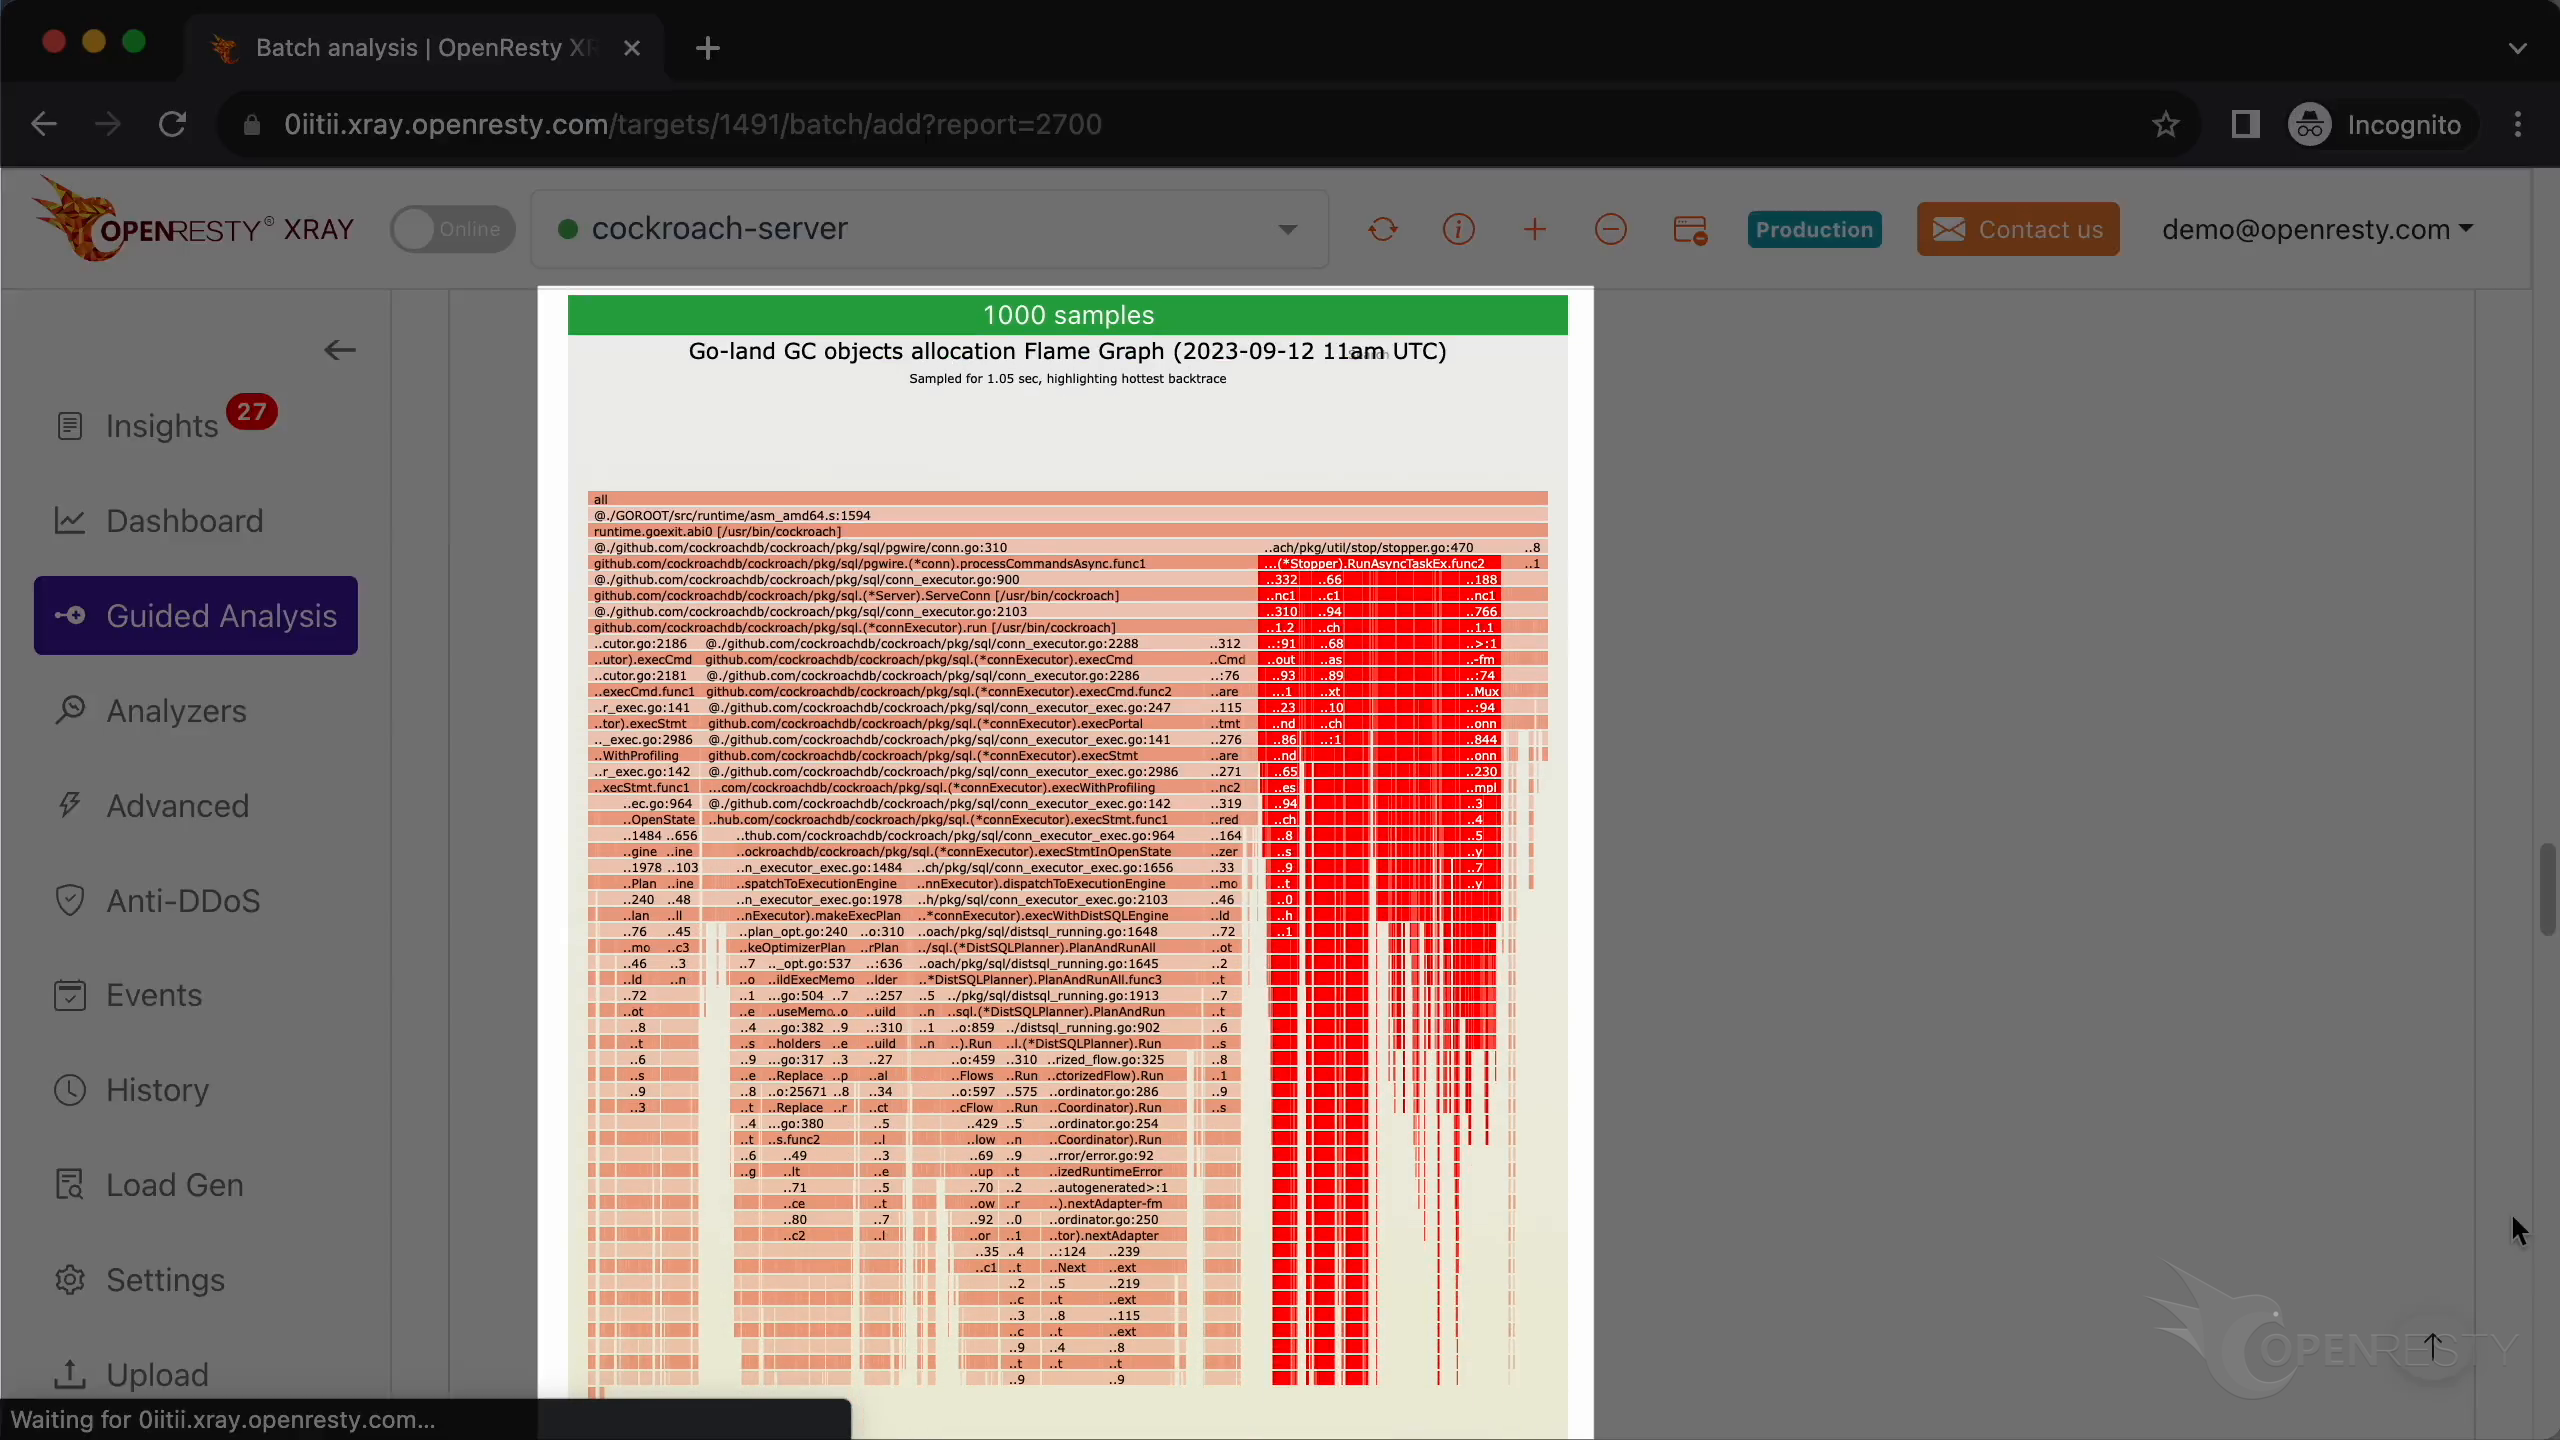
Let’s enlarge it.
Continue to zoom in.
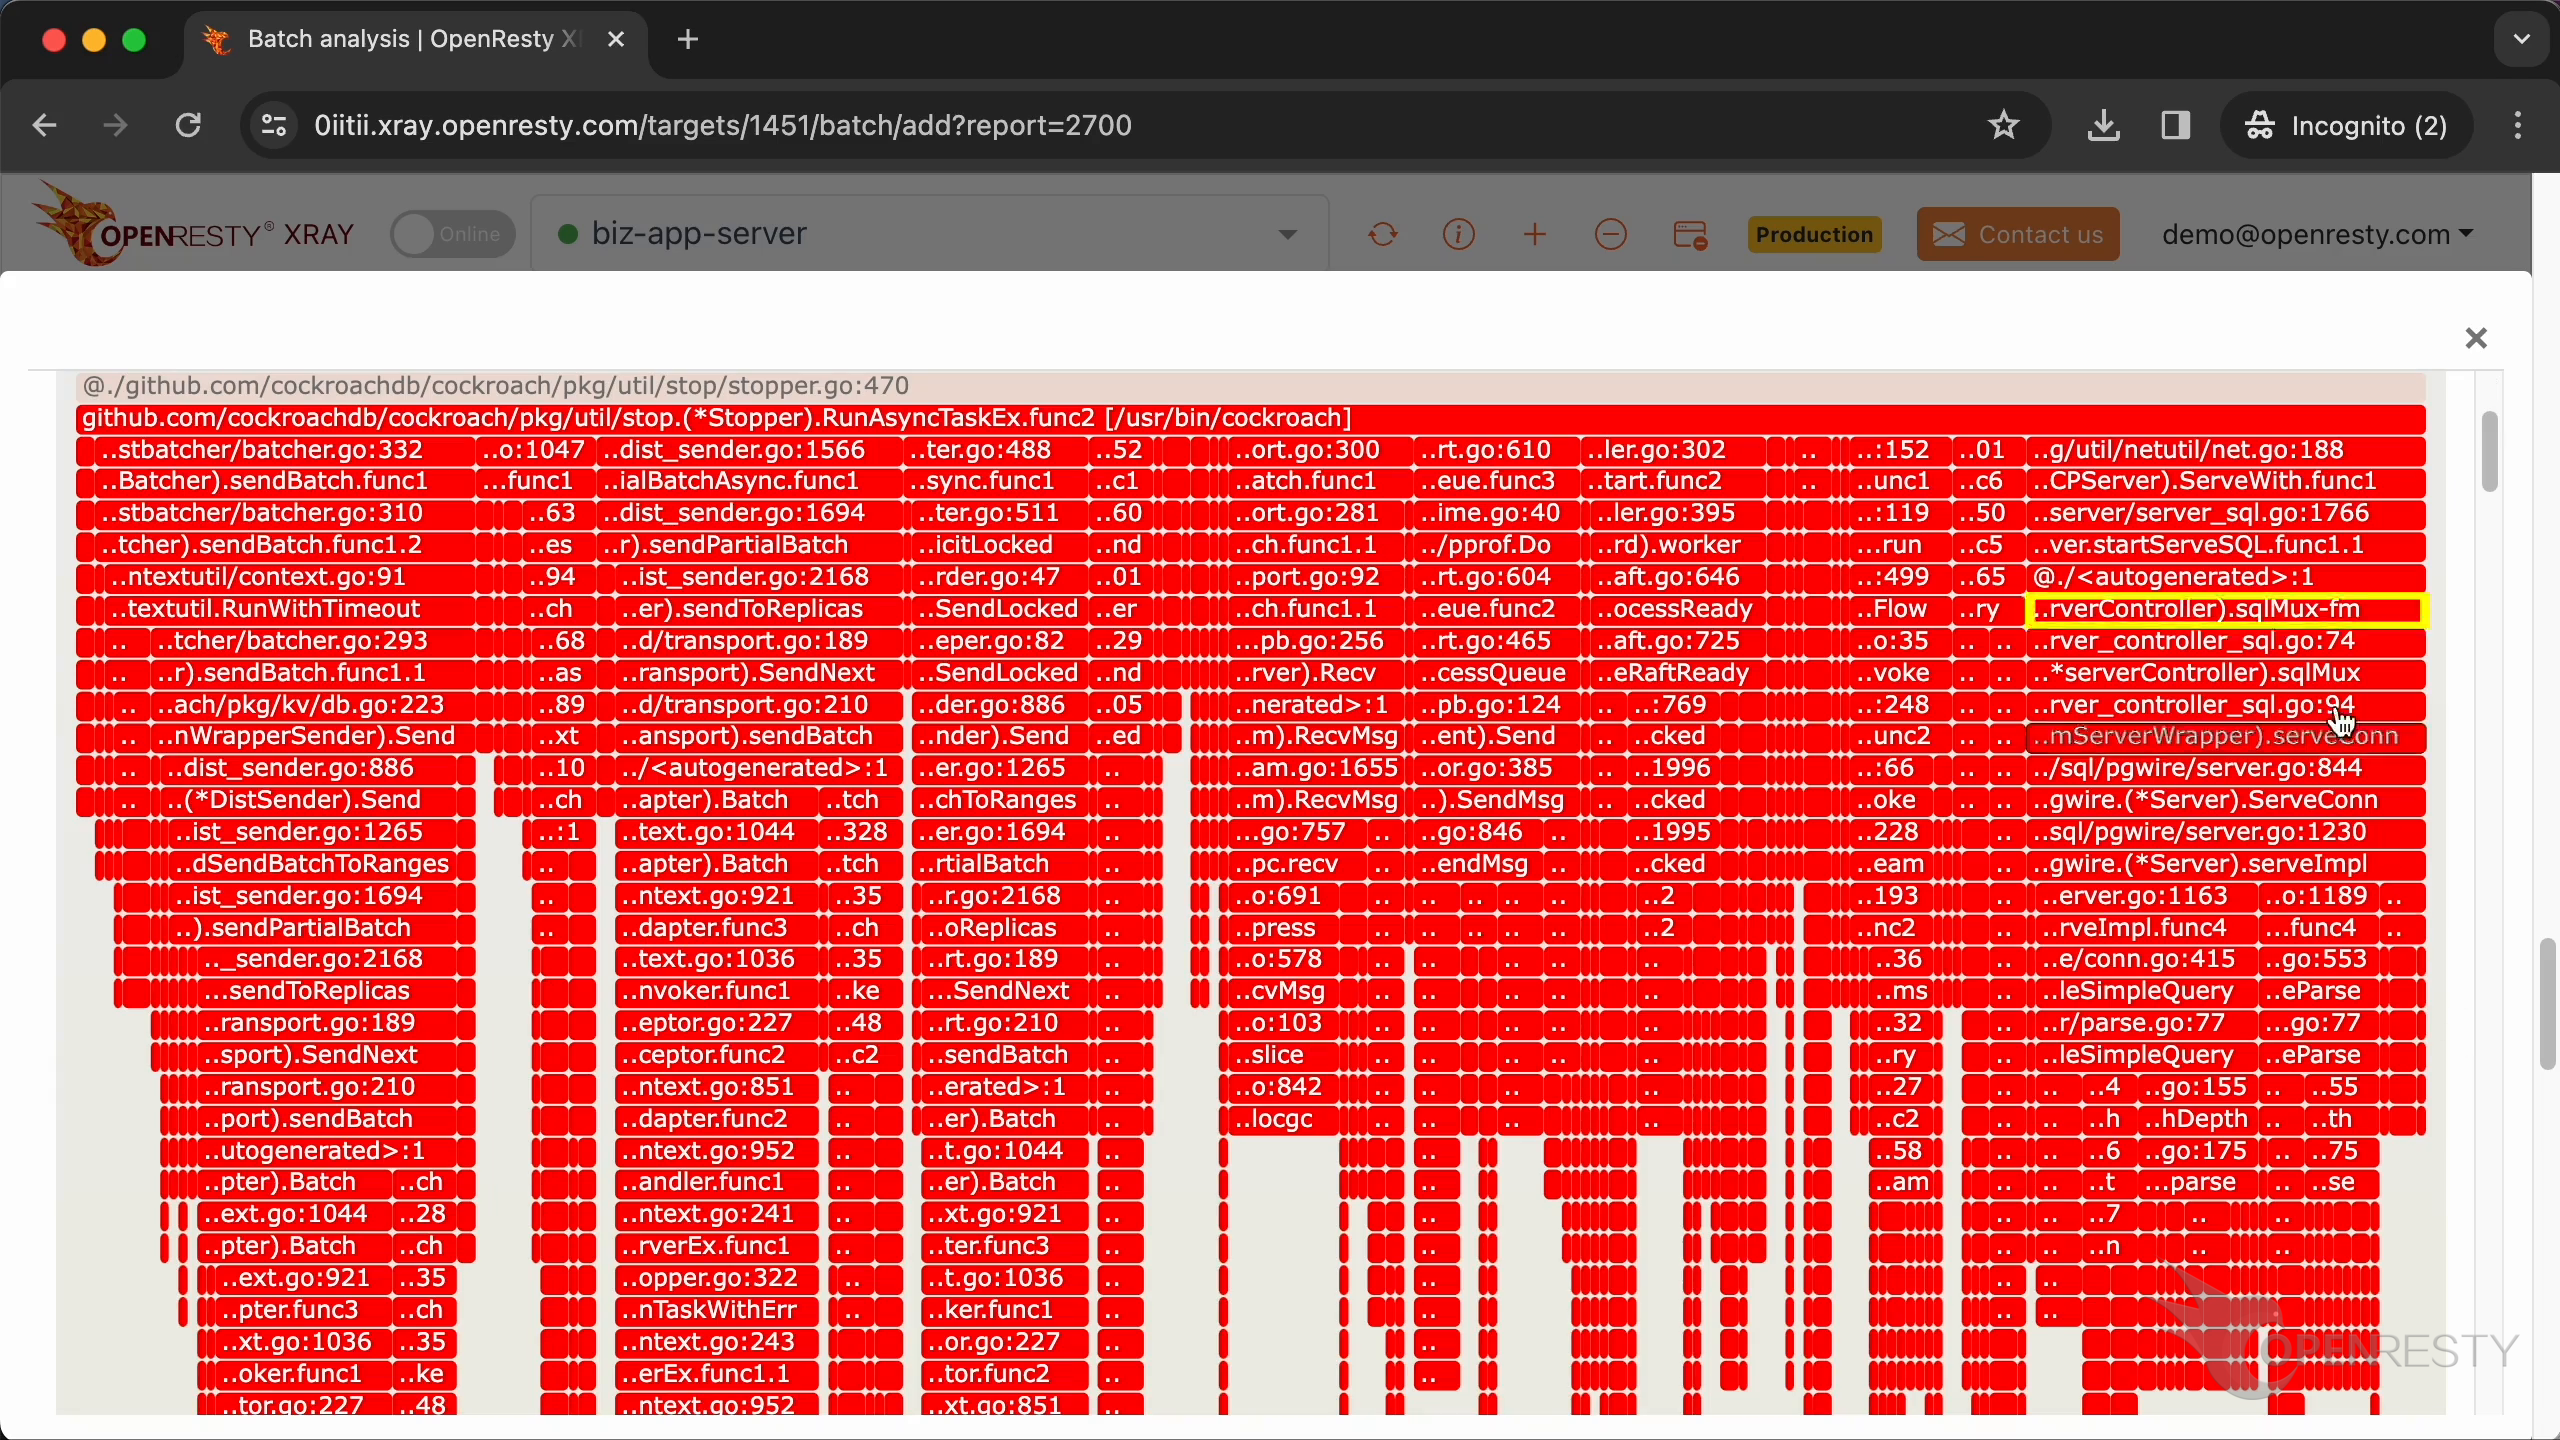
This hot code path consists of three main parts. The kvcoord package,
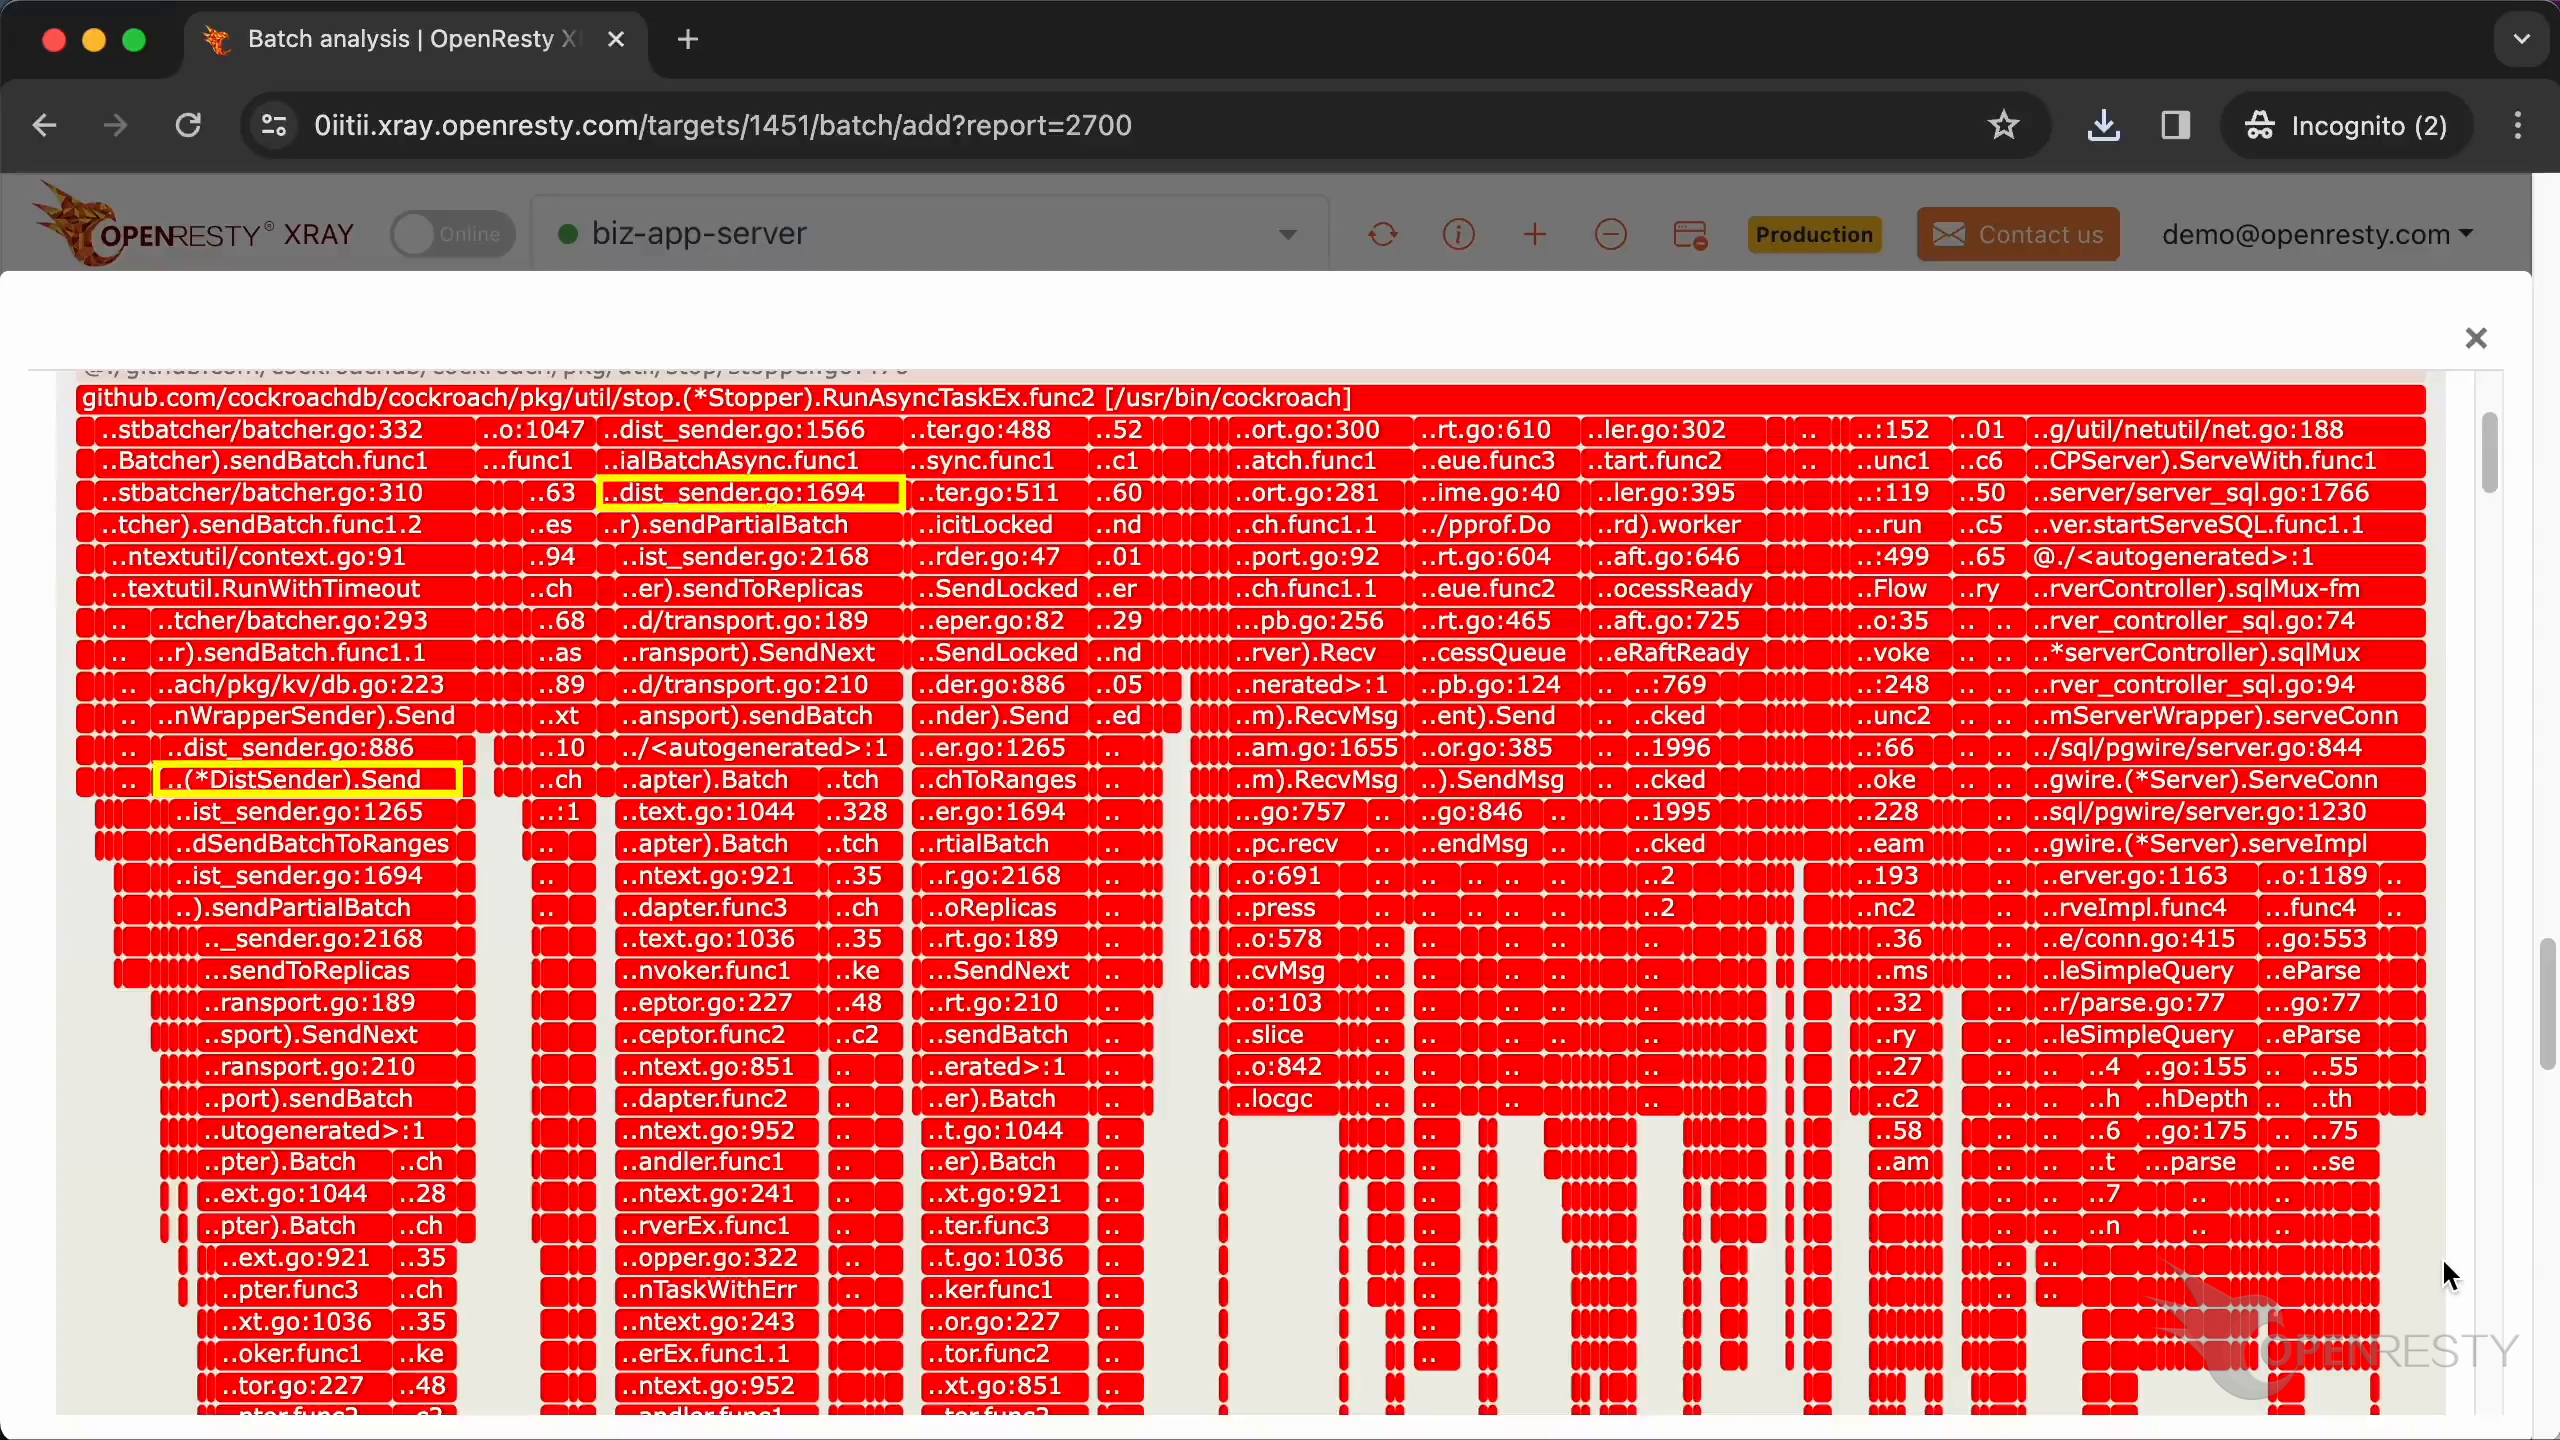
the Raft protocol,
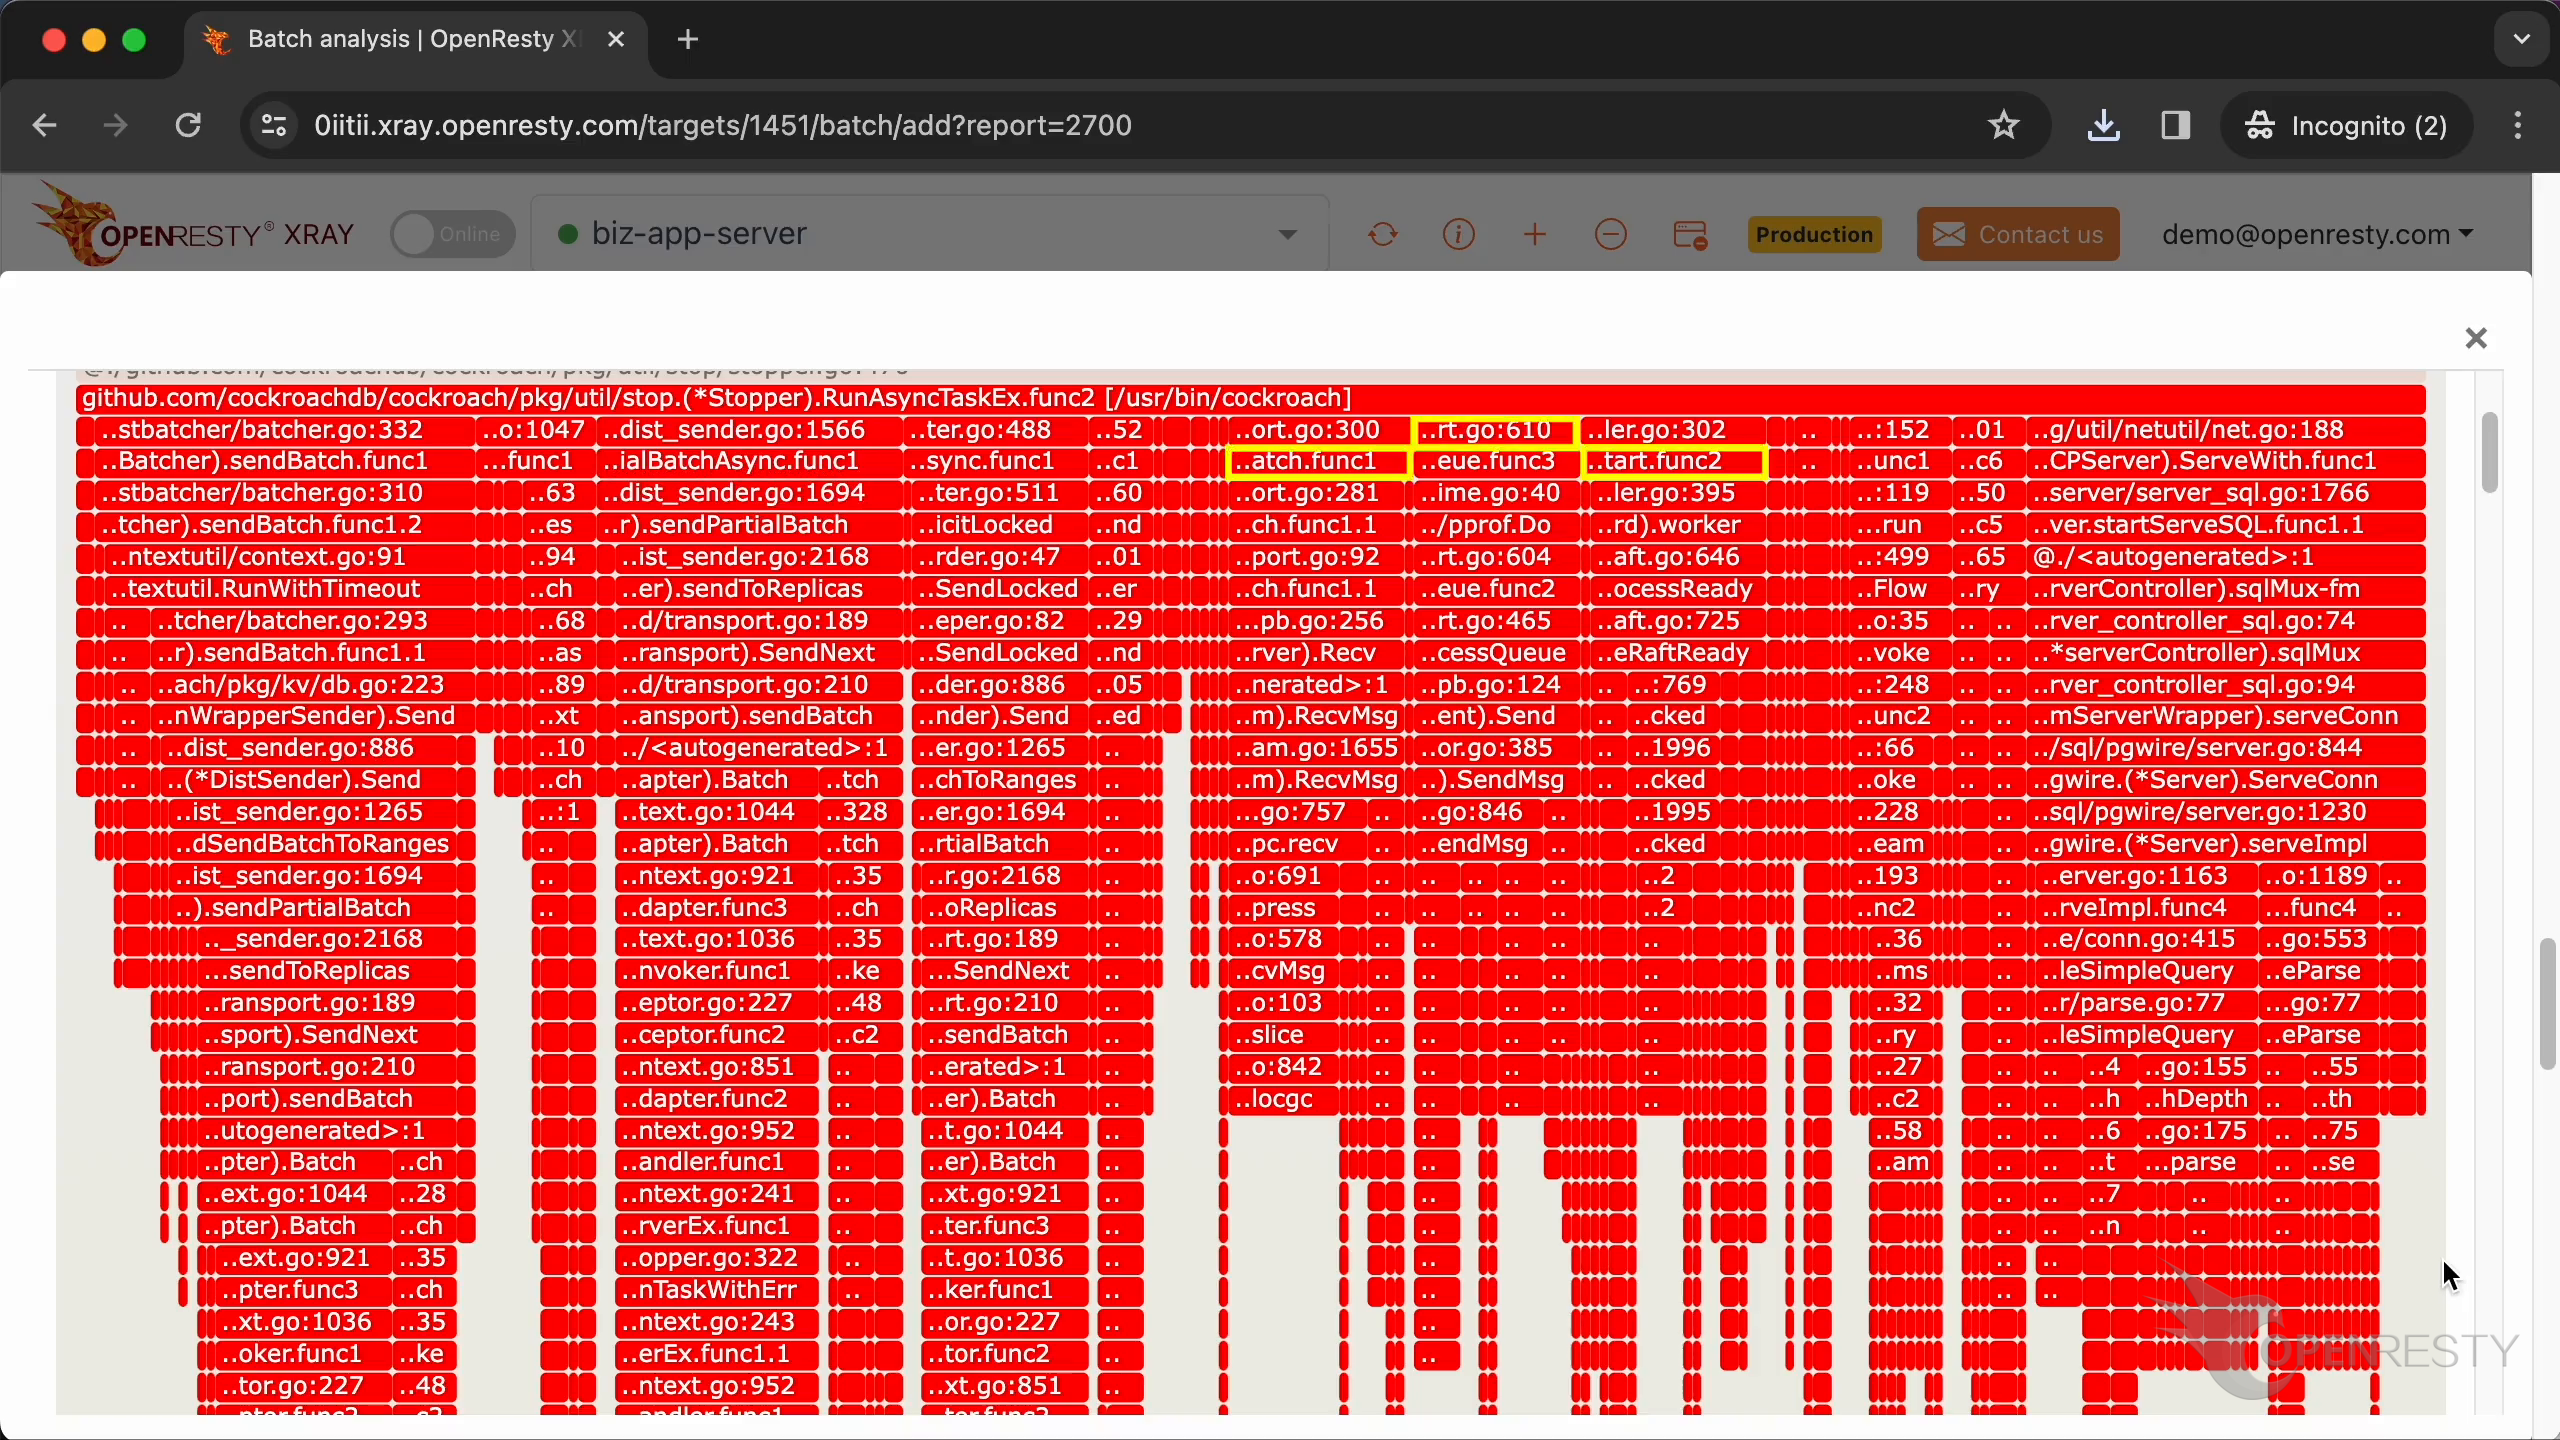
and the sqlMux component.
Click to enlarge kvcoord/dist_sender.
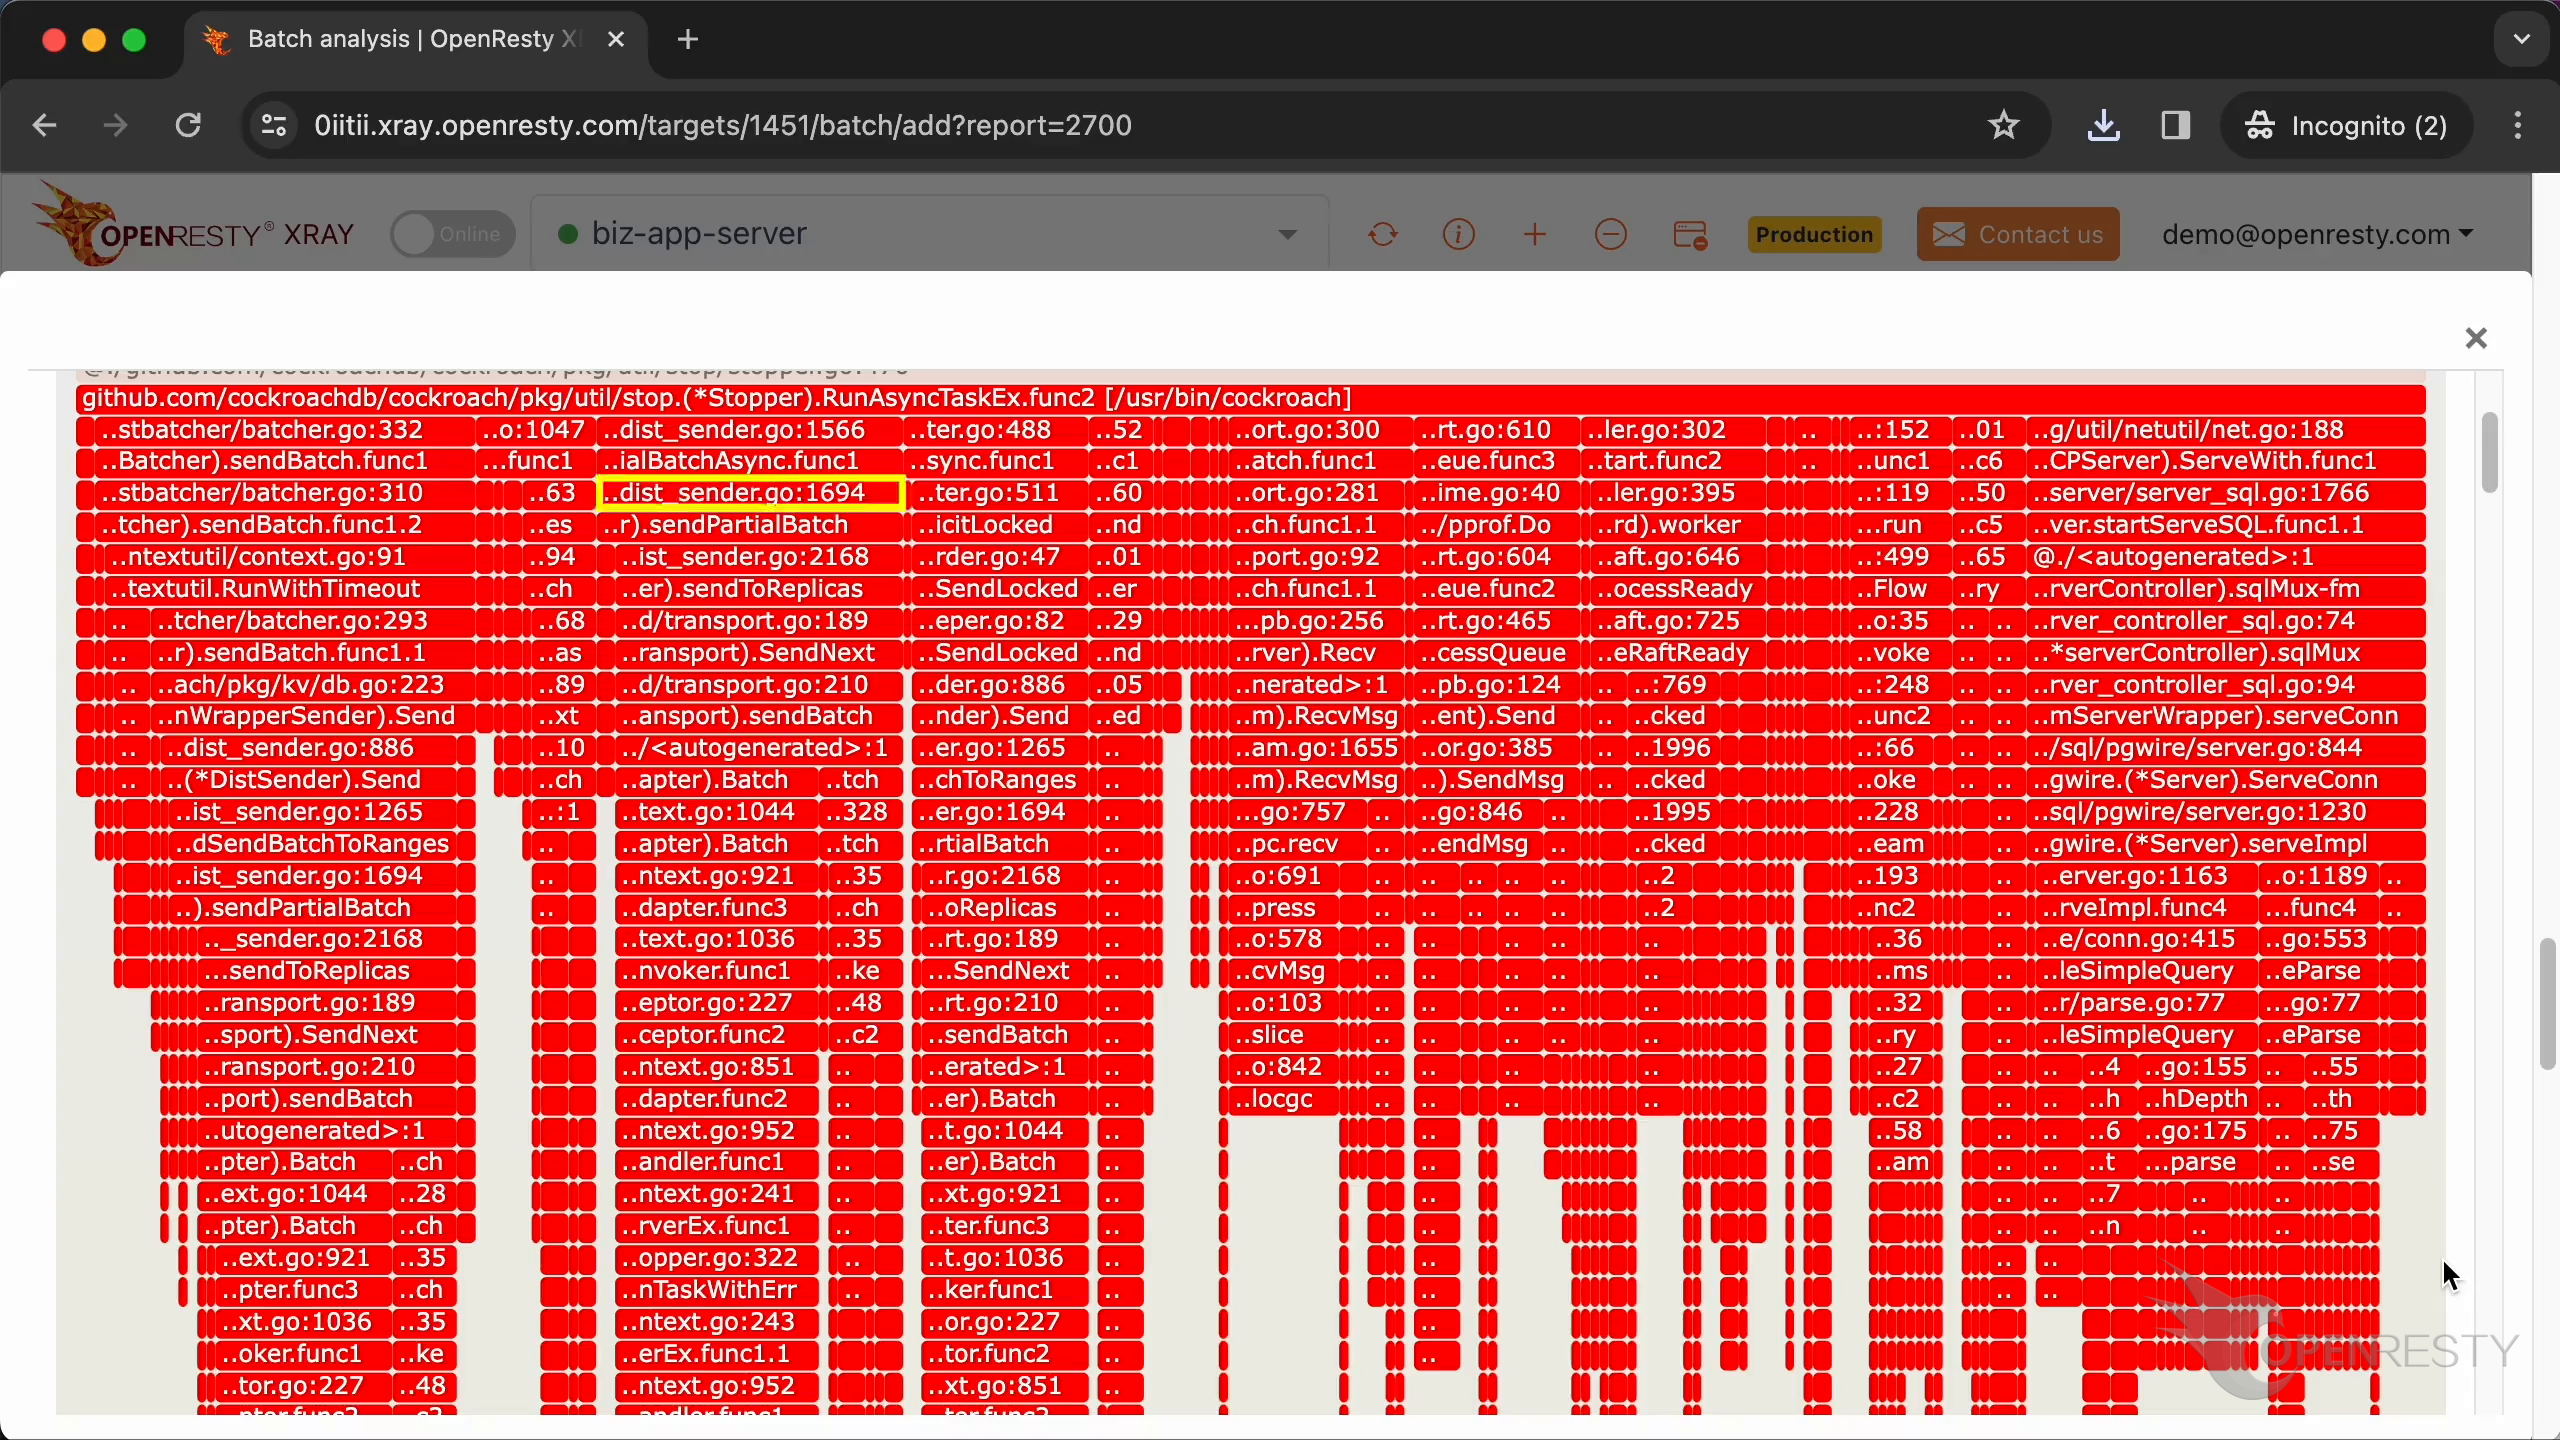
kvcoord is a key-value coordinator module in CockroachDB. It handles concurrent access and data consistency. And responsible for coordinating concurrent operations between multiple kvclient instances, to ensure data correctness and consistency.
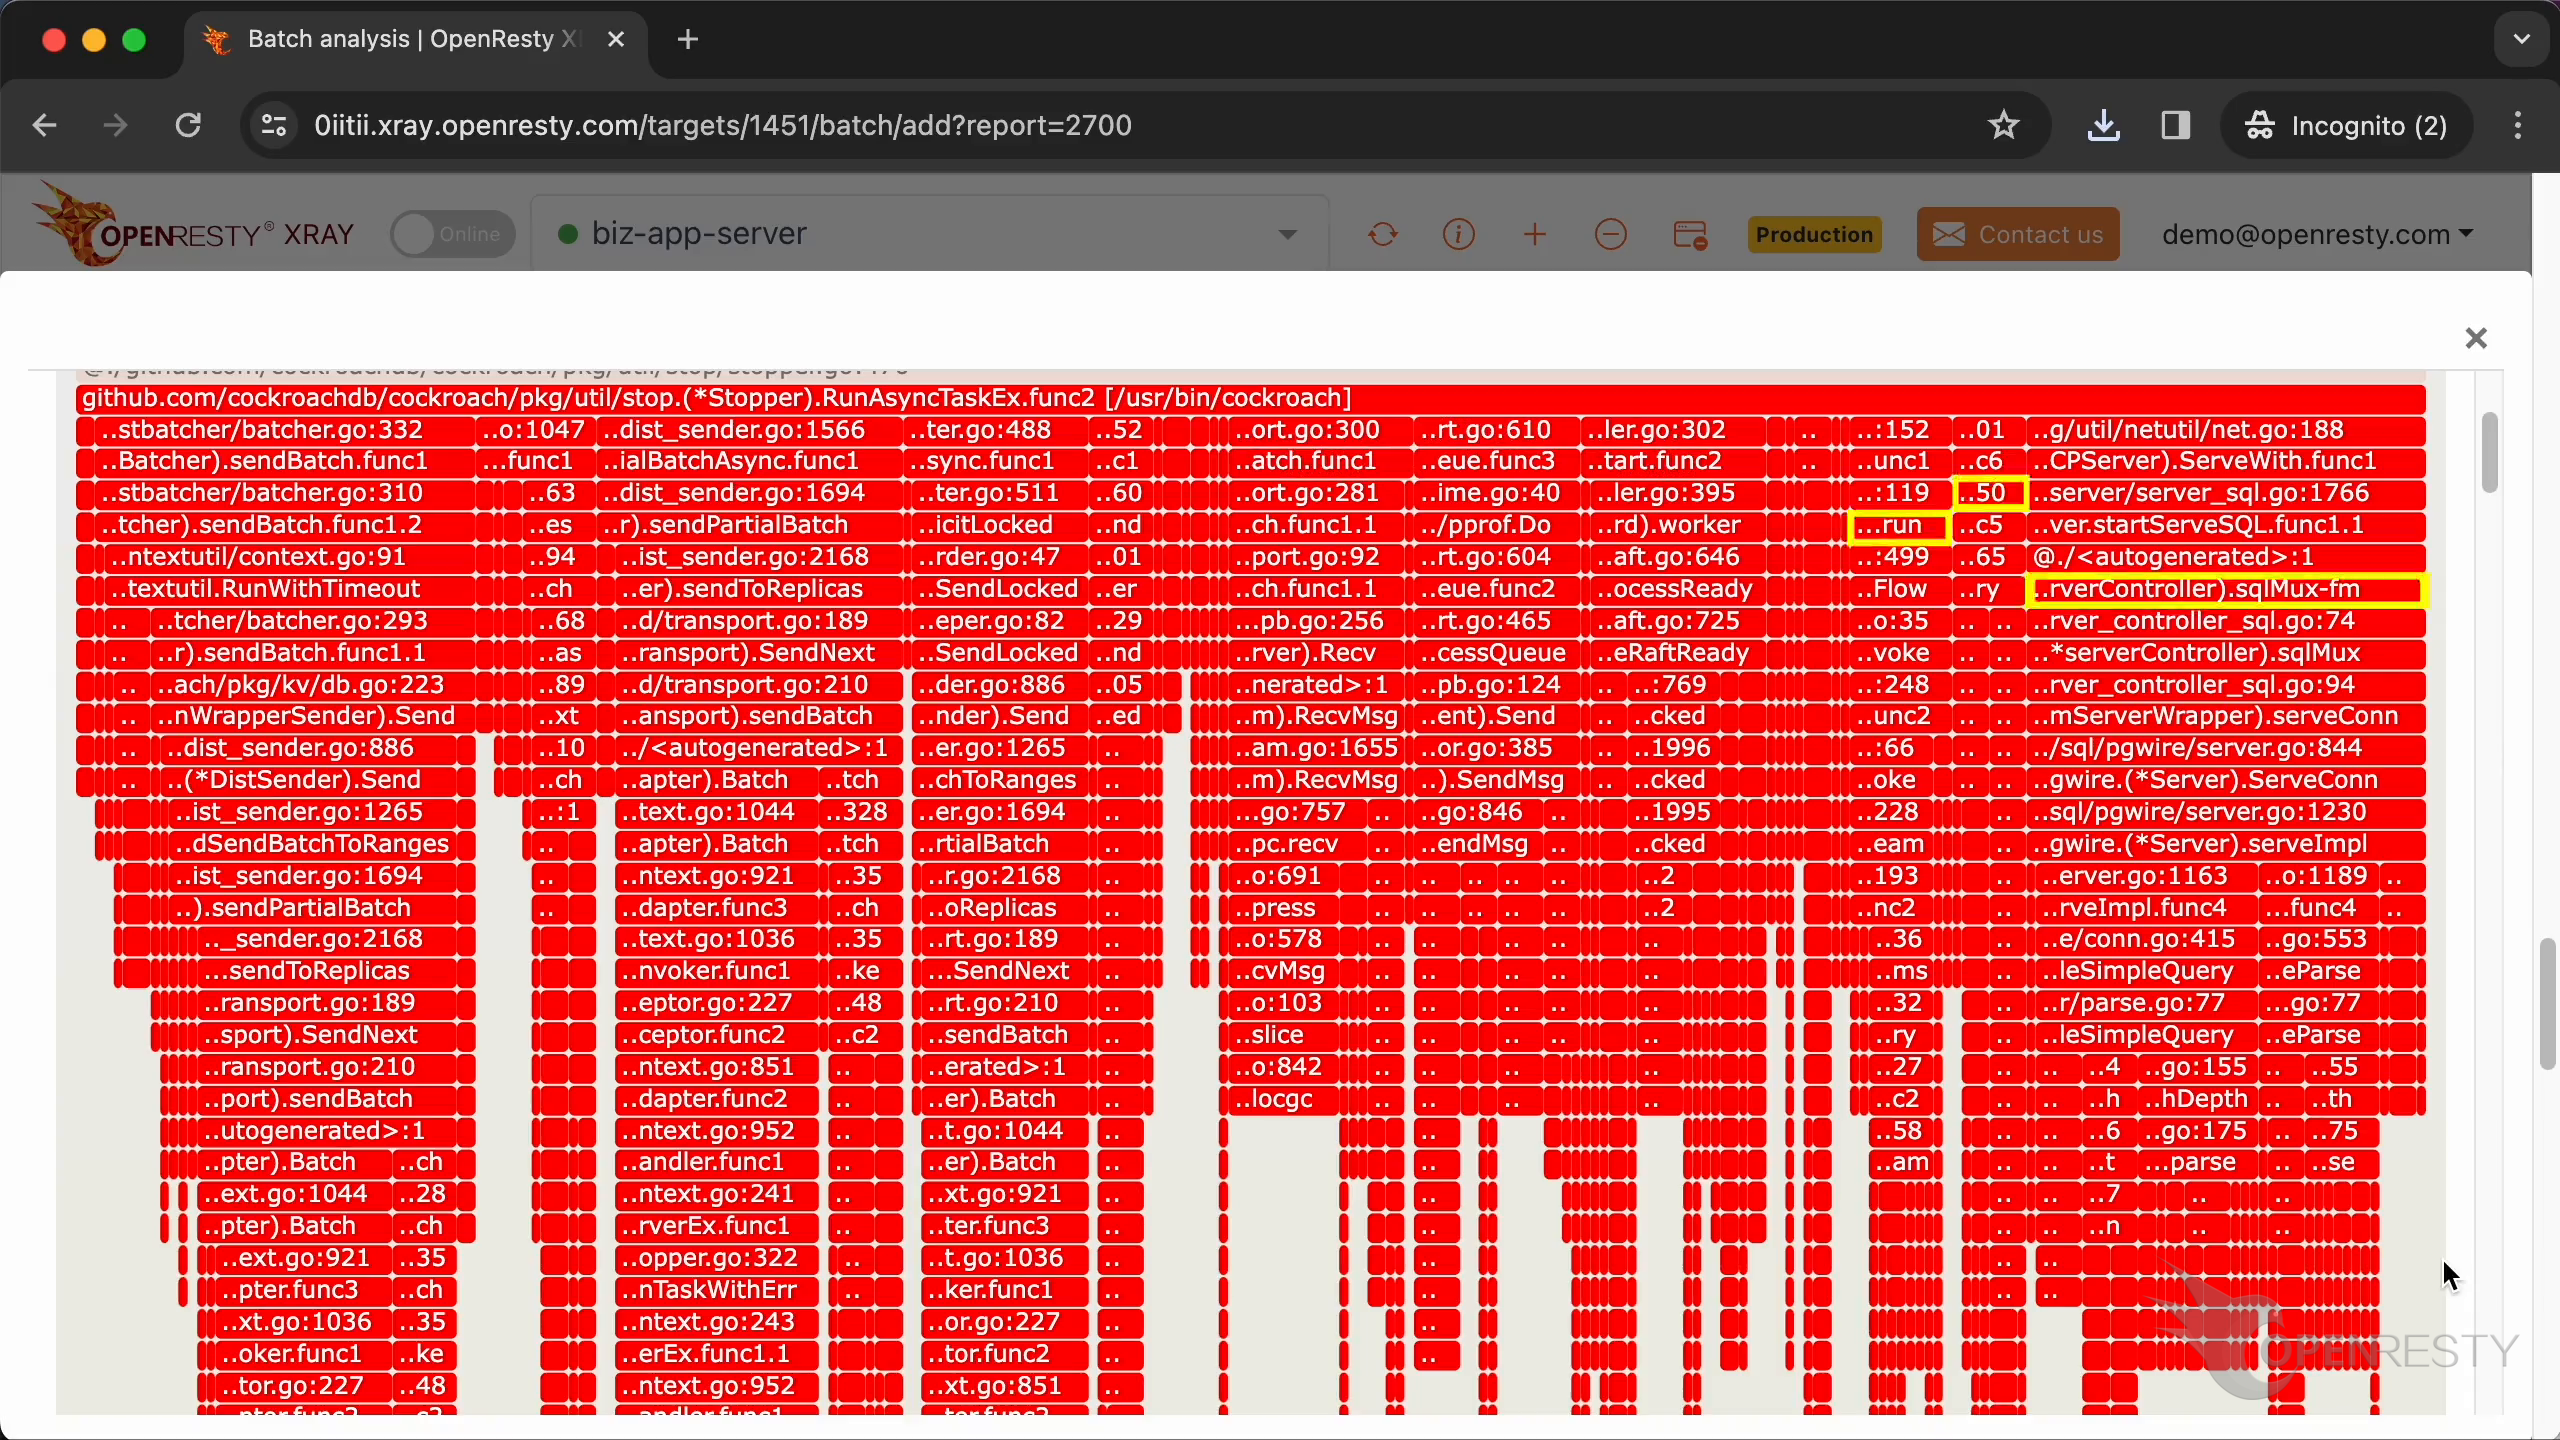
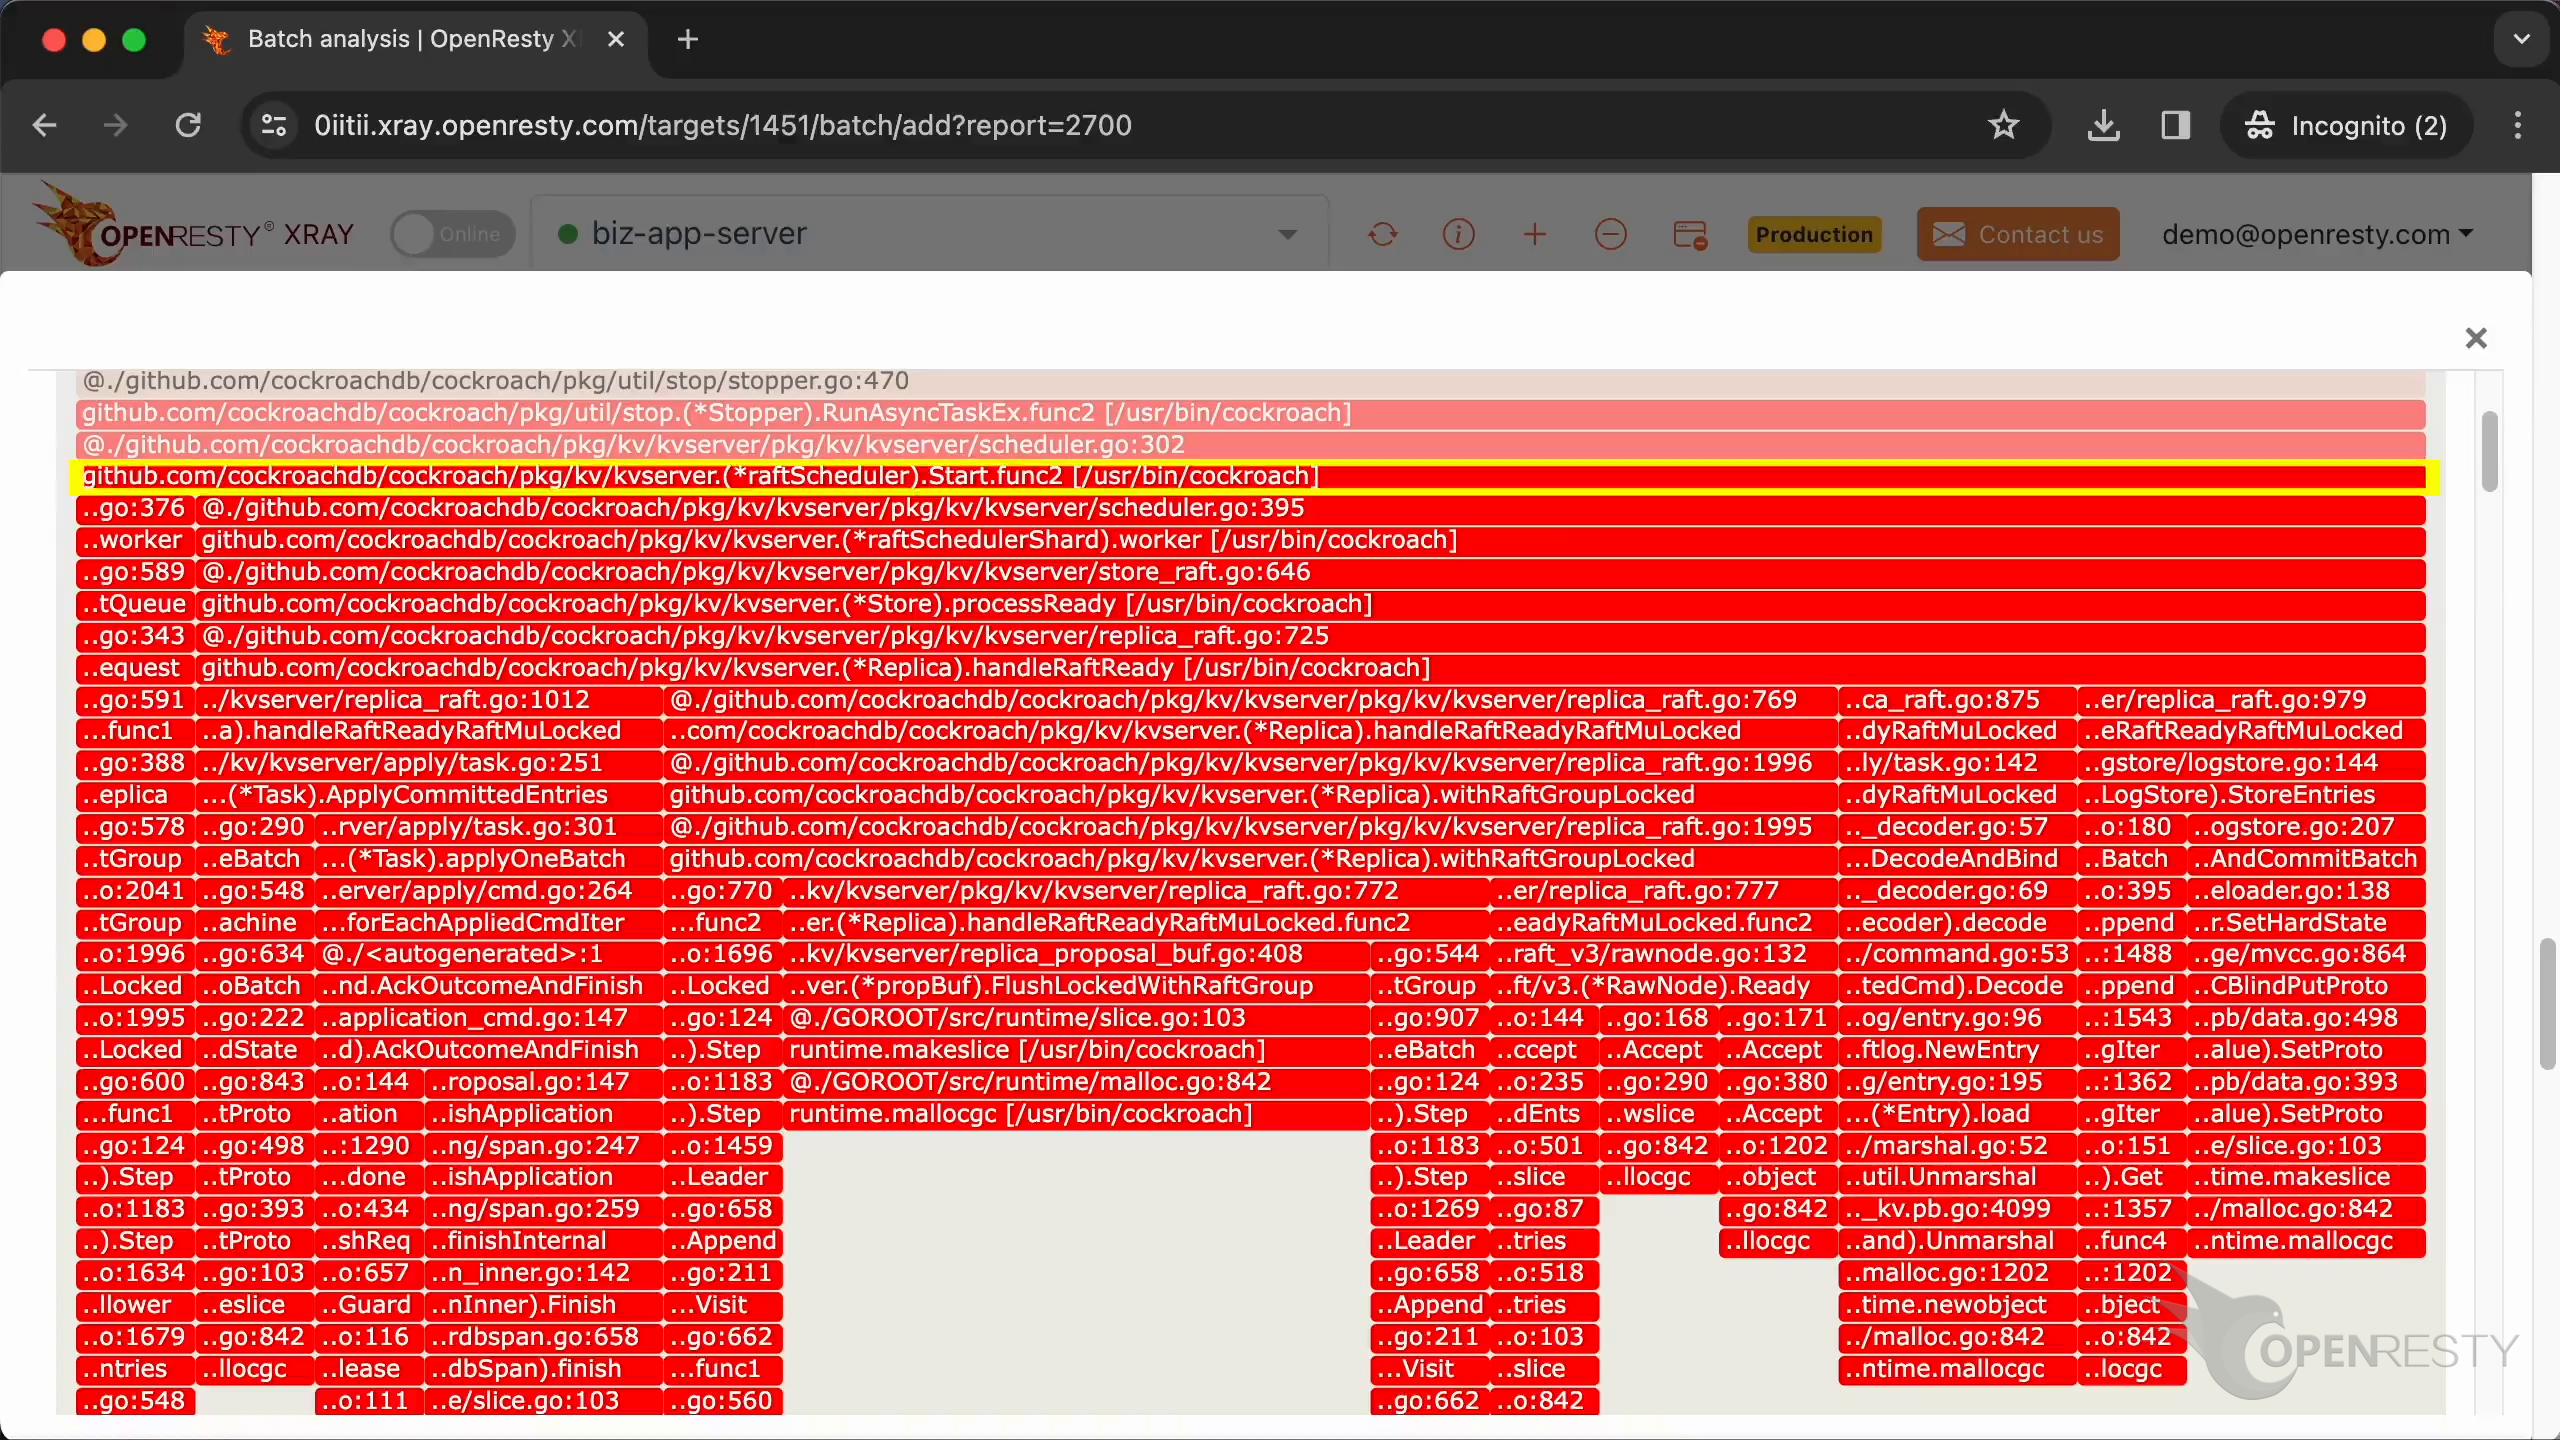
Click to enlarge the Start function.
Raft is a distributed consistency protocol used by CockroachDB for data replication and fault tolerance. CockroachDB is a distributed database. It uses multiple kvserver nodes to provide high availability and scalability.
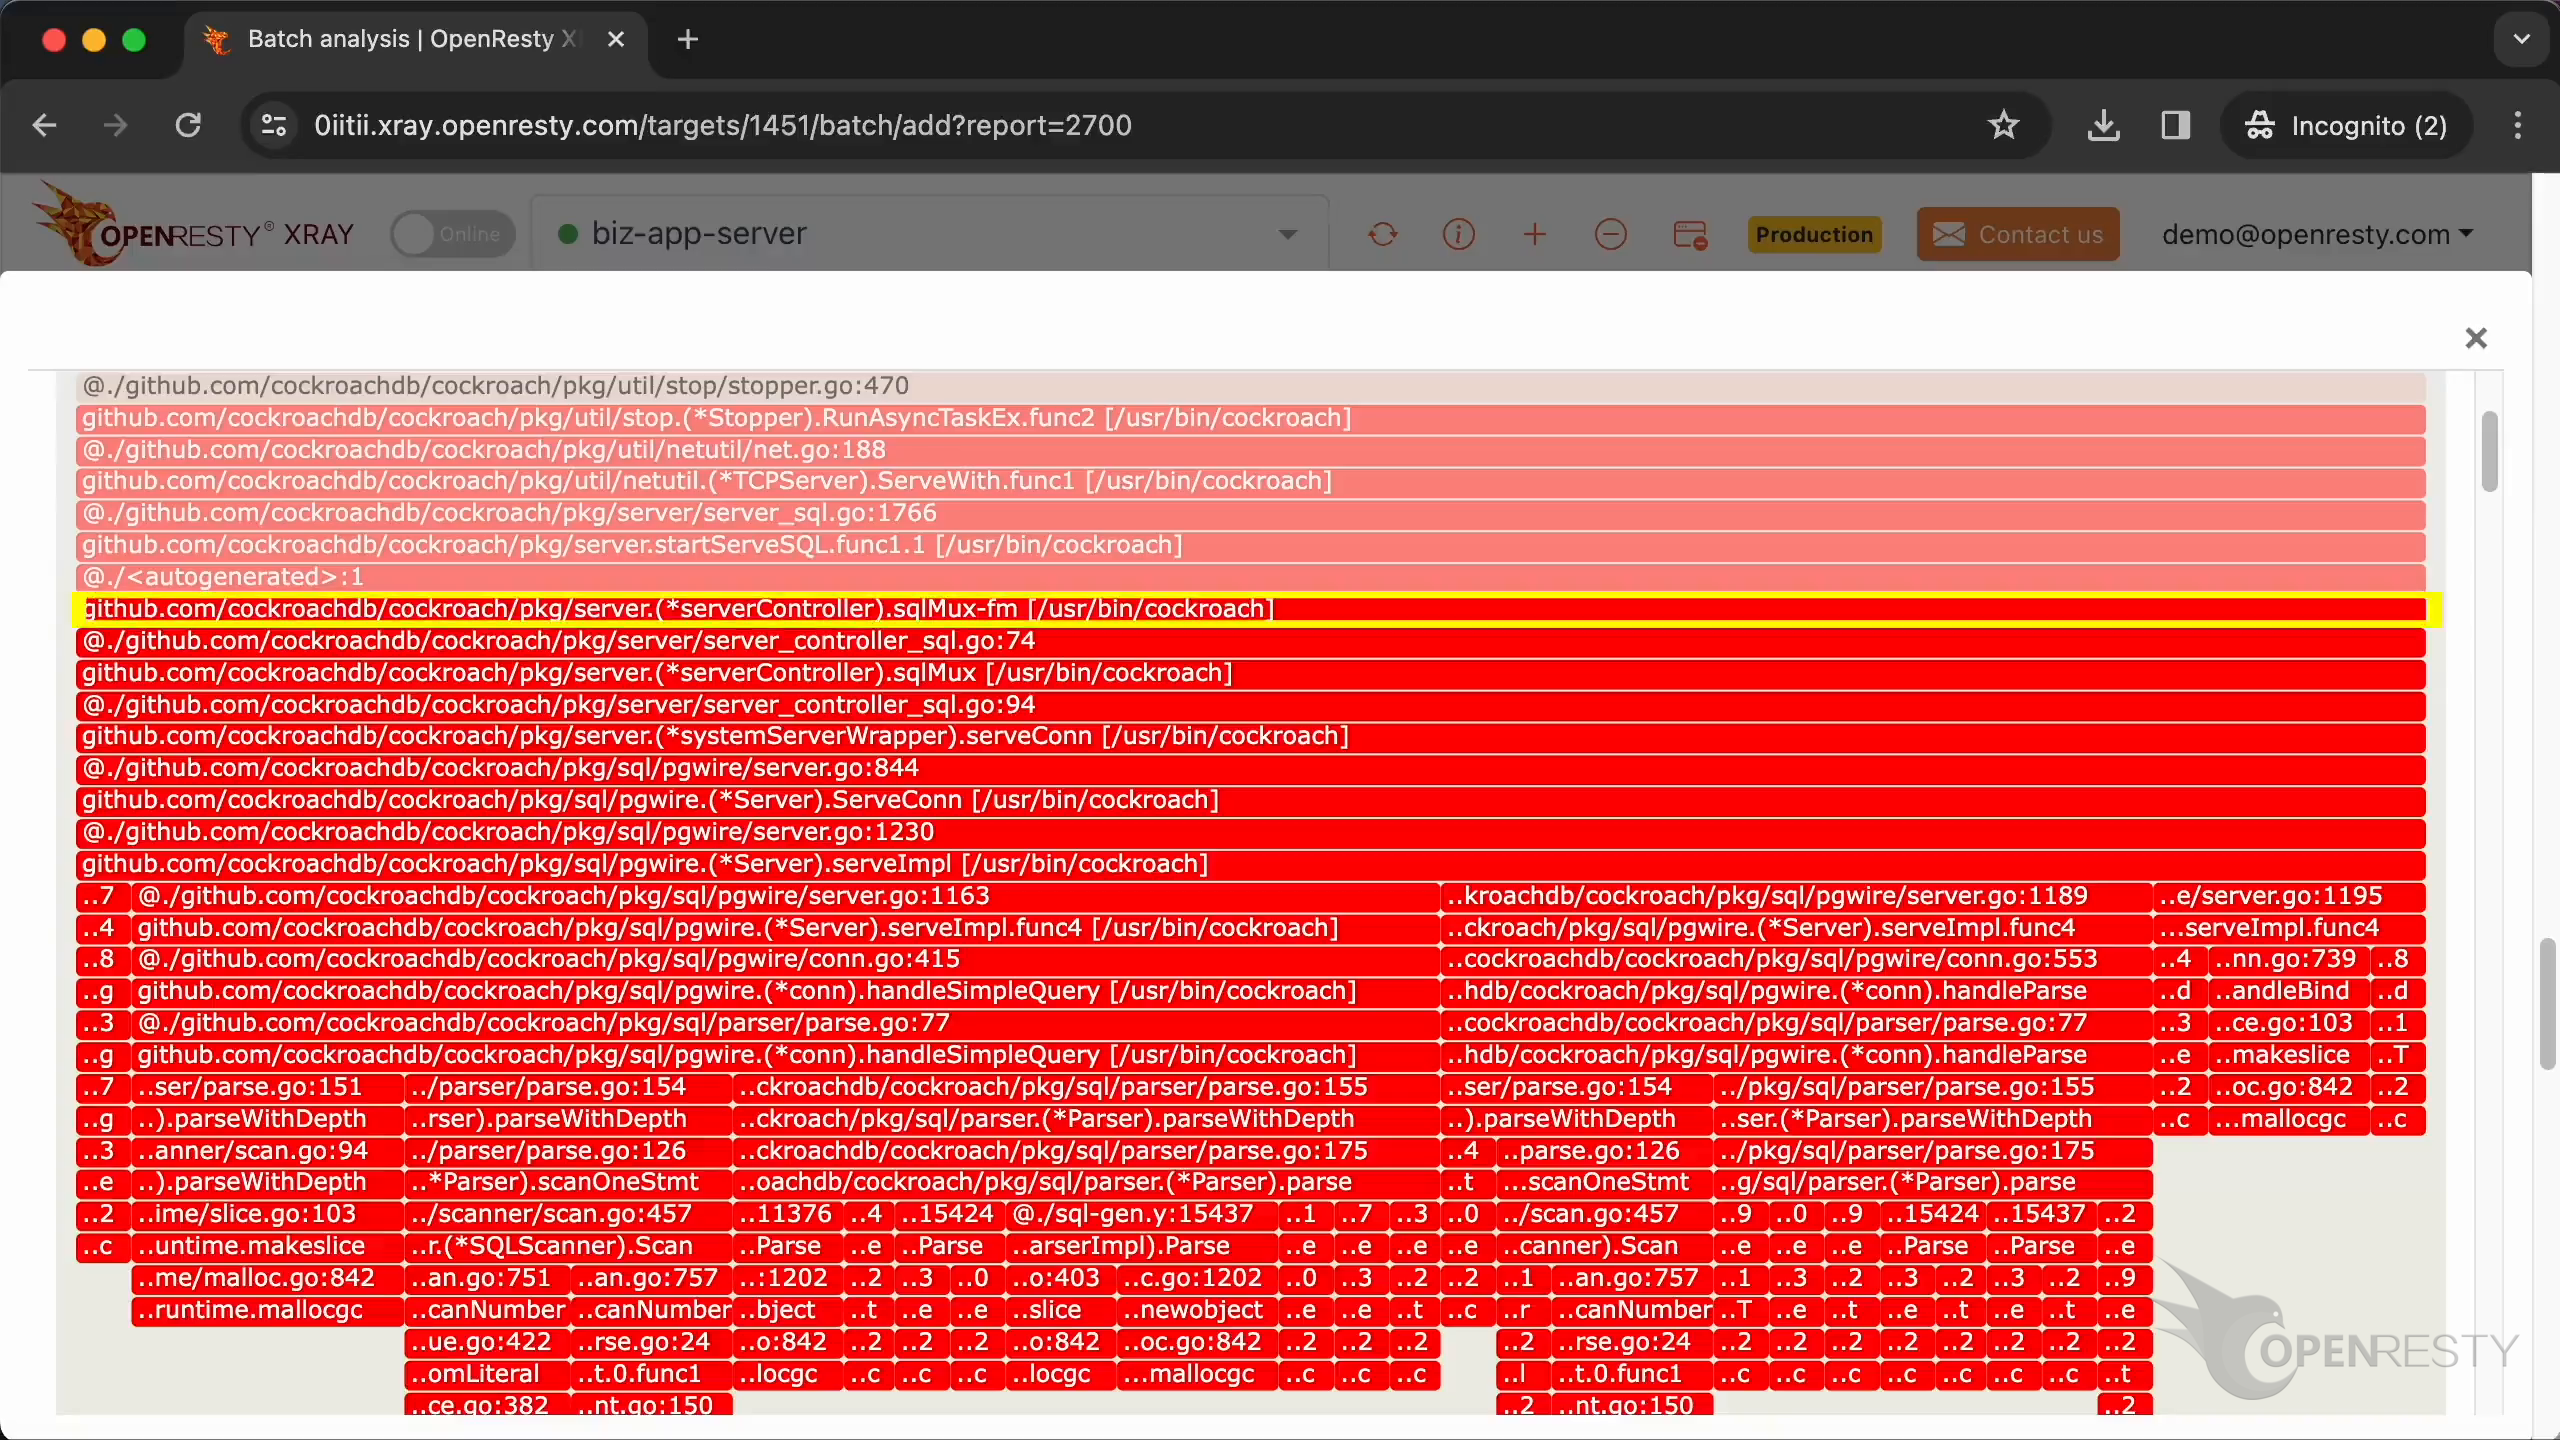
Zoom in the sqlMux function.
sqlMux handles routing and multiplexing of SQL requests on CockroachDB’s nodes.
These are the other code paths that allocate the most GC objects.
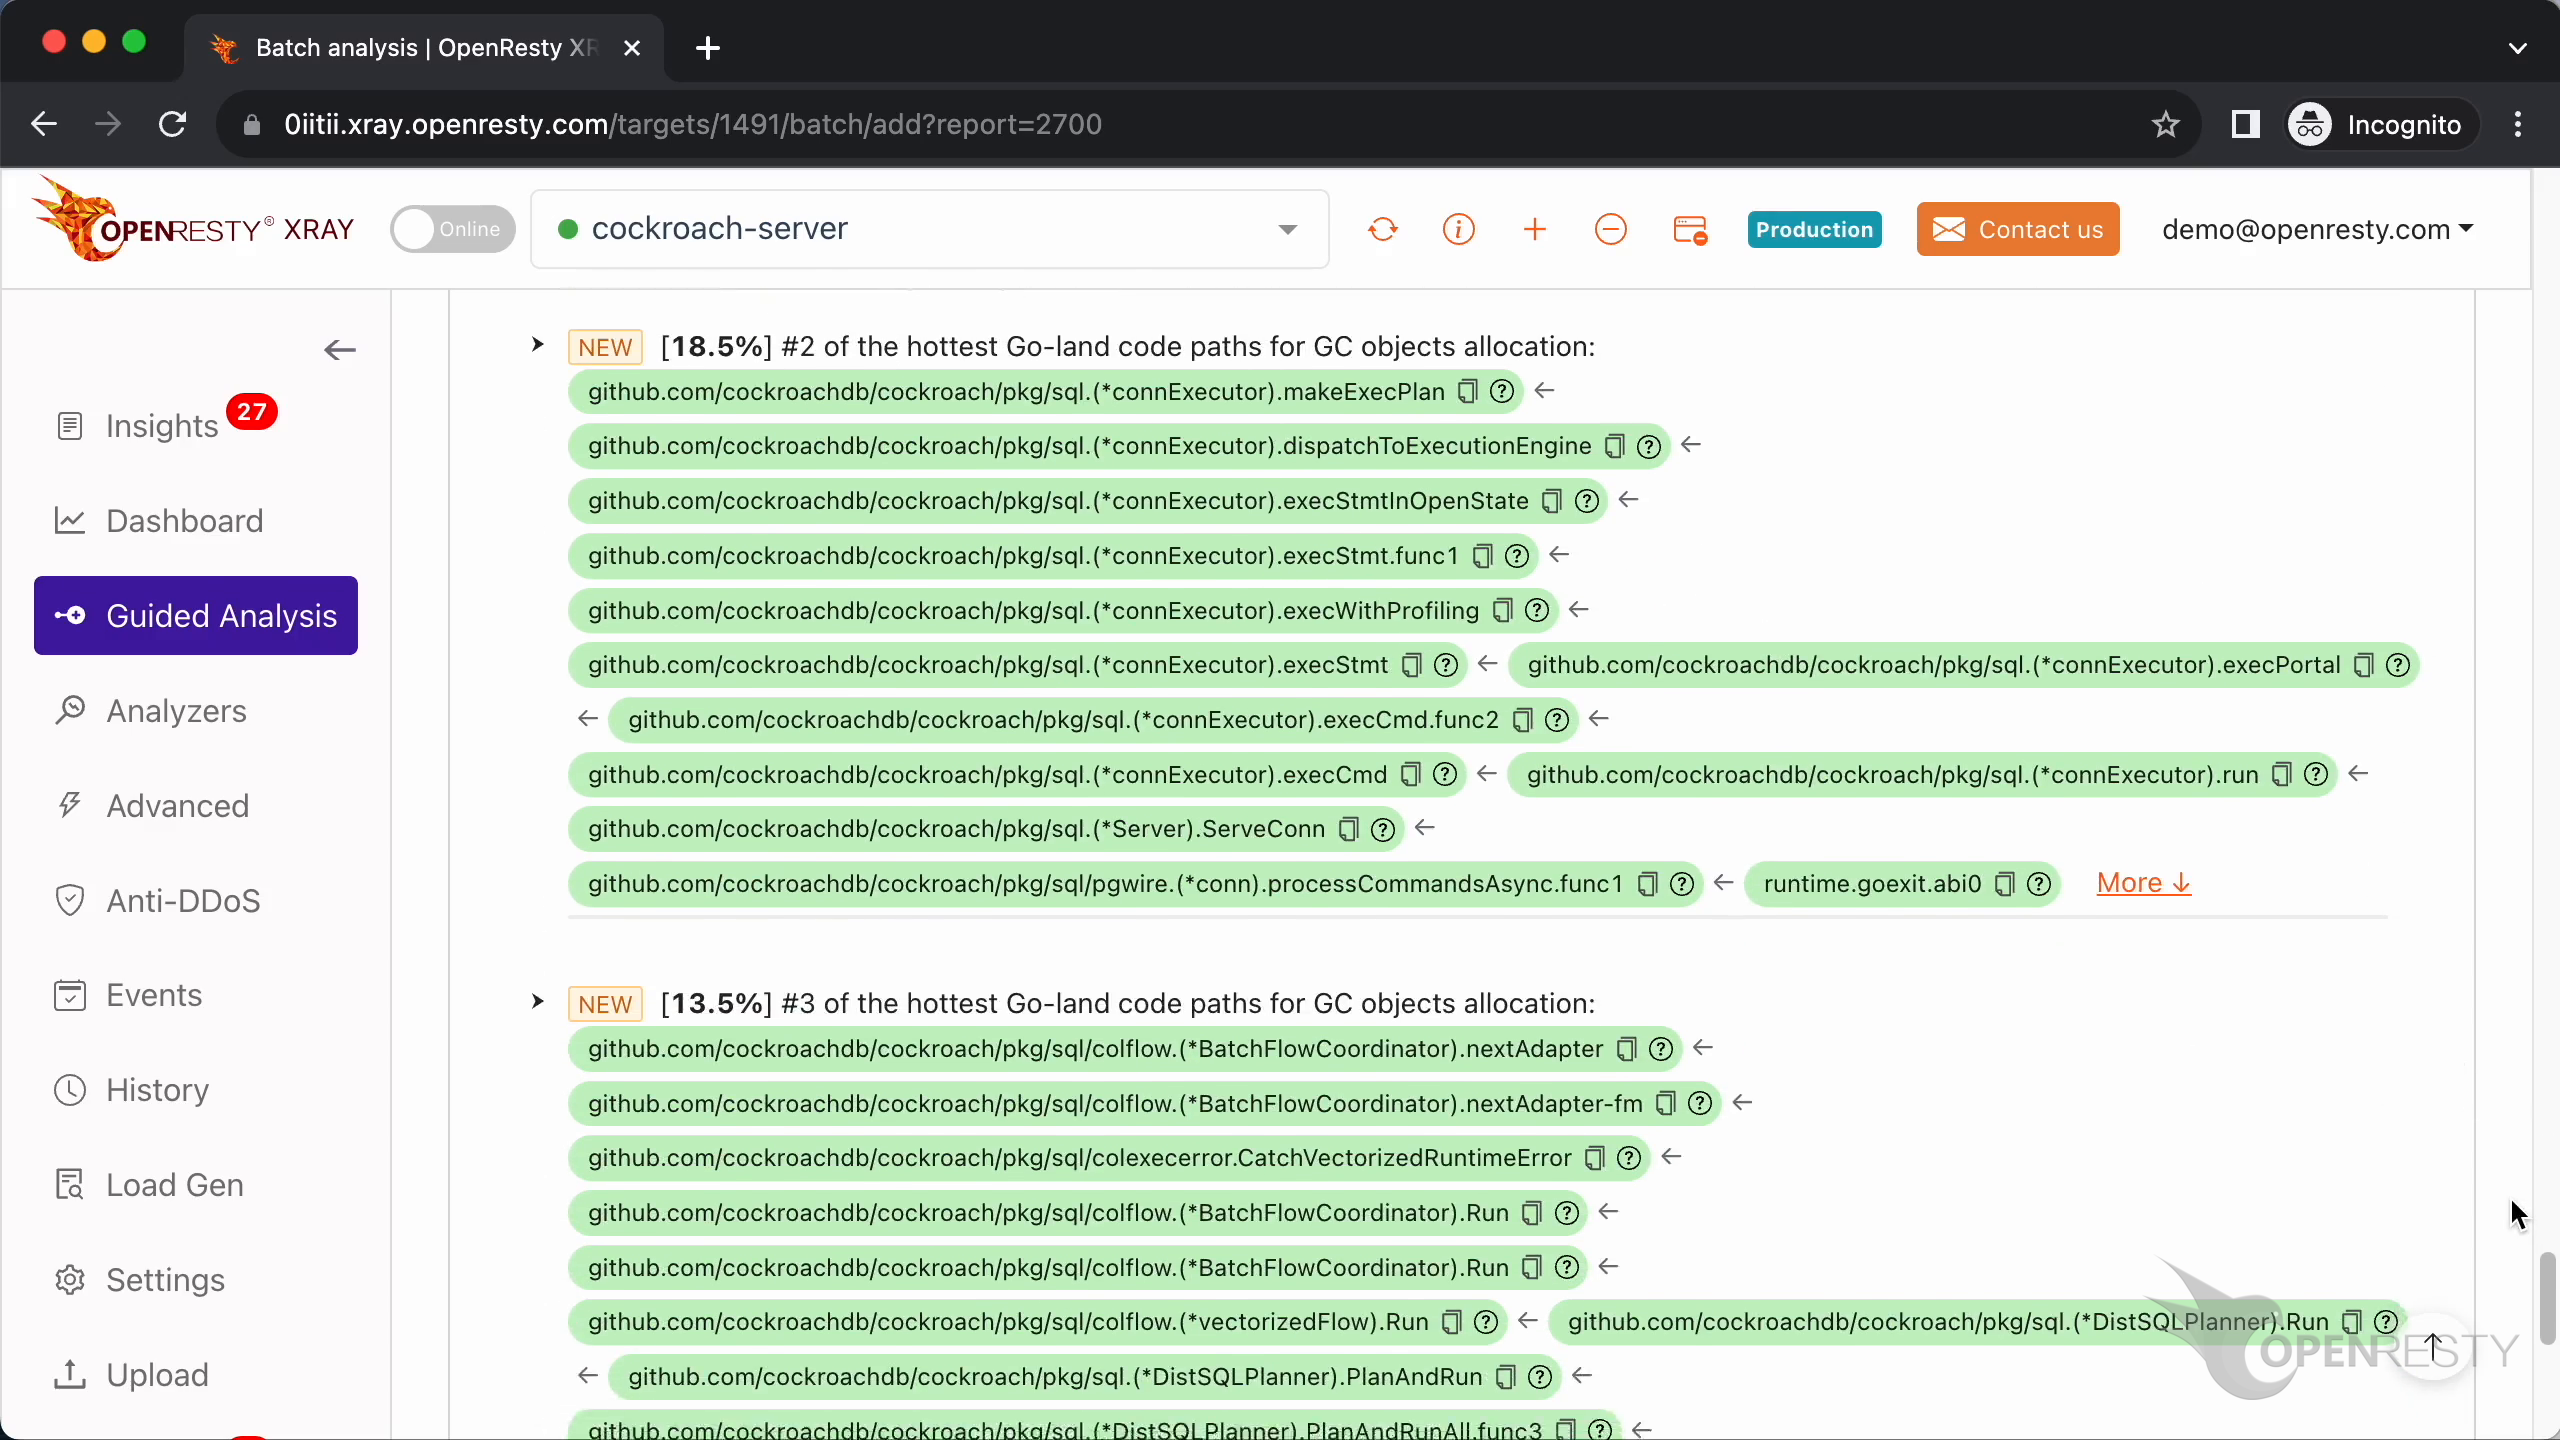
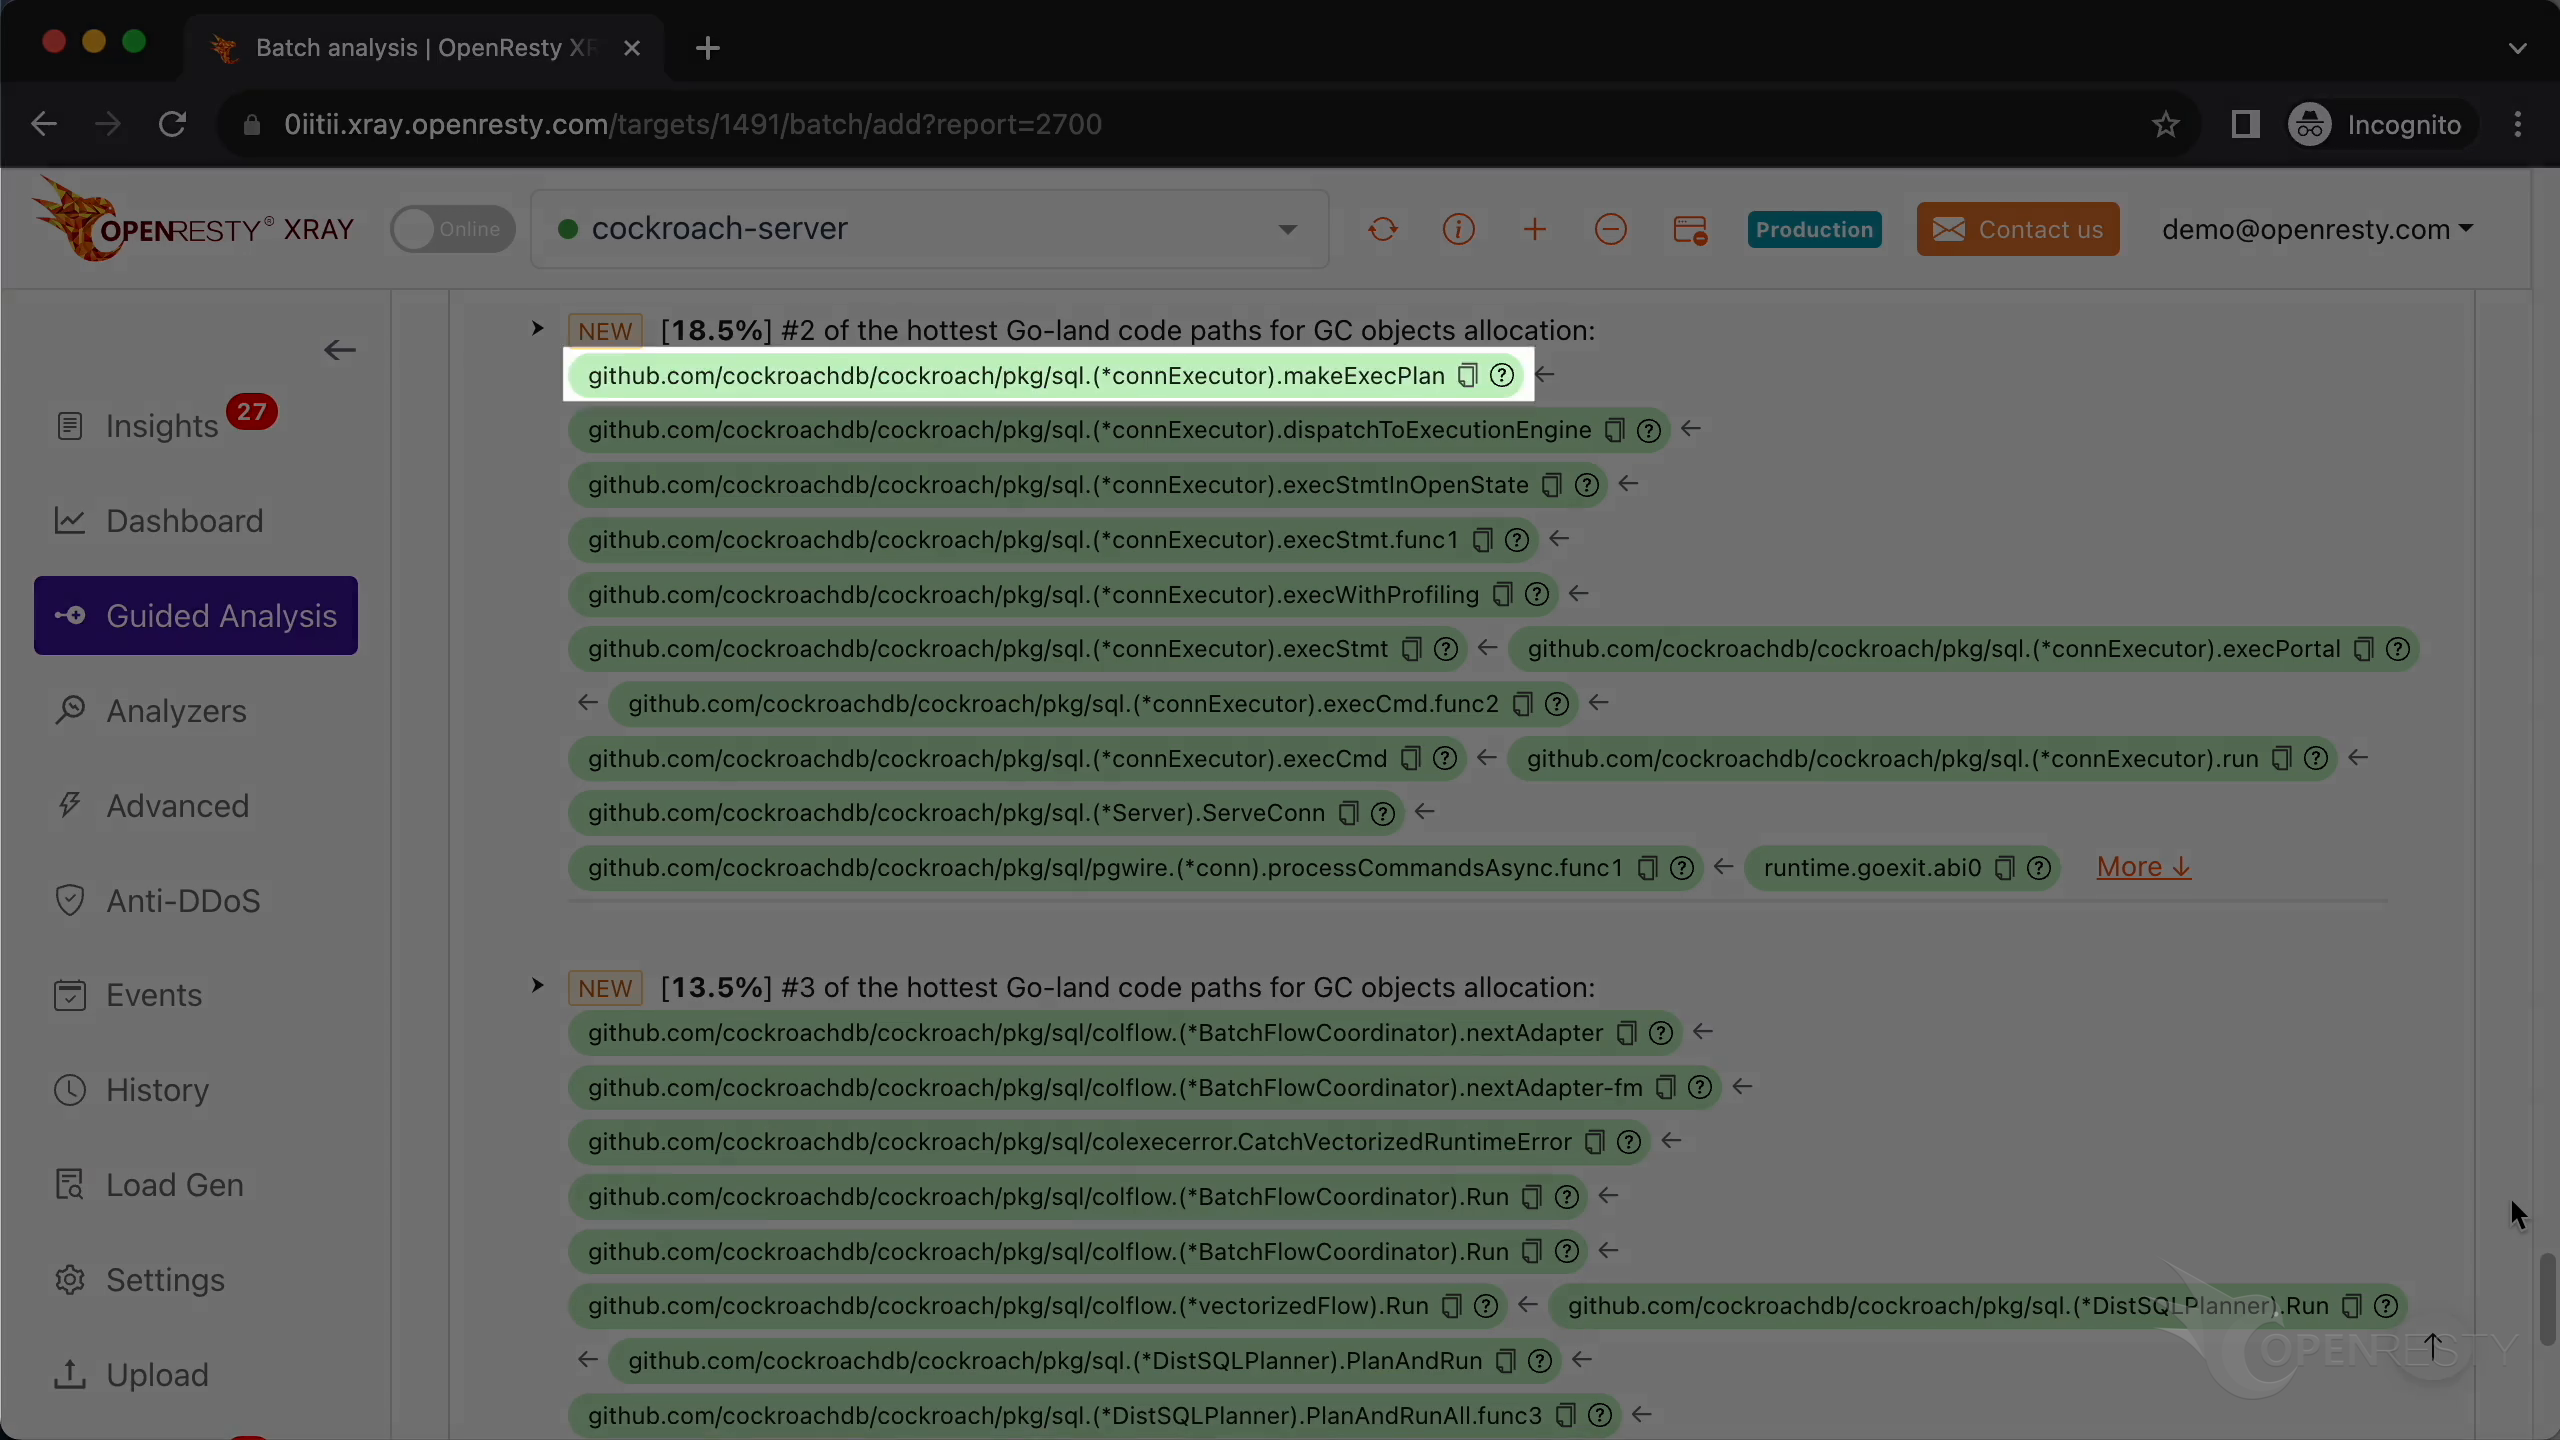
This is the second GC object allocation path.
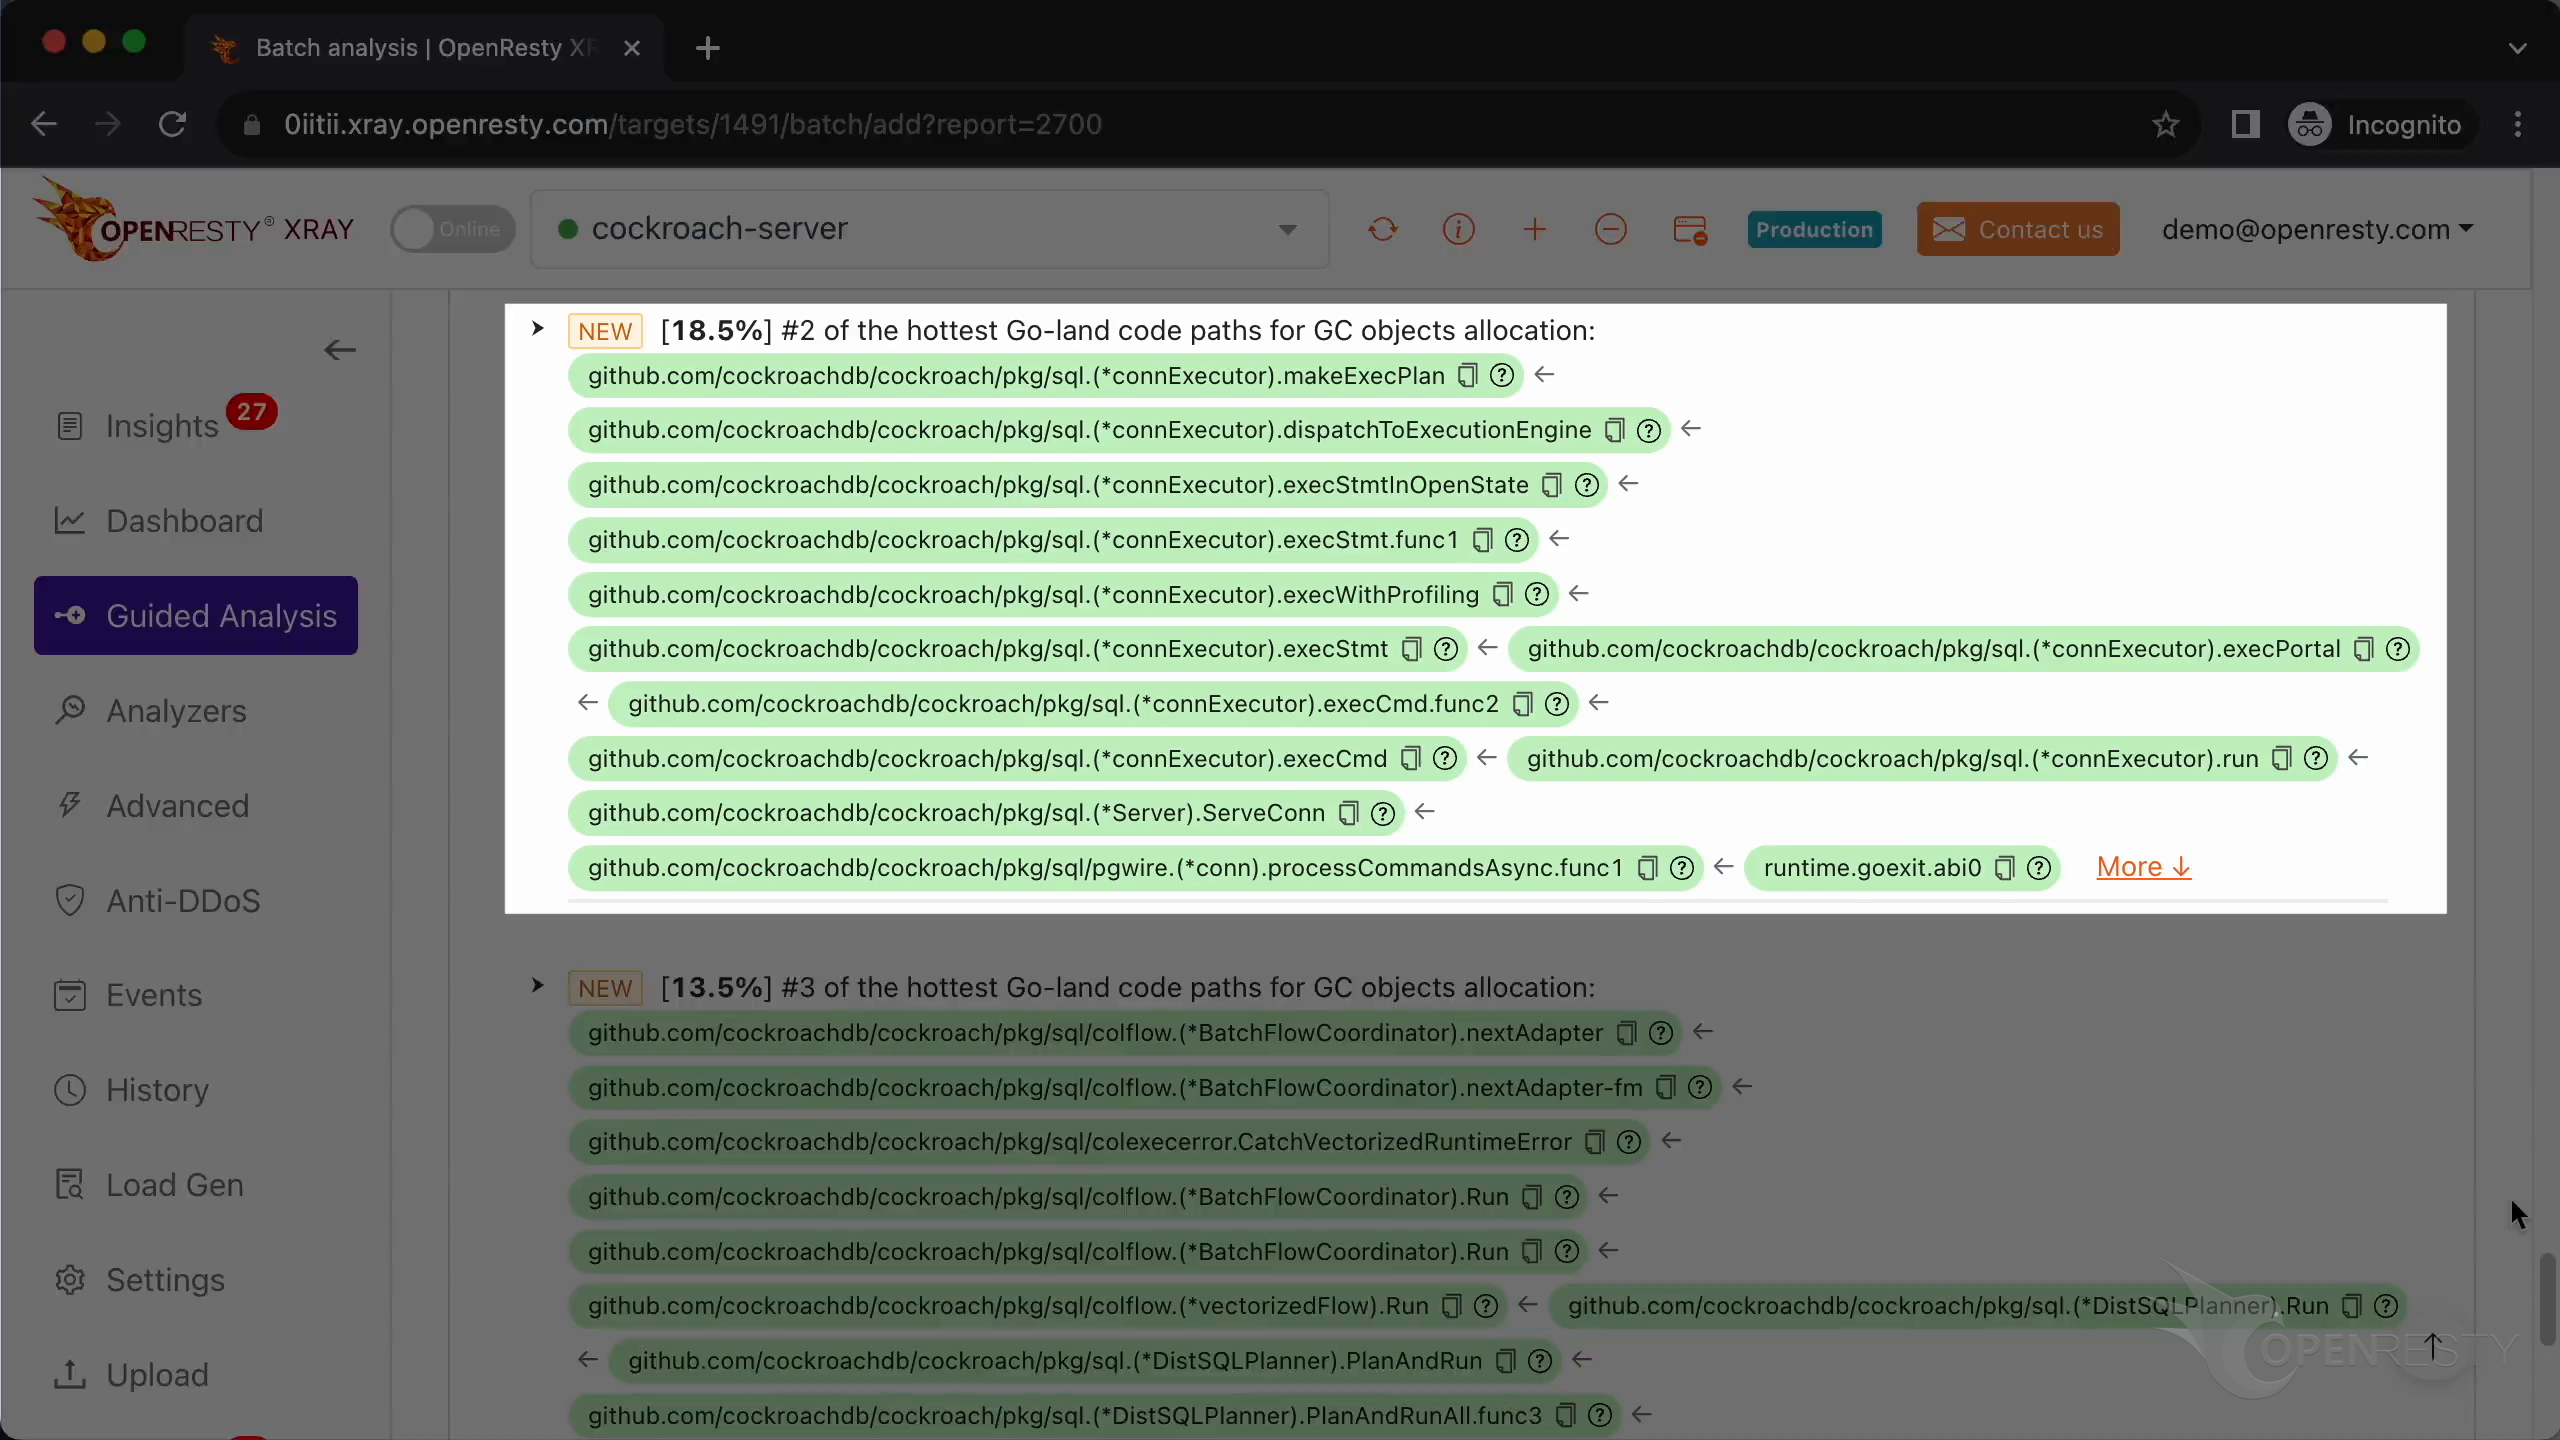
In the CockroachDB SQL layer, the makeExecPlan() function creates a query execution plan.
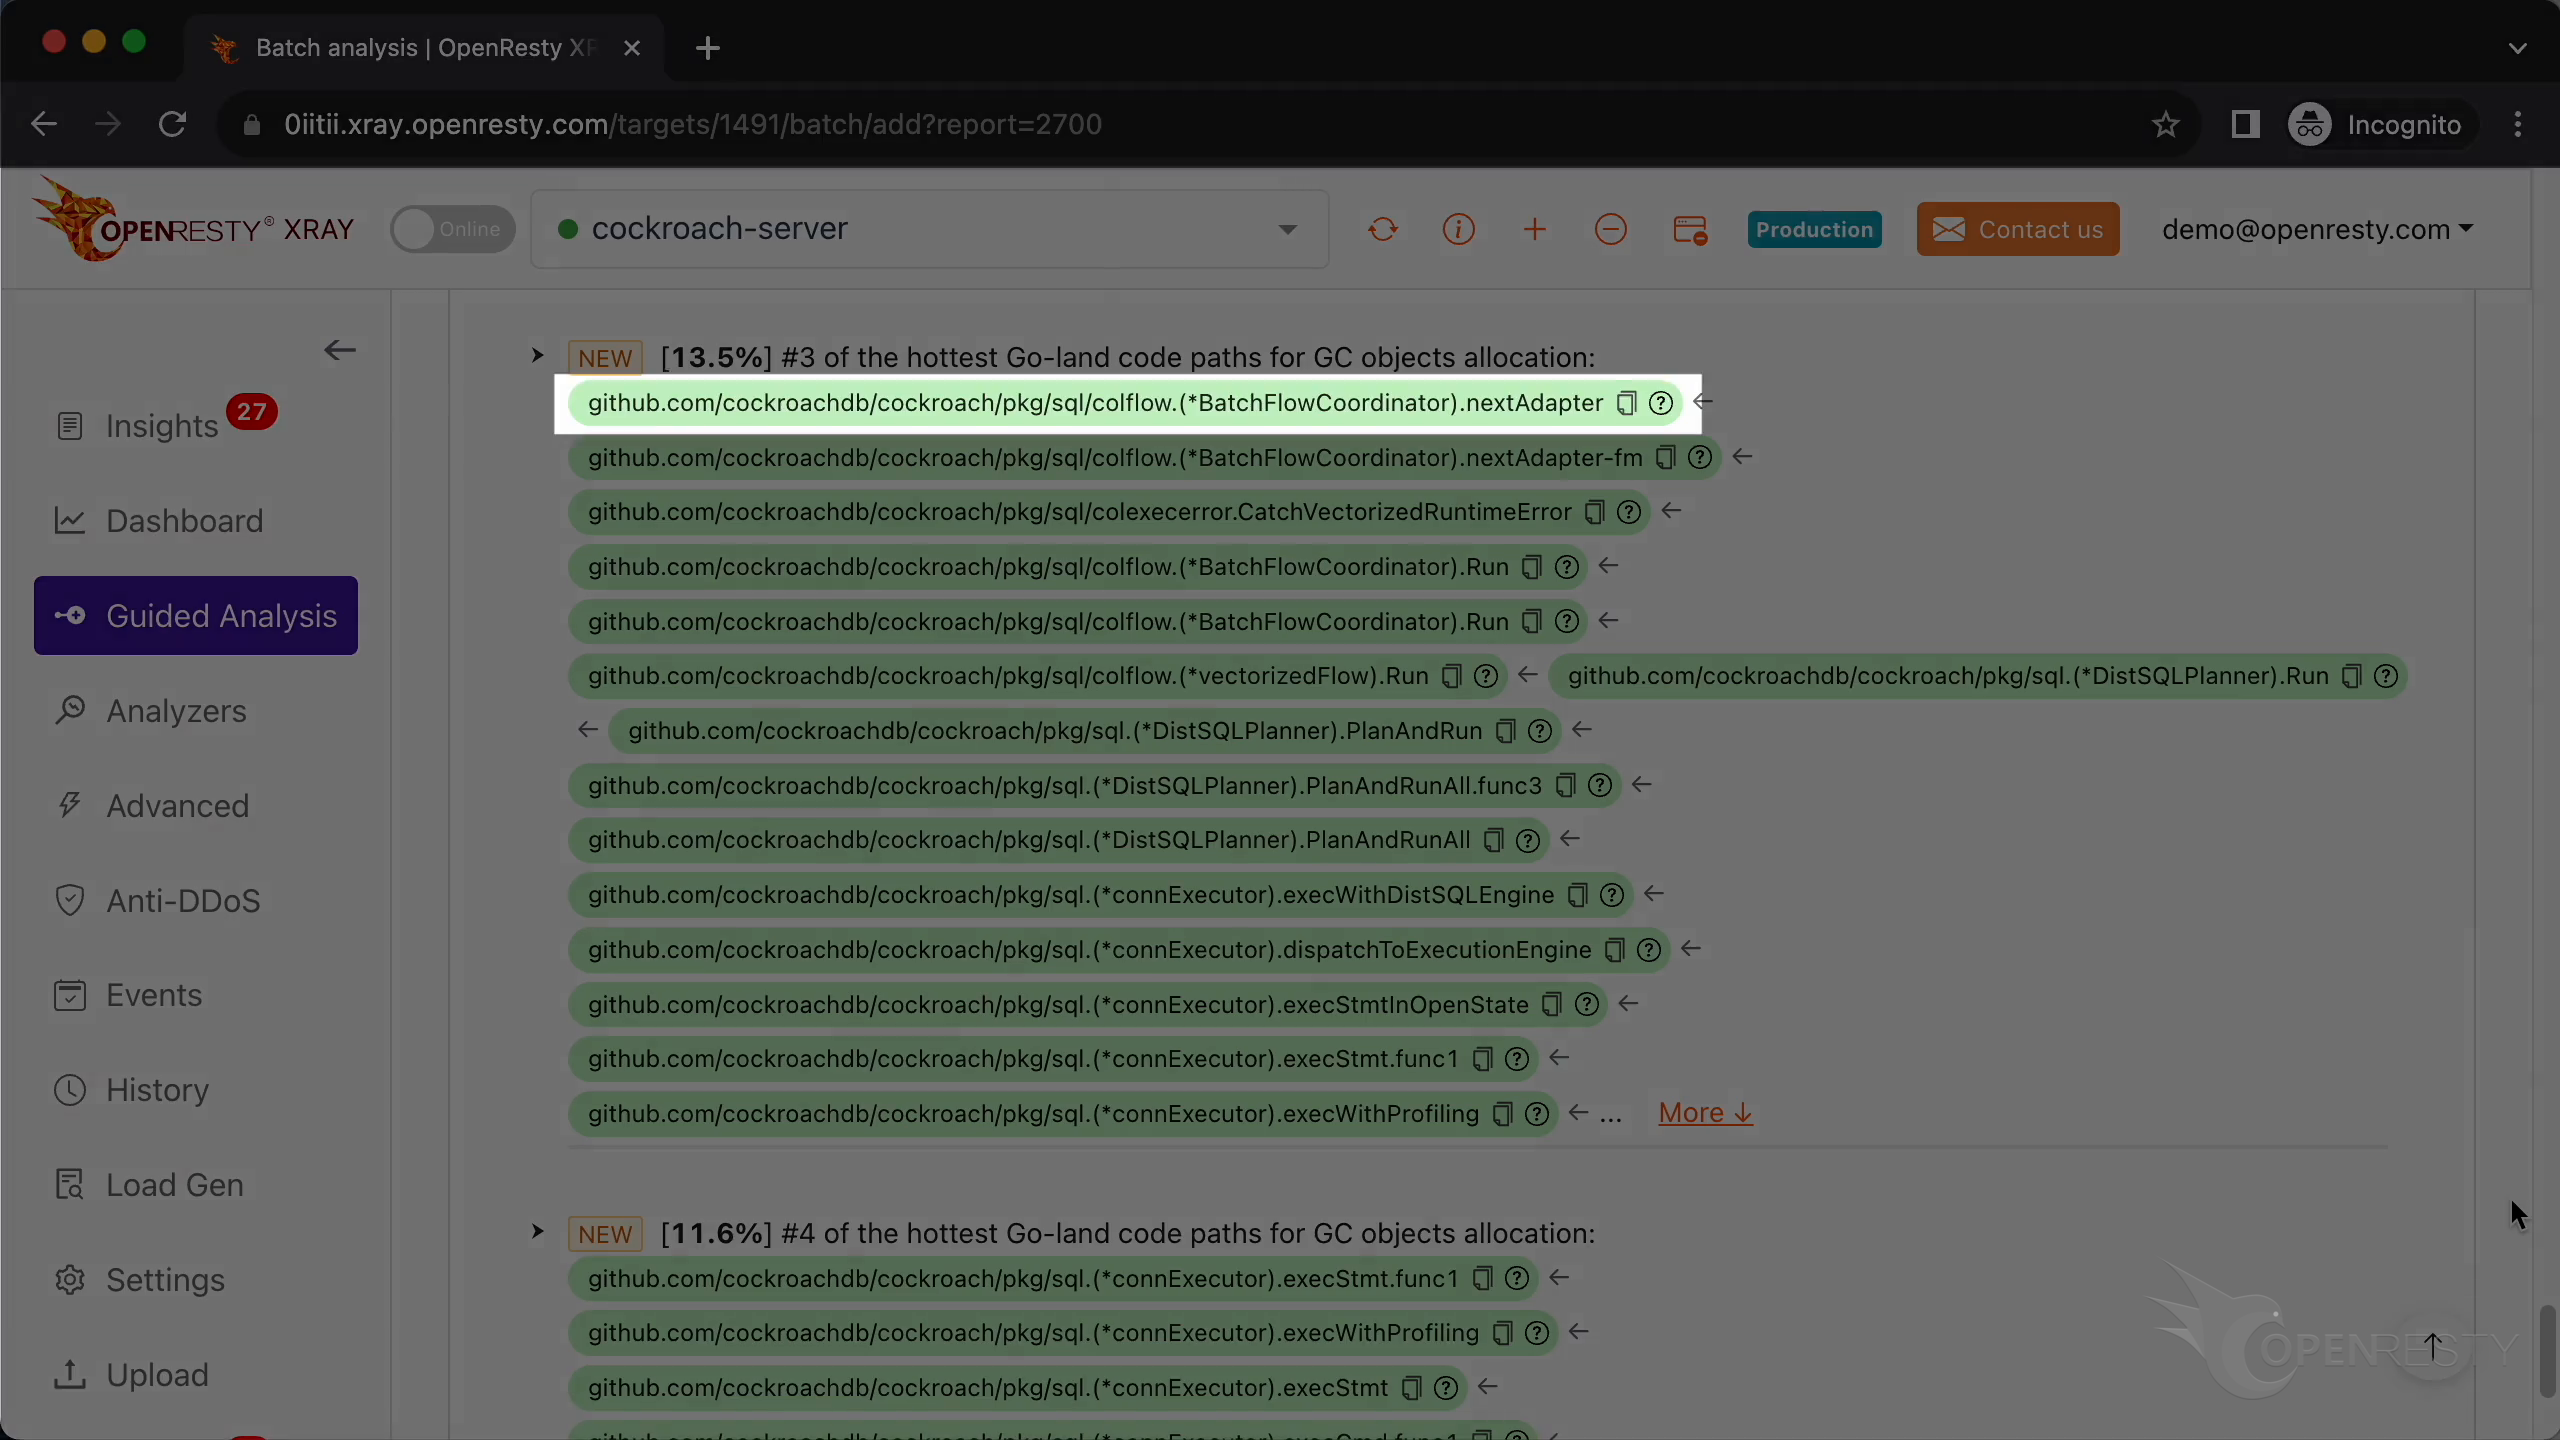
Take a look at the third GC object allocation path.
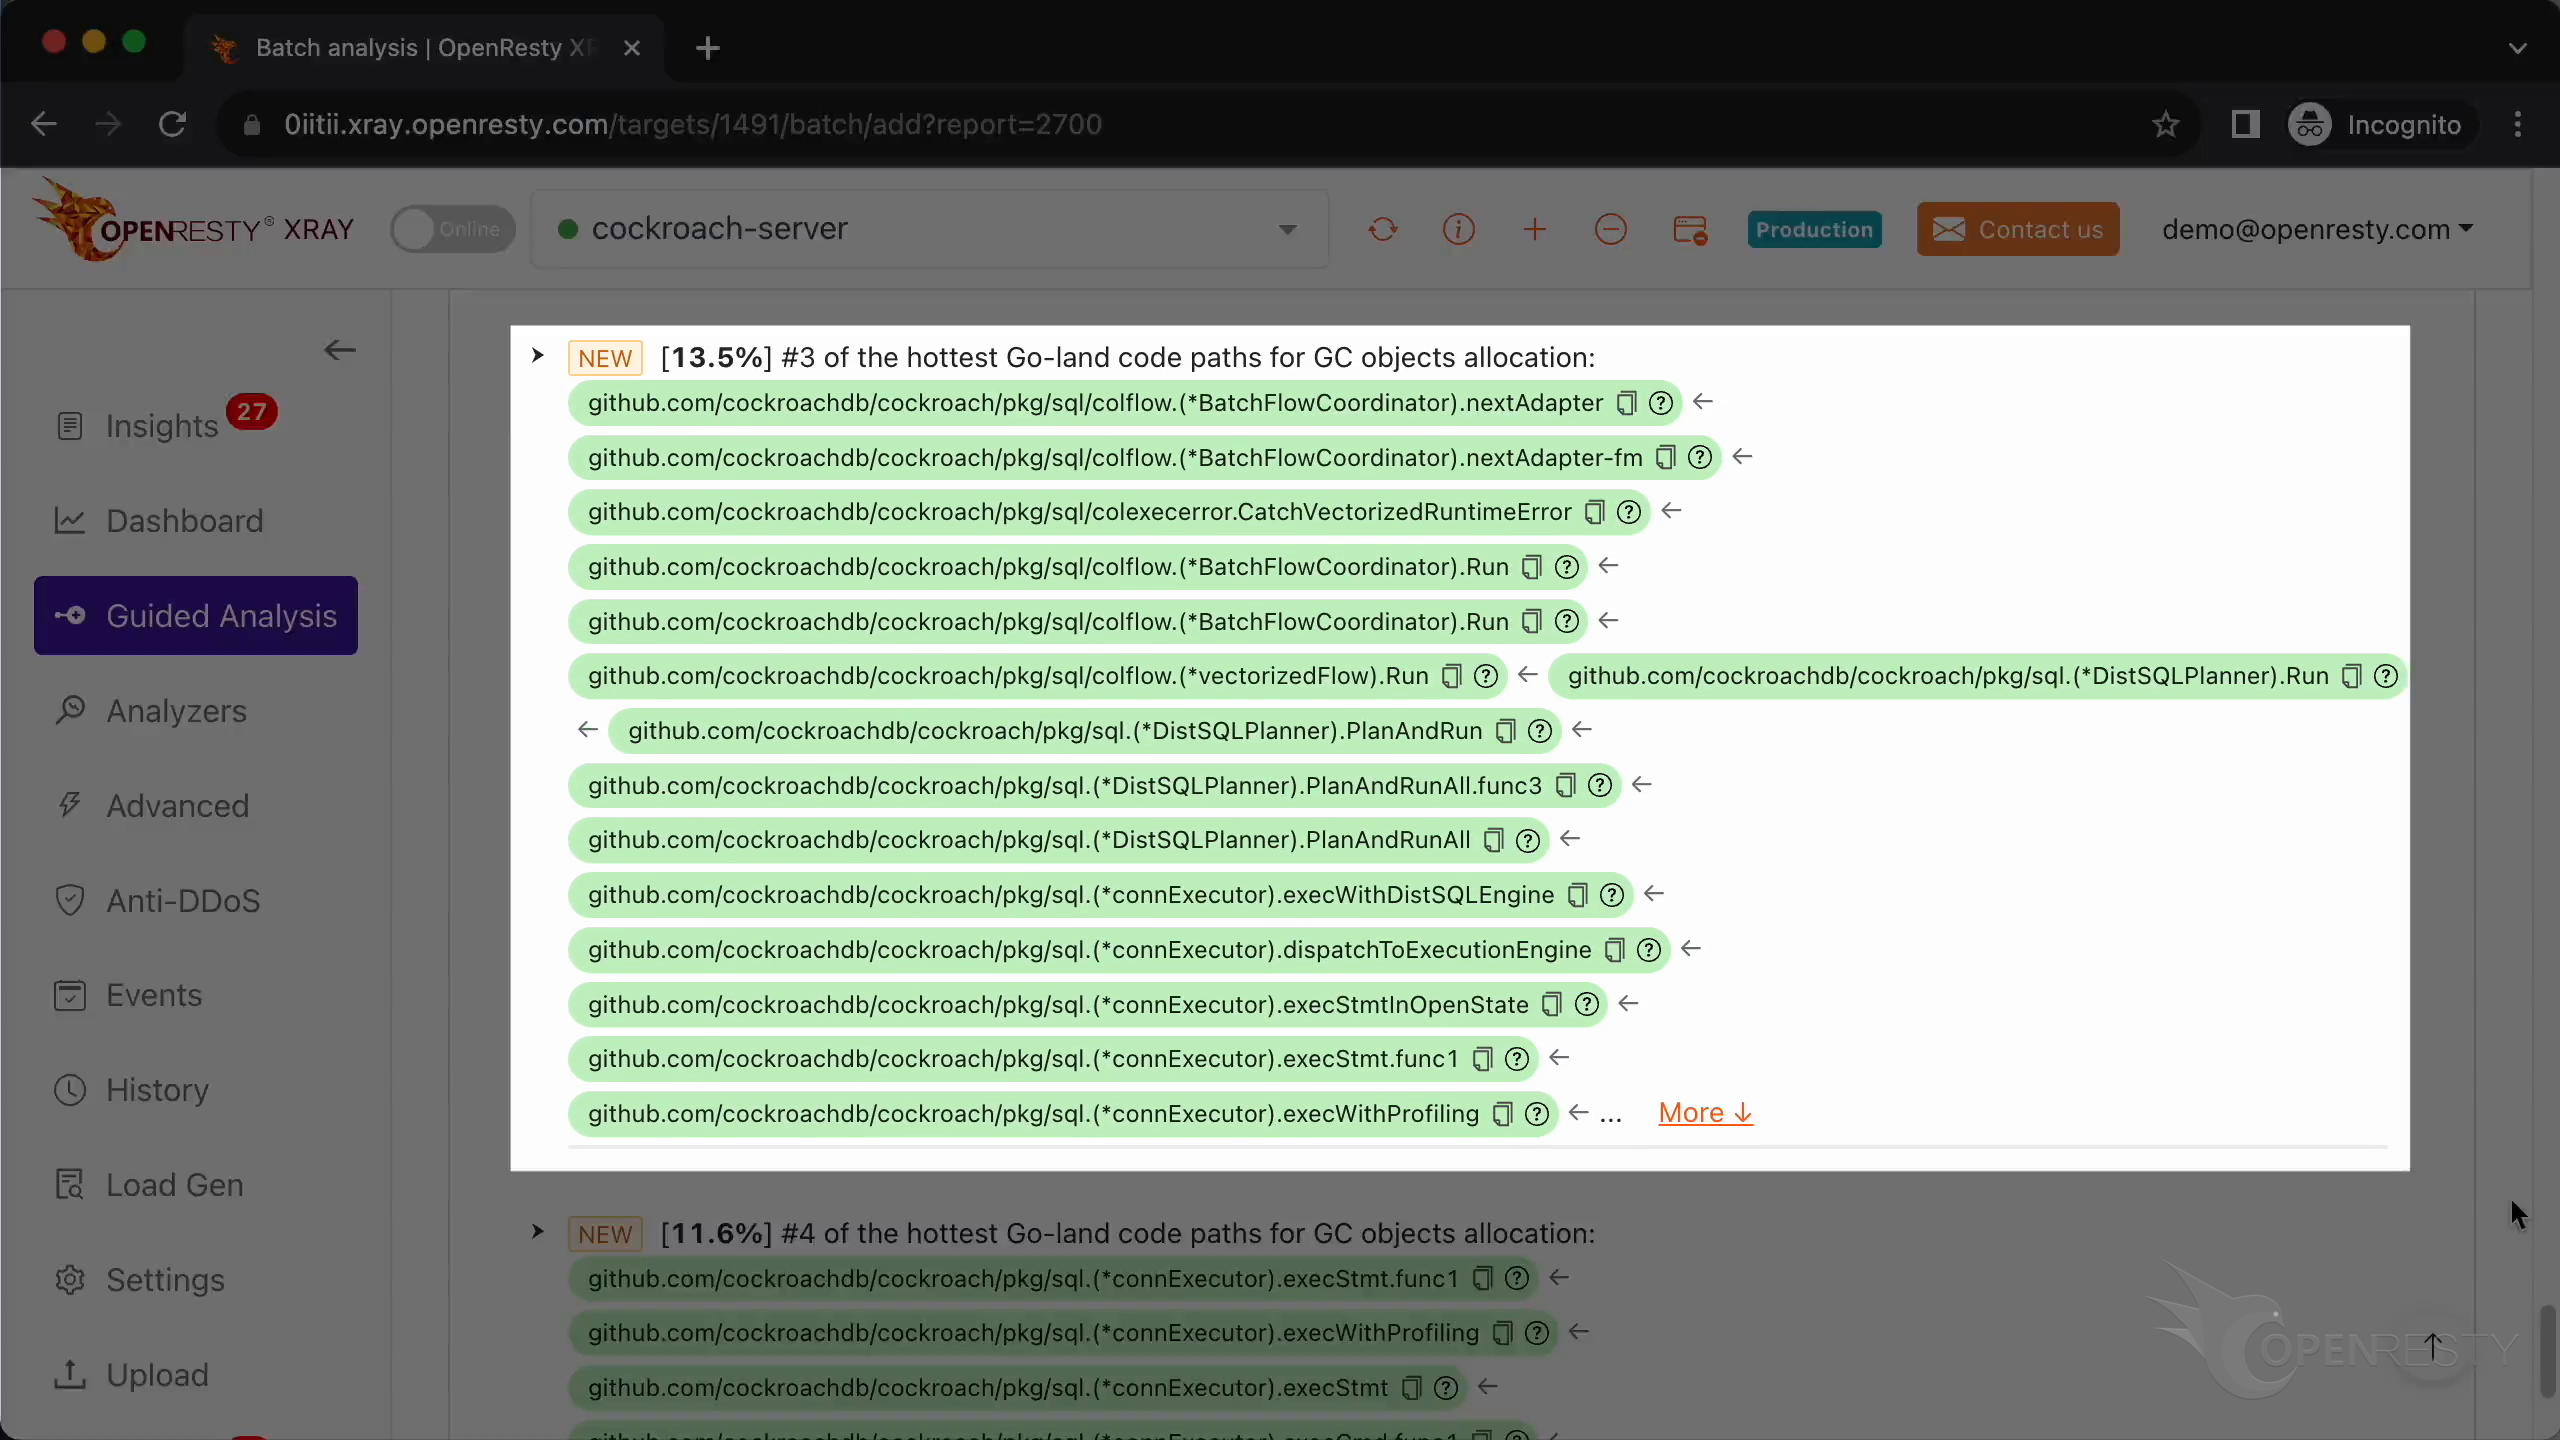
Calling nextAdapter() also creates a large number of GC objects when processing a stream of column data.
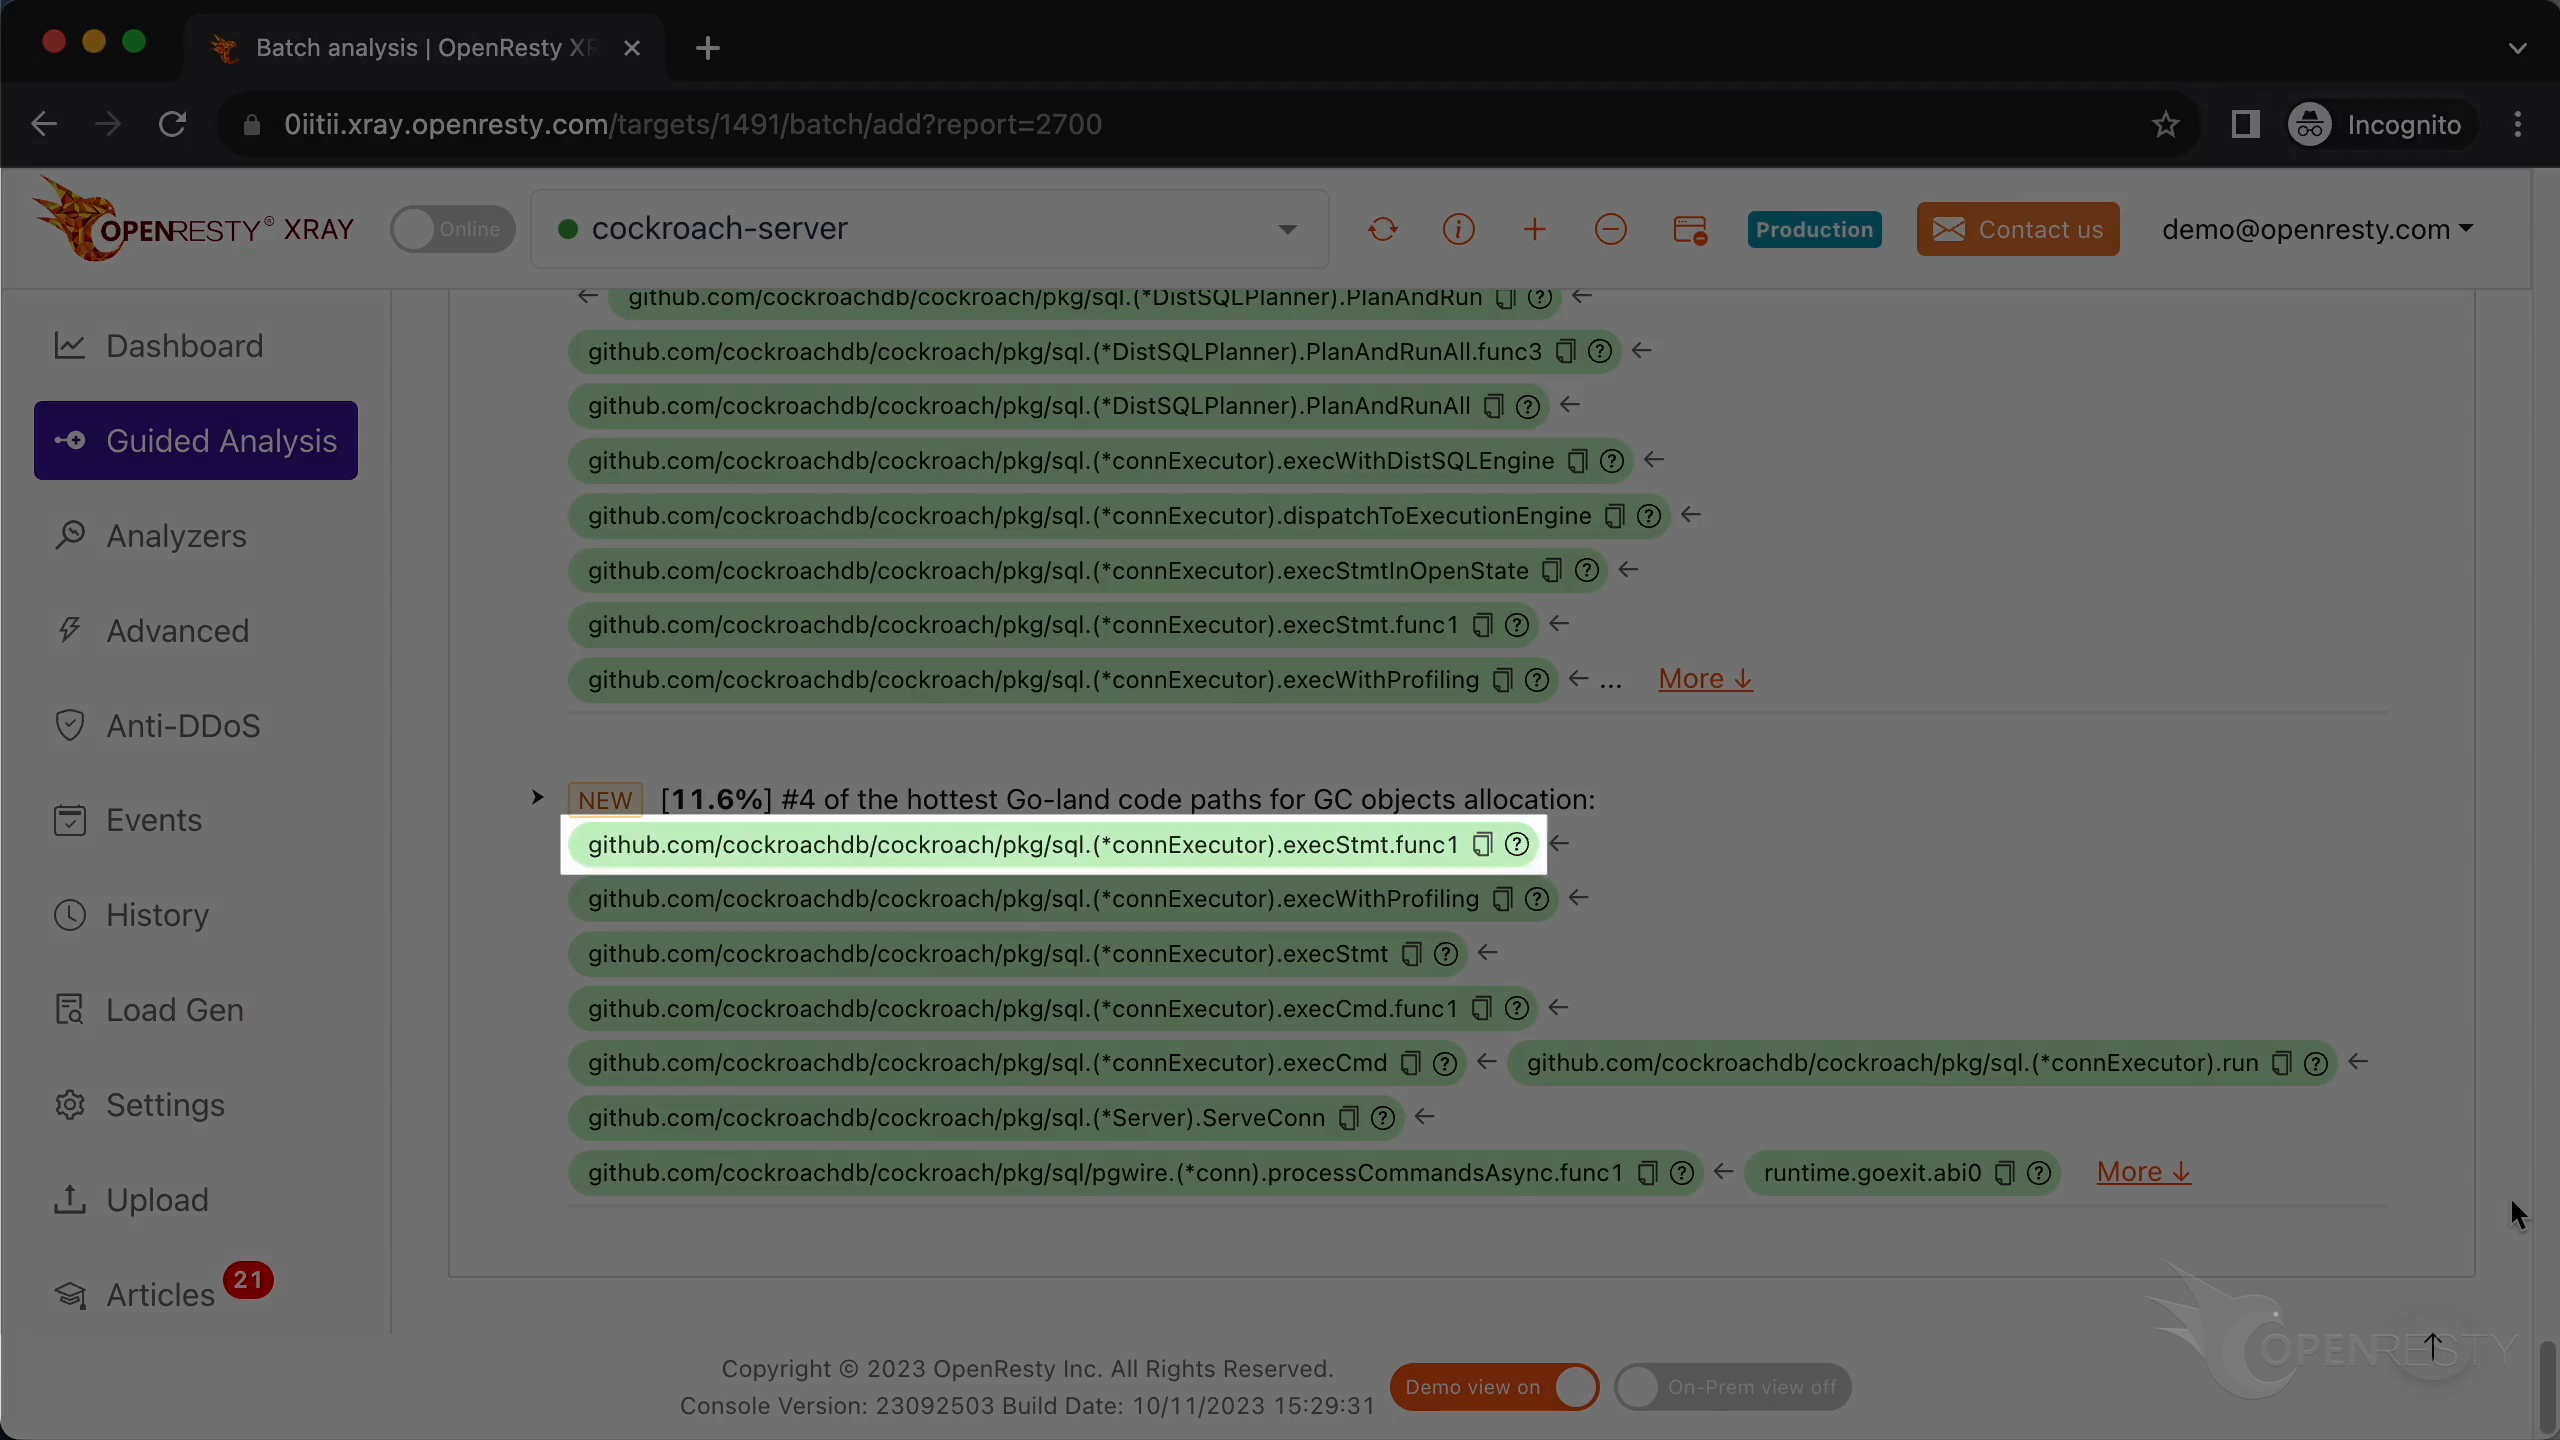
Now we see the fourth Go-code path.
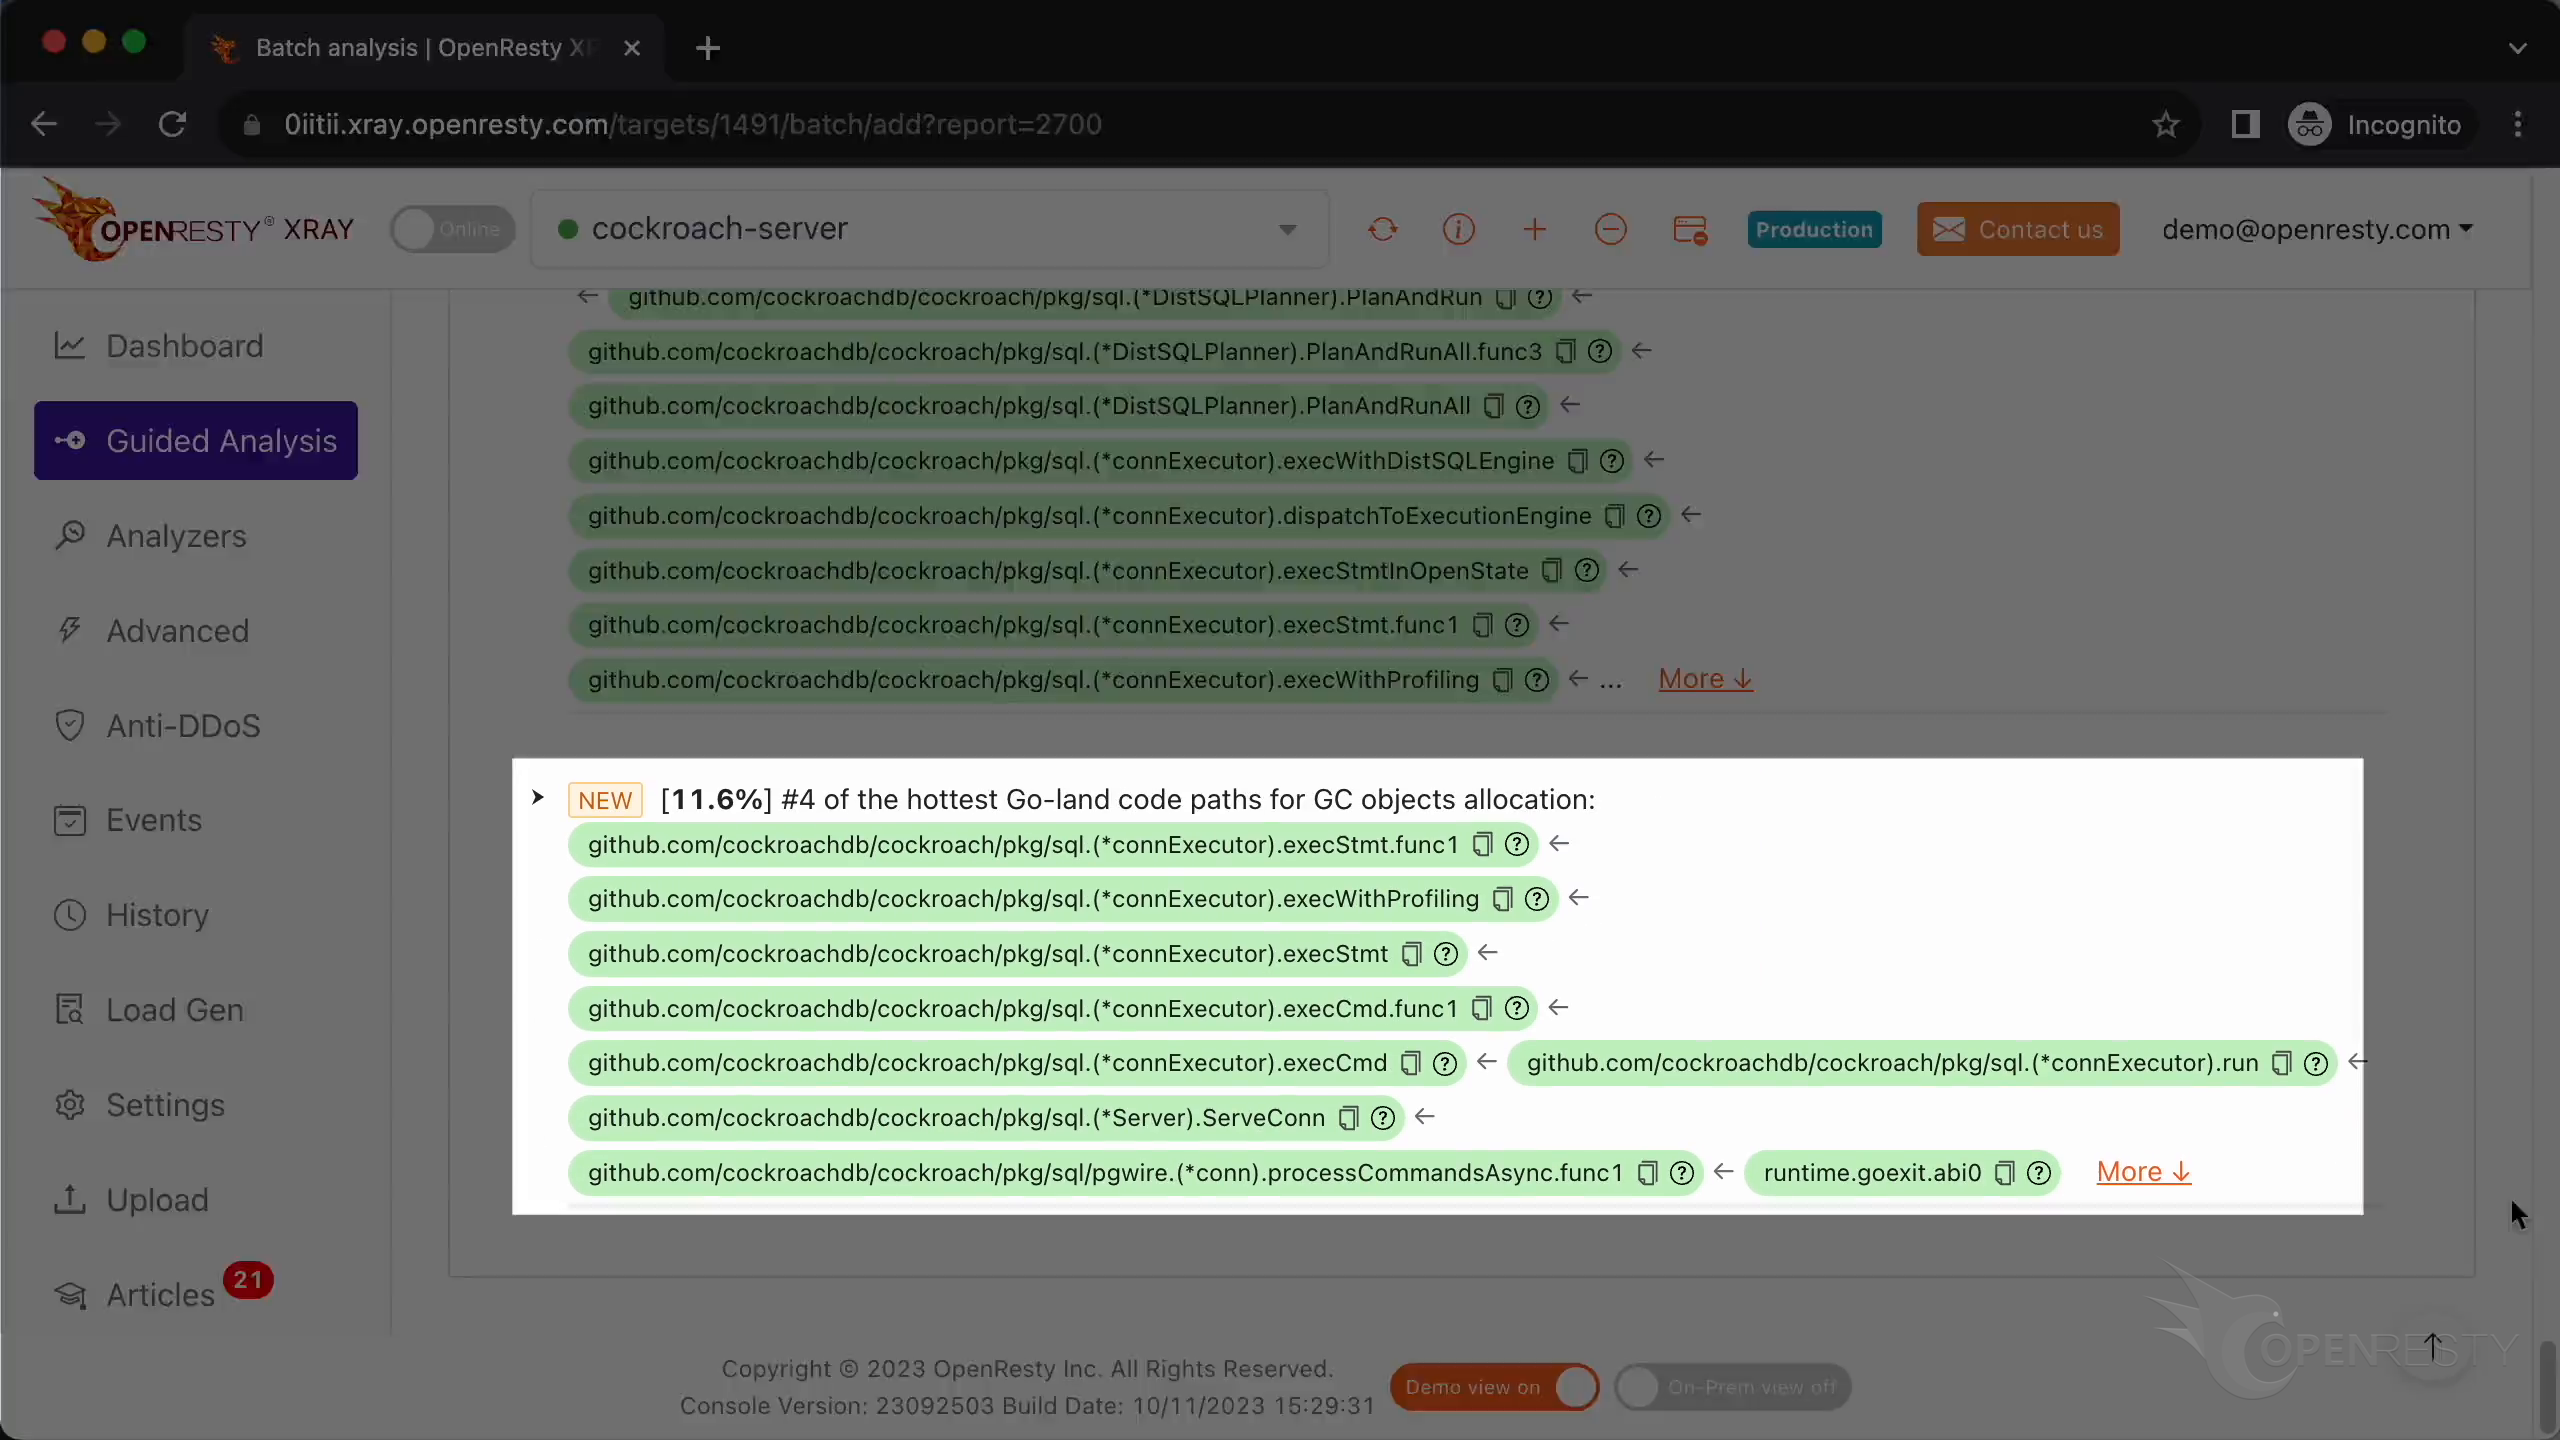
The execStmt function also creates a lot of GC objects during execution.
GC object collection takes up nearly 10% of CPU time.
Automatic analysis and reports
OpenResty XRay can also monitor online processes automatically and show analysis reports.
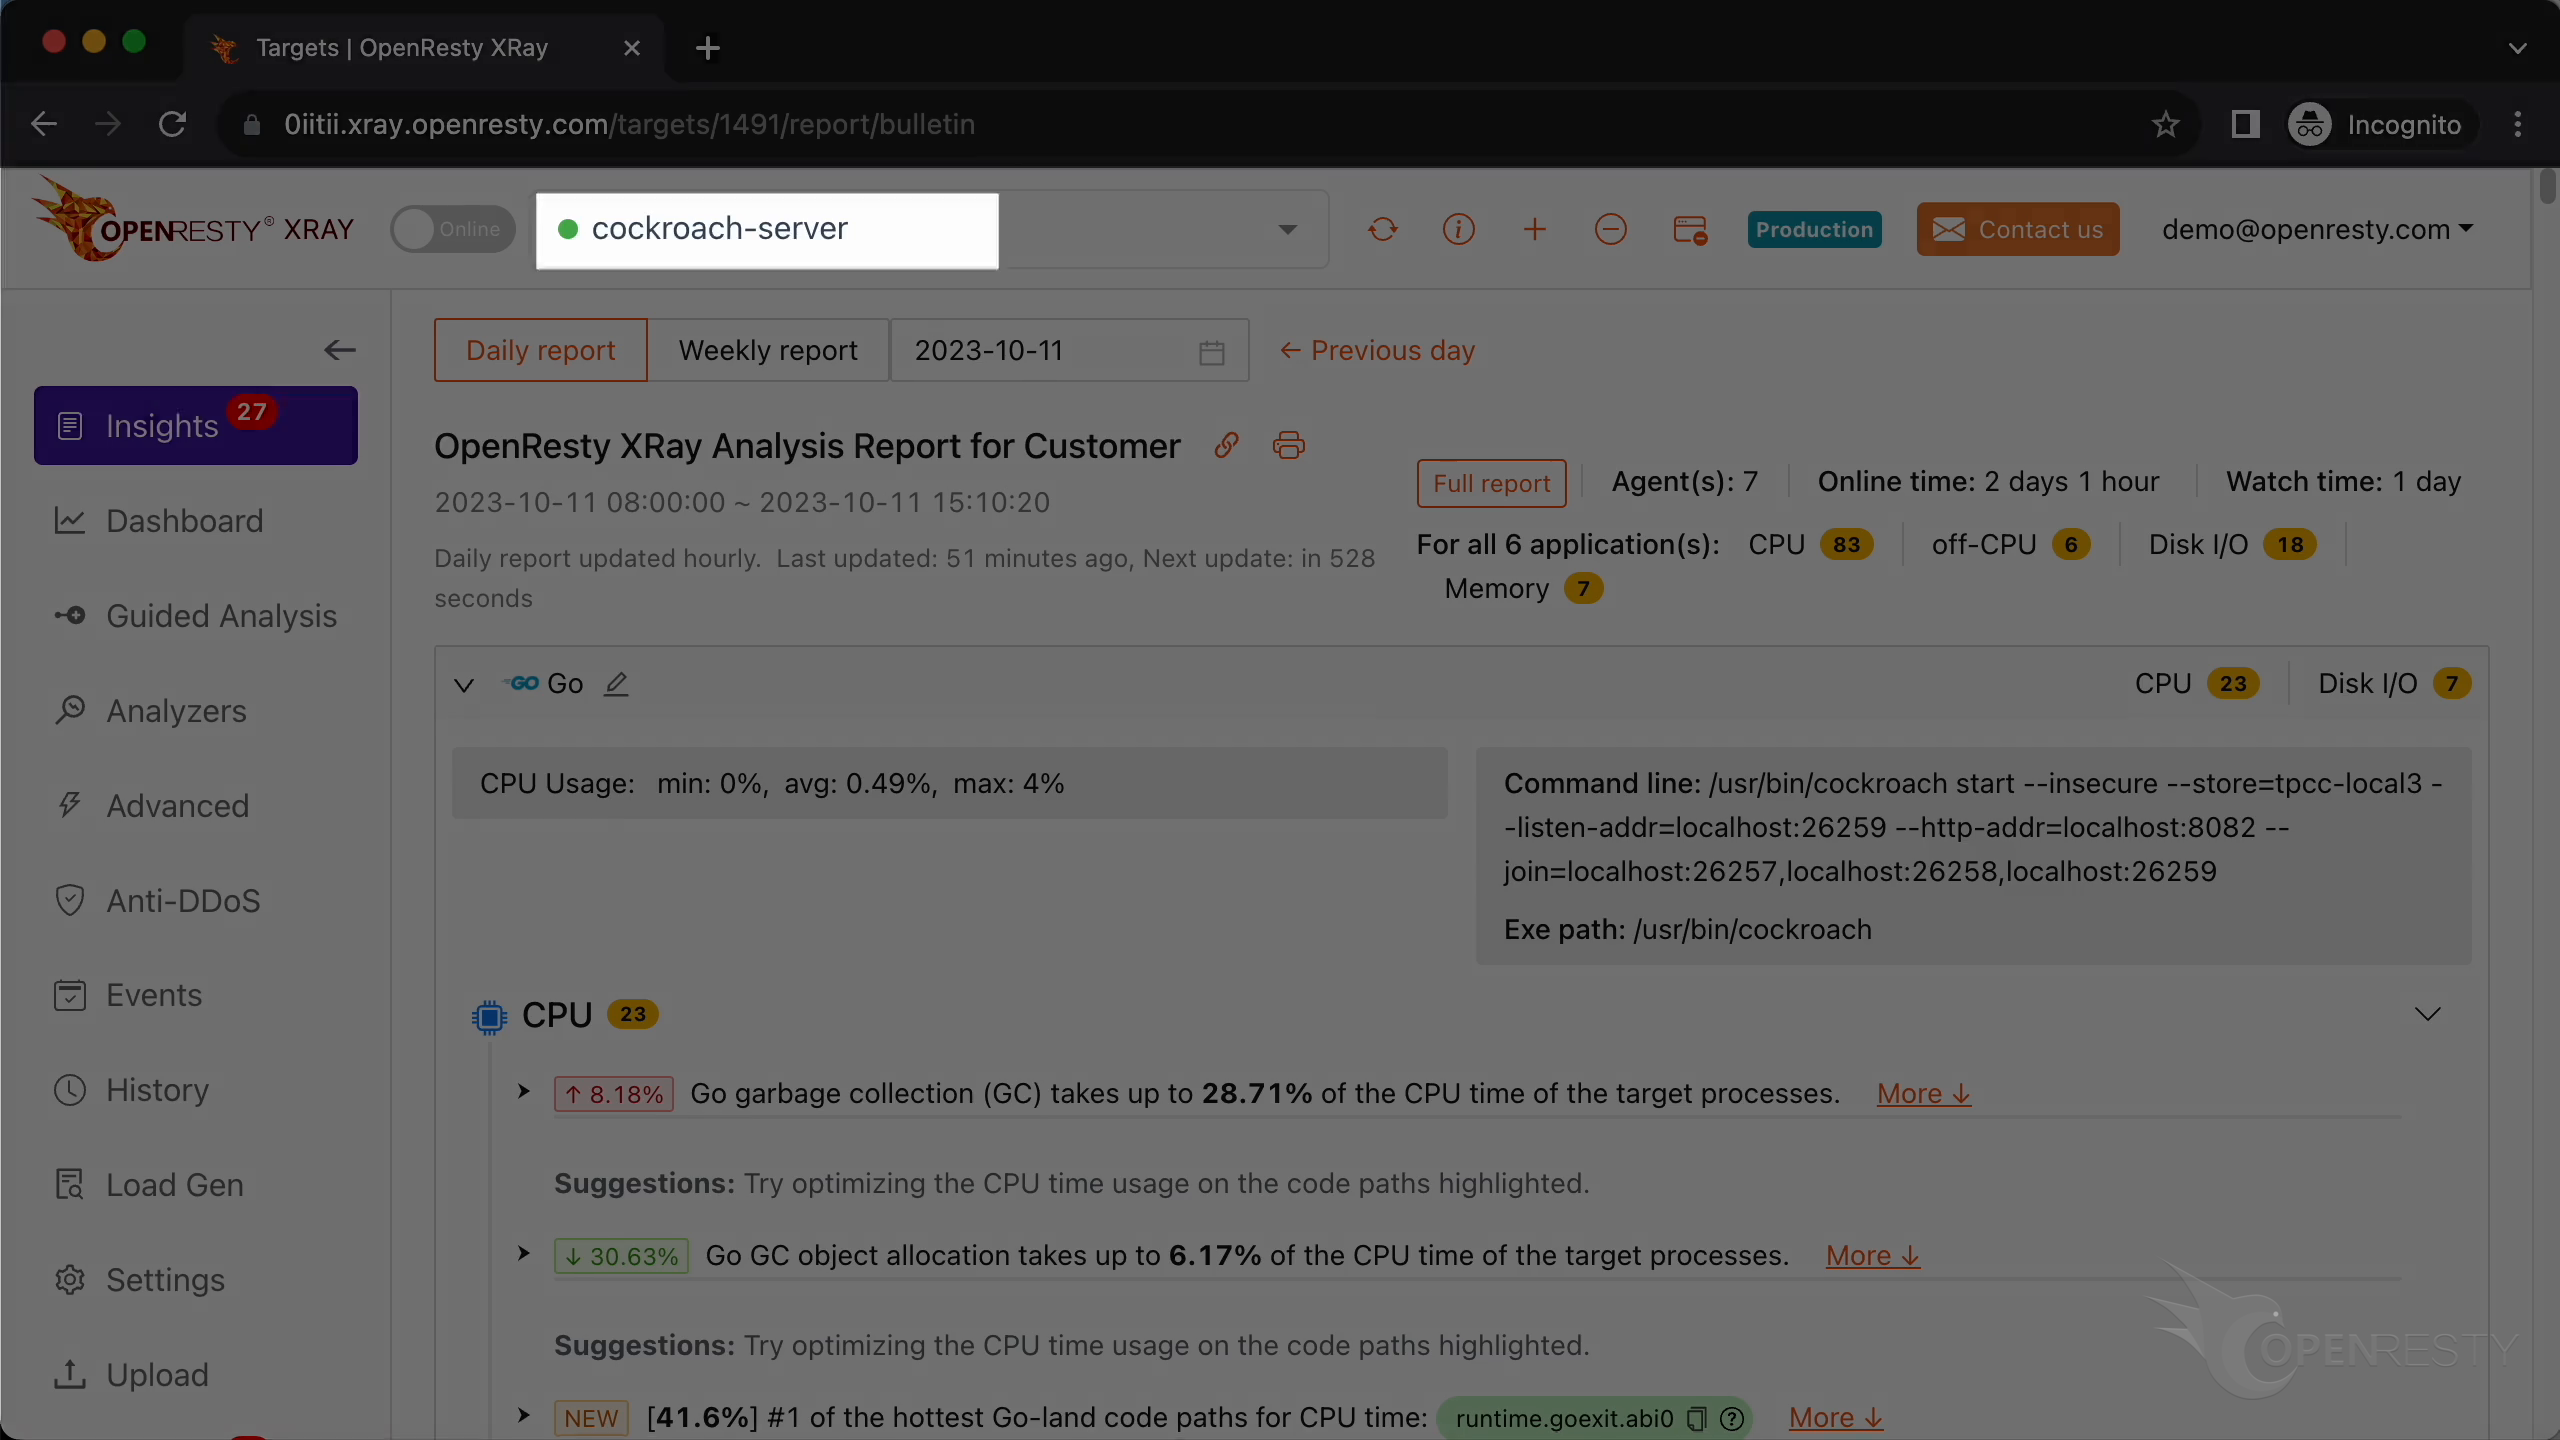
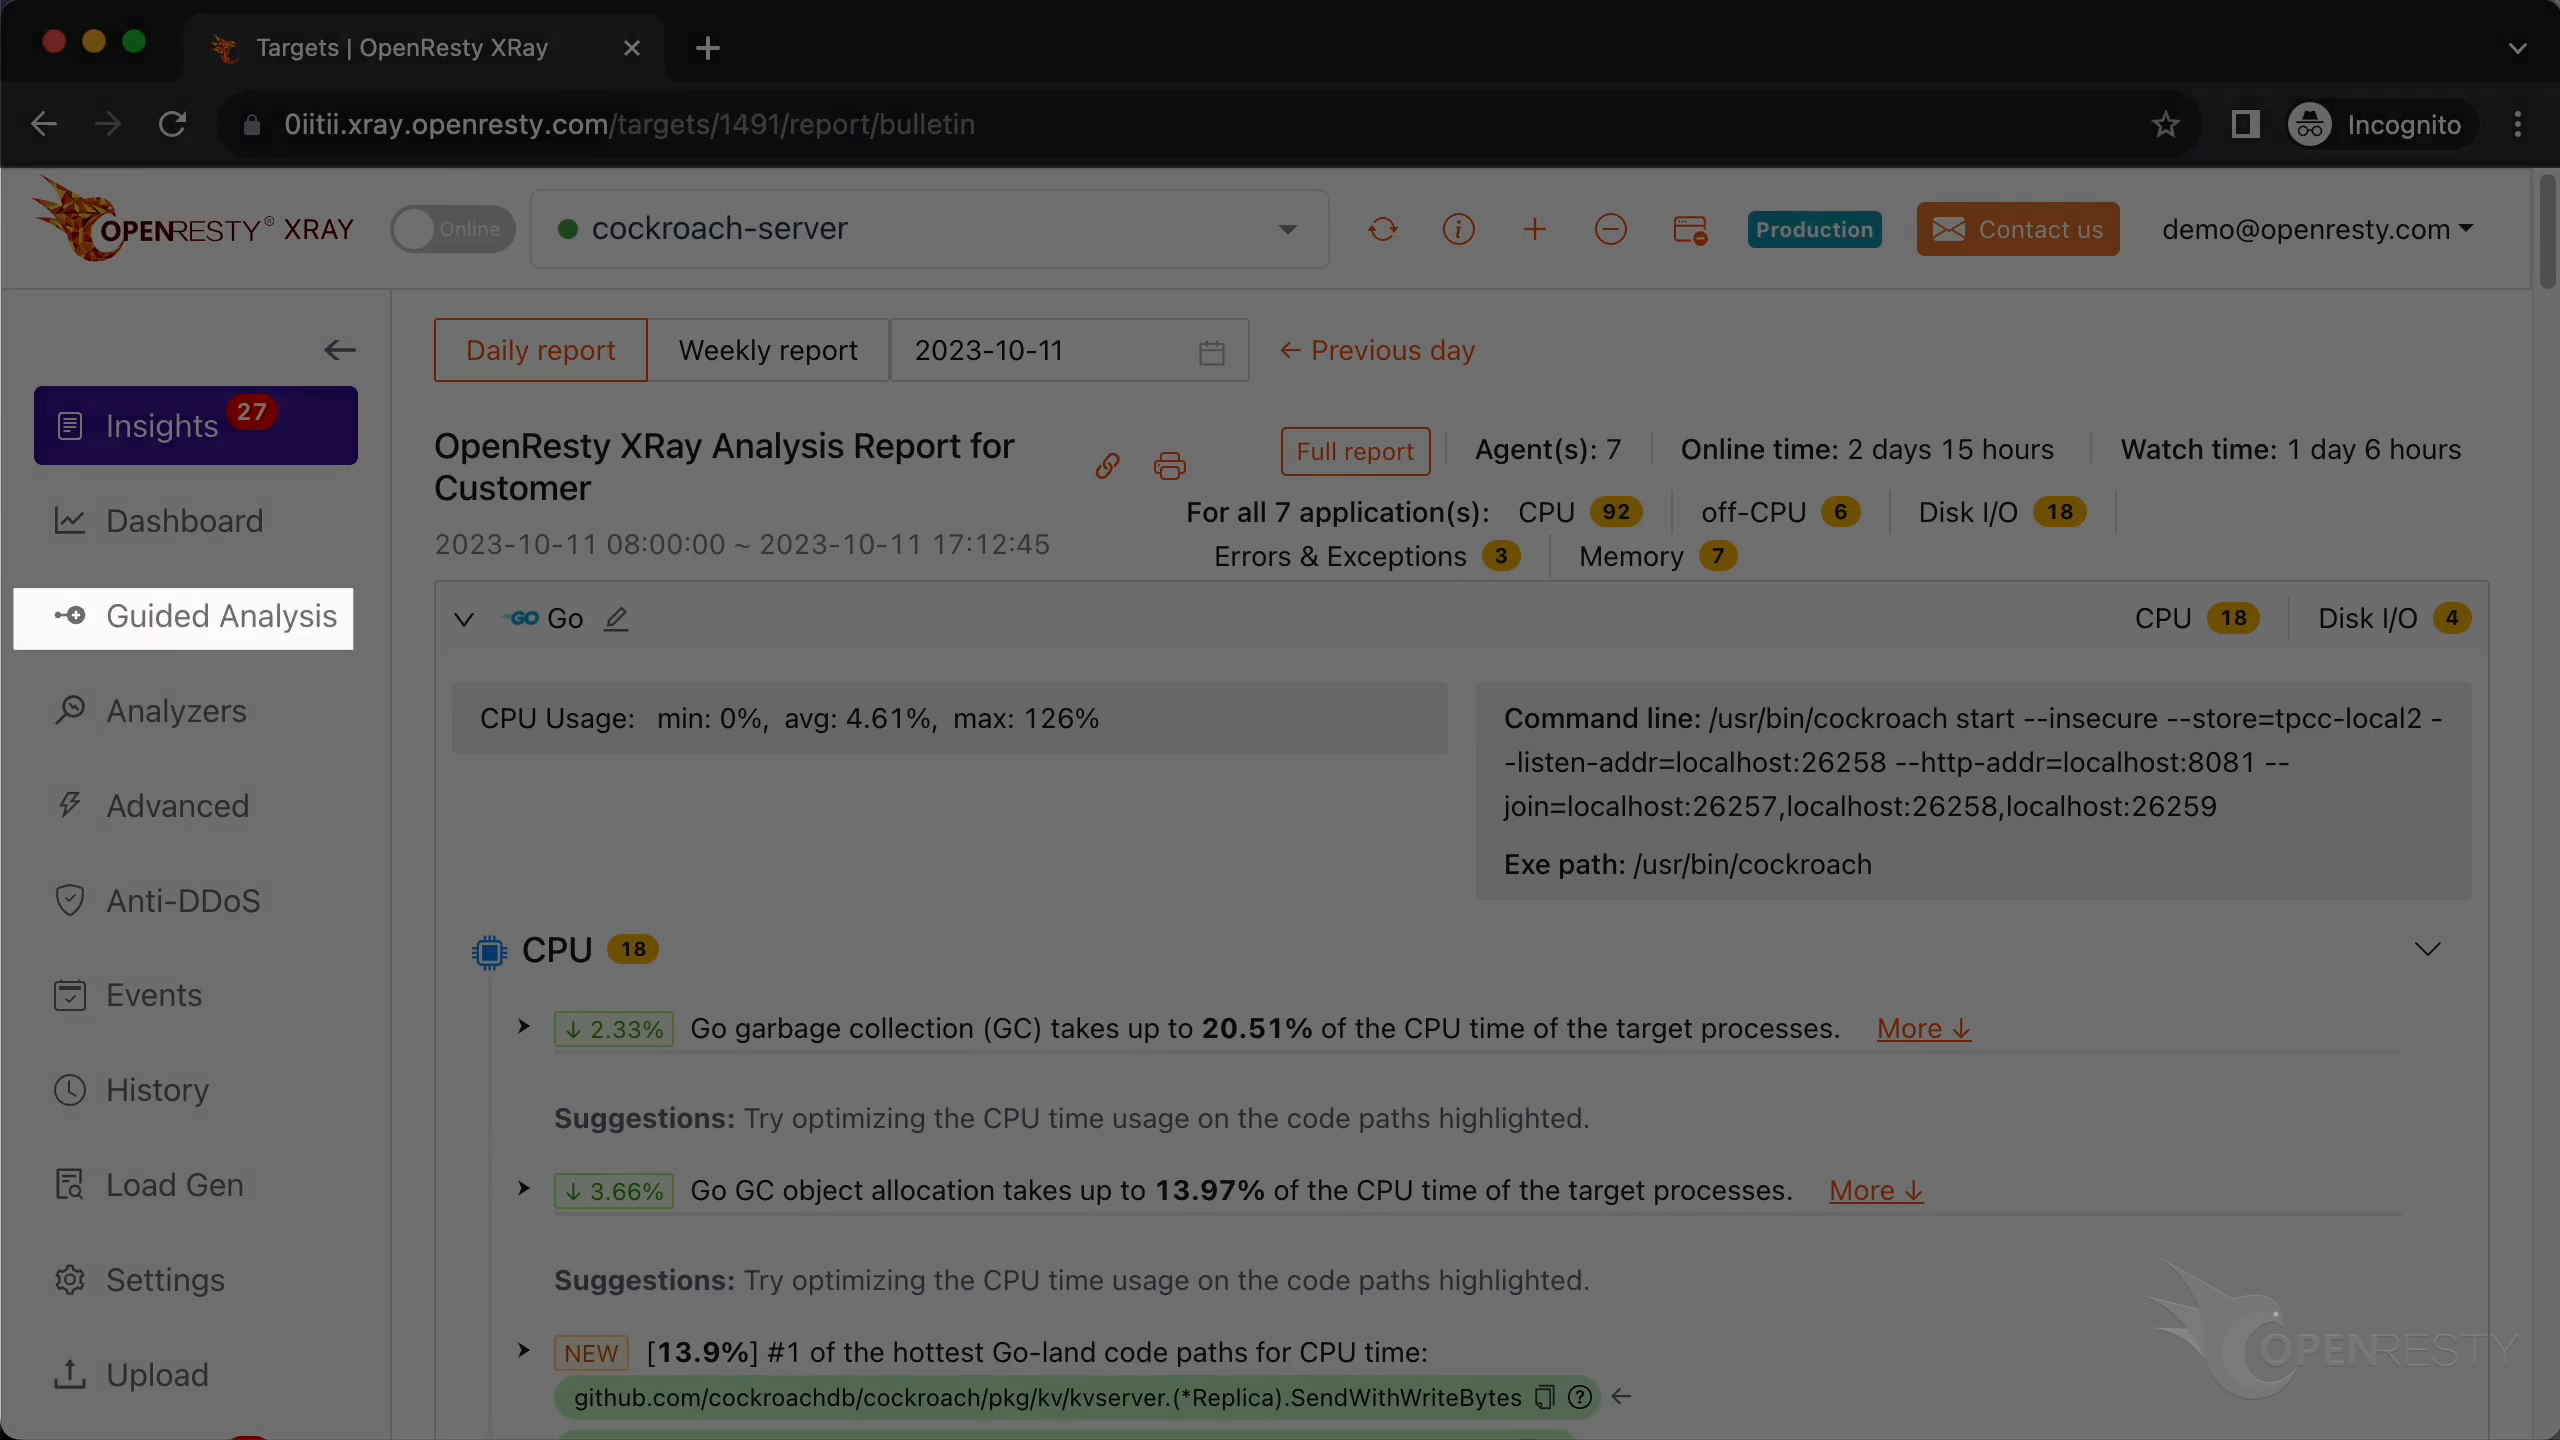
Go to the “Insights” page.
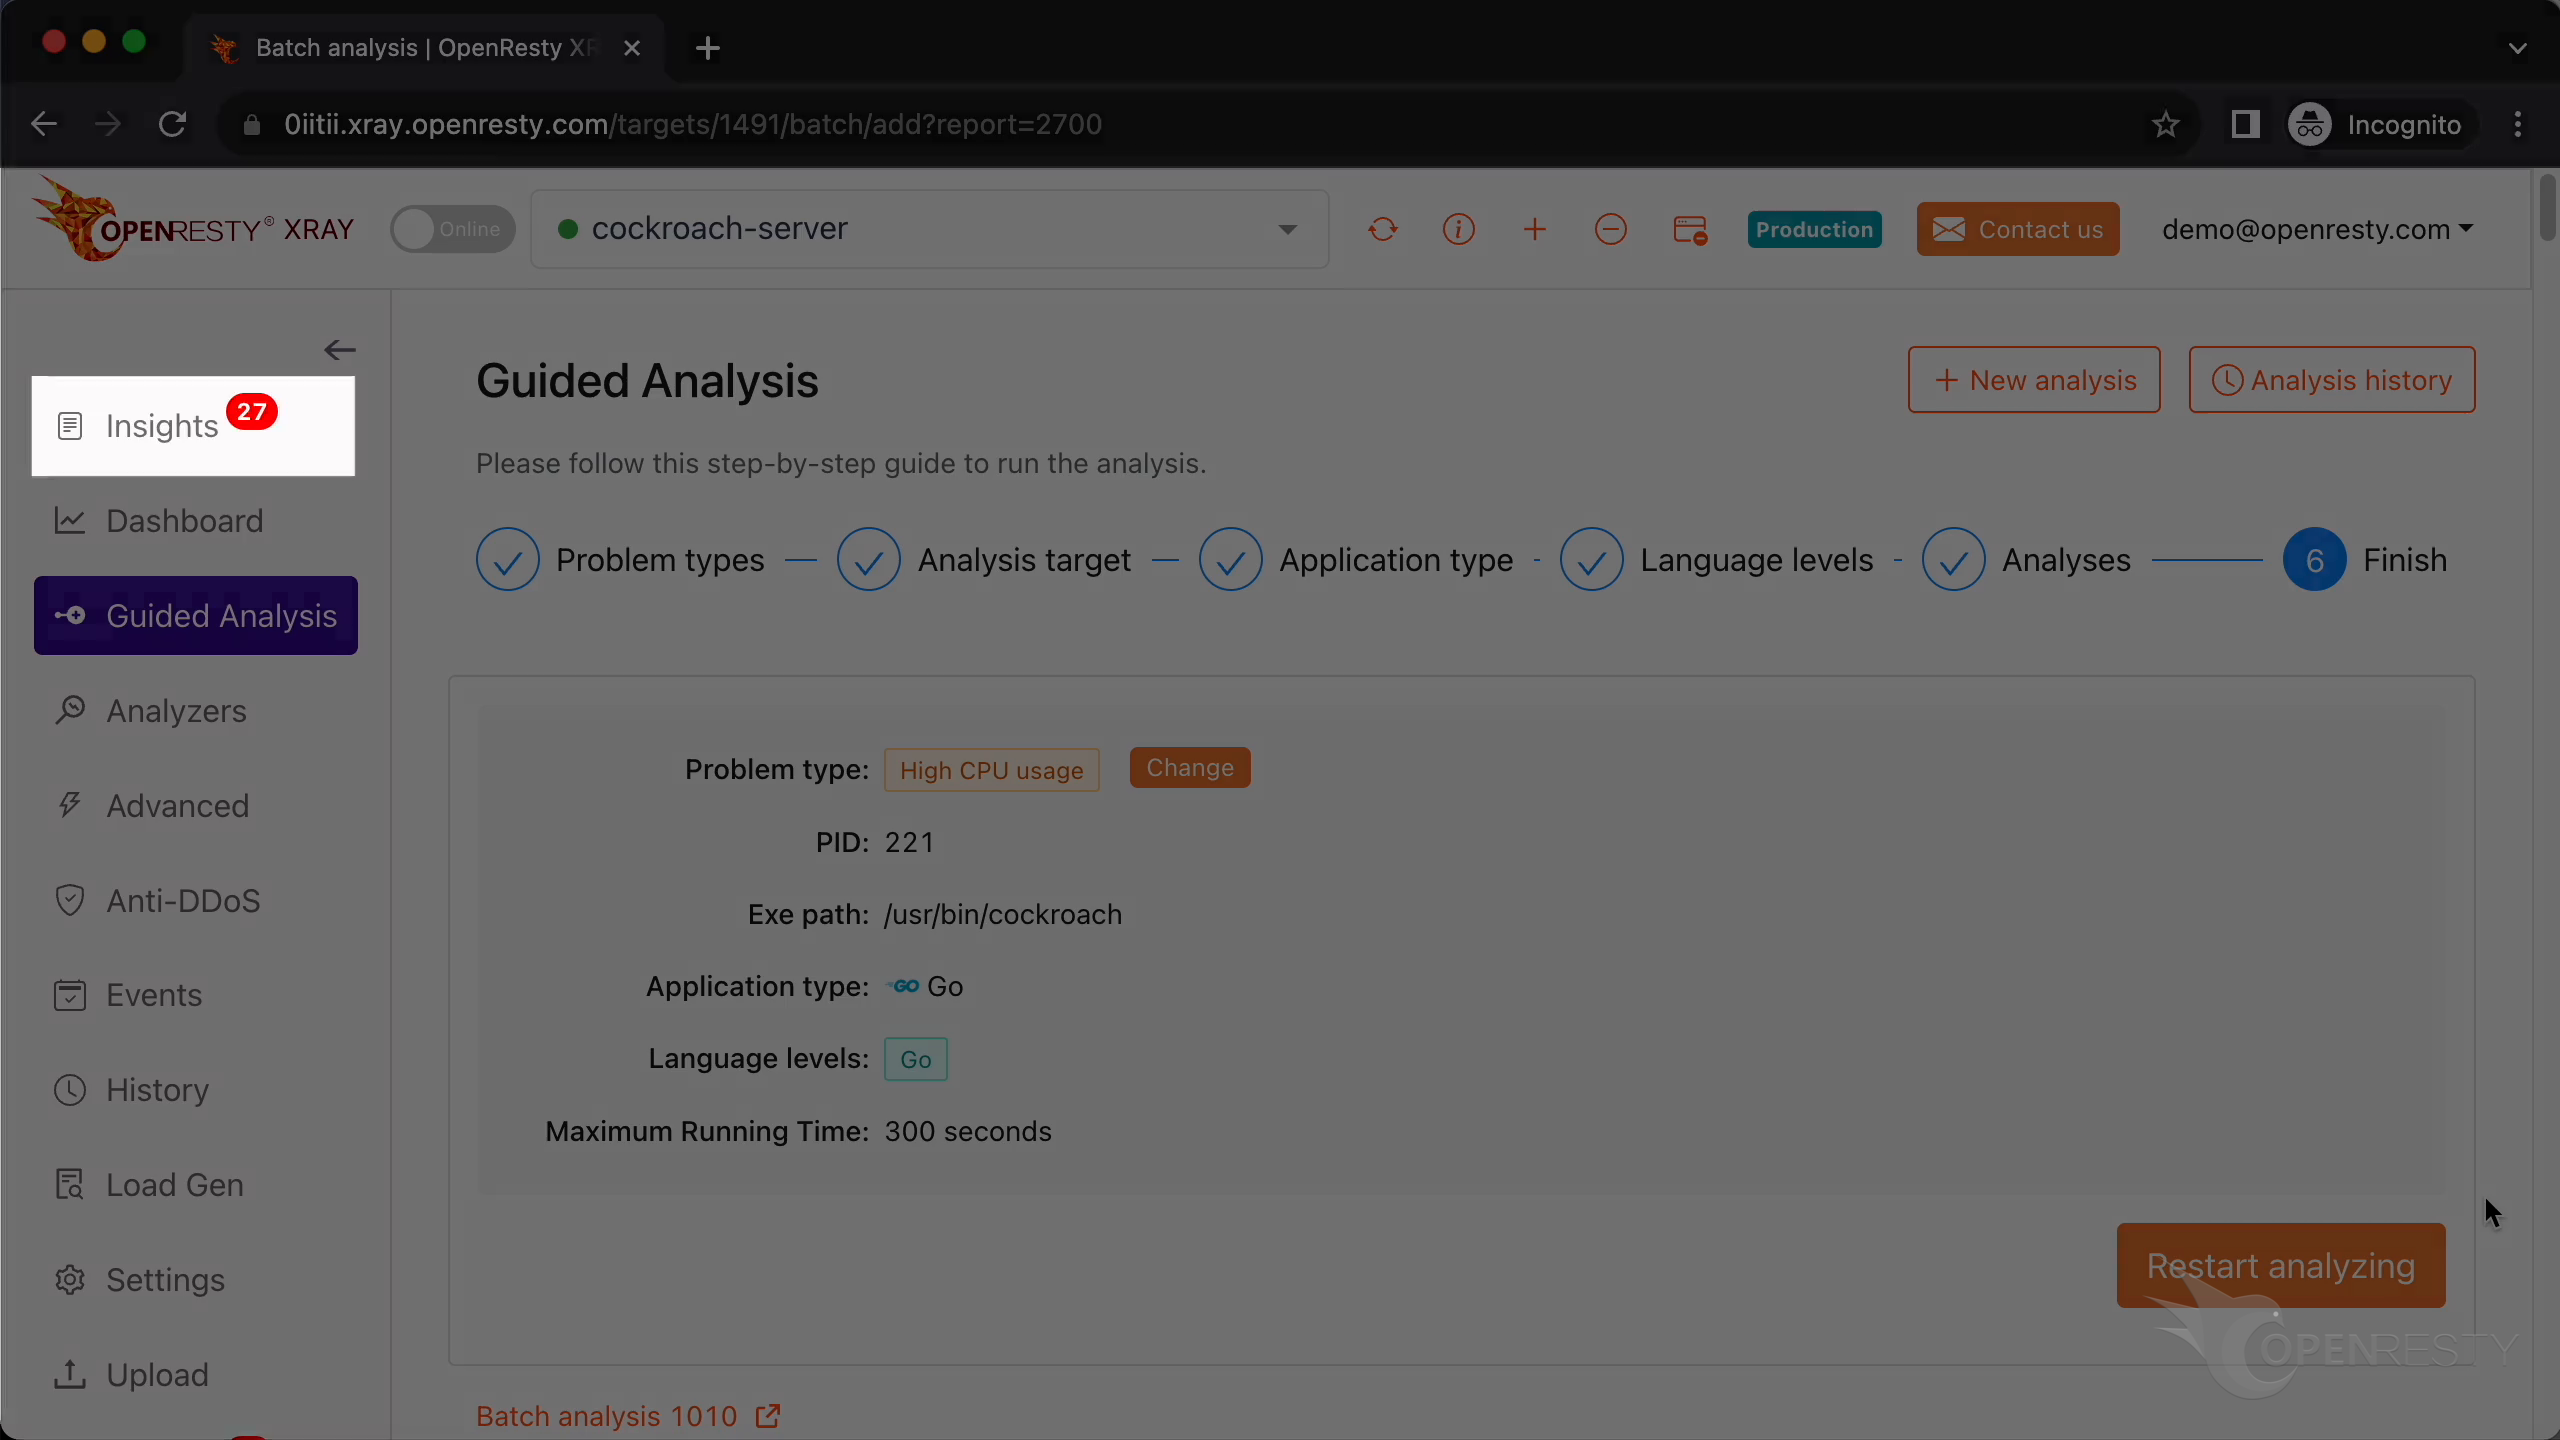
You can find the reports on the Insights page for daily and weekly periods. For this reason, you don’t have to use the “Guided Analysis” feature.
Though “Guided analysis” is useful for application development and demonstration purposes.
What is OpenResty XRay
OpenResty XRay is a dynamic-tracing product that automatically analyzes your running applications to troubleshoot performance problems, behavioral issues, and security vulnerabilities with actionable suggestions. Under the hood, OpenResty XRay is powered by our Y language targeting various runtimes like Stap+, eBPF+, GDB, and ODB, depending on the contexts.
If you like this tutorial, please subscribe to this blog site and/or our YouTube channel. Thank you!
About The Author
Yichun Zhang (Github handle: agentzh), is the original creator of the OpenResty® open-source project and the CEO of OpenResty Inc..
Yichun is one of the earliest advocates and leaders of “open-source technology”. He worked at many internationally renowned tech companies, such as Cloudflare, Yahoo!. He is a pioneer of “edge computing”, “dynamic tracing” and “machine coding”, with over 22 years of programming and 16 years of open source experience. Yichun is well-known in the open-source space as the project leader of OpenResty®, adopted by more than 40 million global website domains.
OpenResty Inc., the enterprise software start-up founded by Yichun in 2017, has customers from some of the biggest companies in the world. Its flagship product, OpenResty XRay, is a non-invasive profiling and troubleshooting tool that significantly enhances and utilizes dynamic tracing technology. And its OpenResty Edge product is a powerful distributed traffic management and private CDN software product.
As an avid open-source contributor, Yichun has contributed more than a million lines of code to numerous open-source projects, including Linux kernel, Nginx, LuaJIT, GDB, SystemTap, LLVM, Perl, etc. He has also authored more than 60 open-source software libraries.
Related Articles
OpenResty XRay Nov 24, 2023
")
OpenResty XRay Sep 28, 2023
")
OpenResty XRay Sep 27, 2023
")
OpenResty XRay Sep 21, 2023
")
OpenResty XRay Sep 1, 2023
")


")
")
")
")
")